Constellium SE

Constellium SE (CSTM) Market Cap

Constellium SE has a market capitalization of $4.61B.

Price: $33.89

-2.26 (-6.25%)

Market Cap: 4.61B

NYSE · time unavailable

CEO: Ingrid Joerg

Sector: Basic Materials

Industry: Aluminum

IPO Date: 2013-05-23

Website: https://www.constellium.com

Constellium SE (CSTM) - Company Information

Market Cap: 4.61B|Sector: Basic Materials

Company Profile

Constellium SE, together with its subsidiaries, engages in the design, manufacture, and sale of specialty rolled and extruded aluminum products for the packaging, aerospace, and automotive end-markets. The company operates through three segments: Packaging & Automotive Rolled Products, Aerospace & Transportation, and Automotive Structures & Industry. The Packaging & Automotive Rolled Products segment produces rolled aluminum products, including can stock and closure stock for the beverage and food industry, as well as foil stock for the flexible packaging market. It also supplies automotive body sheets and heat exchangers for the automotive market; and specialty reflective sheets. The Aerospace & Transportation segment provides rolled aluminum products, including aerospace plates, sheets, and extrusions; and aerospace wing skins, as well as plates and sheets for use in transportation, industry, and defense applications. The Automotive Structures & Industry segment offers extruded products and technologically advanced structures for the automotive industry, including crash-management systems, body structures, side impact beams, and battery enclosures; and hard and soft alloy extruded profiles for various industry applications in the automotive, engineering, rail, and other transportation end markets. This segment also provides downstream technology and services, which include pre-machining, surface treatment, research and development, and technical support services. The company sells its products directly or through distributors in France, Germany, the Czech Republic, the United Kingdom, Switzerland, and the United States, as well as Shanghai, and Seoul. Constellium SE was incorporated in 2010 and is headquartered in Paris, France.

Analyst Sentiment

77%
Strong Buy

From 5 Active Polls

1Y Forecast: $36.25

▲ +7.0% Potential Upside

Consensus Target Metrics

Low Bound

$32

Median

$37

High Bound

$40

Average

$36

Price & Moving Averages

Loading chart...

🎯 Wall Street Analyst Intelligence Report

1-Year structural target targets, chart projections, and sentiment maps.

Average 1Y Target
$36.25
▲ +6.96% Upside
Low Target
$32.00
-6% Risk
Median Target
$36.50
8% Mid
High Target
$40.00
18% Max
Consensus
Buy
13 / 17 Buys

Consensus Trend Projection

Trailing closures vs. 12-month metrics map.

Analyst Vote Distribution

Aggregate institutional coverage sentiment weights.

📊 Historical Valuation Multiples

Real-time Trailing Twelve Month (TTM) momentum side-by-side with discrete quarterly metrics.

Fiscal QuarterTTMQ1 2026Q4 2025Q3 2025Q2 2025Q1 2025Q4 2024Q3 2024Q2 2024
Period EndingTrailing 12MMar 31, 2026Dec 31, 2025Sep 30, 2025Jun 30, 2025Mar 31, 2025Dec 31, 2024Sep 30, 2024Jun 30, 2024
Market Cap ($M)4,6143,3282,5782,0631,8731,4381,4432,1242,528
Enterprise Value ($M)6,4445,1584,4024,0733,8903,3813,2373,8004,331
Price to Earnings Ratio (P/E)10.684.185.765.8615.3110.67-8.6183.198.32
Price/Earnings-to-Growth Ratio (PEG)0.353.560.280.563.01
Price to Sales Ratio (P/S)0.541.351.170.951.050.800.951.291.31
Price to Book Ratio (P/B)4.102.972.712.442.401.932.042.362.48
Price to Free Cash Flow Ratio (P/FCF)26.383328.0023.0981.5750.62-130.71-9.89-212.4234.17
Enterprise Value to Sales (EV/Sales)2.102.001.882.181.882.142.312.24
Enterprise Value to EBITDA (EV/EBITDA)6.6814.4917.4718.7727.7626.3478.4132.9321.23
Debt to Equity Ratio1.901.762.042.522.762.772.742.031.99

CSTM Growth Runway Model

Standard long term linear growth fade

Multi-Stage Discounted Cash Flow Sandbox

Market Price$33.89
Intrinsic Value$52.95
Market Alignment
Undervalued by 56.2%relative to calculated intrinsic value
9.00%
Exp: 9%9%
i

Growth runway slowdown

This value provides a time window for the growth rate to decline beyond Stage 1 toward the terminal rate. Longer windows are most useful for companies with high growth starting conditions or strong competitive advantages. This option stretches out the growth rate slowdown across 5, 10, or 15-year steps. A high-growth starting condition (exceeding a 25% initial growth rate) automatically applies a curve decay to simulate realistic, rapid market saturation.
i

Terminal growth rate

With long-term inflation between 3-5%, revenue must grow by that baseline to maintain flat real-world market share. This value sets the permanent terminal growth rate to factor into the valuation beyond the growth slowdown runway toward maturity.

3-Stage Financial Runway Horizon

🧠 Perpetuity Horizon Engine (Stage 3: Post-2035)

Terminal FCF Base$0.61B
Perpetuity TV Value$11.43B
Discounted TV (PV)$4.83B
TV Weighting %62.3%
⚠️
Financial Model Disclaimer & Risk Disclosure: This interactive scenario simulator is an educational sandbox provided strictly for informational and analytical research purposes. Core historical financial statements and consensus estimates are sourced directly via Financial Modeling Prep (FMP). All downstream outputs are entirely deterministic, hypothetical projections generated by combining automated mathematical formulas (including linear interpolation and Gaussian bell-curve decay models) with user-selected variables and third-party financial data inputs. Users assume all liability for trading decisions executed based on these sandbox calculations.

📘 Full Research Report

ℹ️

AI-Generated Research: This report is for informational purposes only.

📘 CONSTELLIUM SE CLASS A (CSTM) — Investment Overview

🧩 Business Model Overview

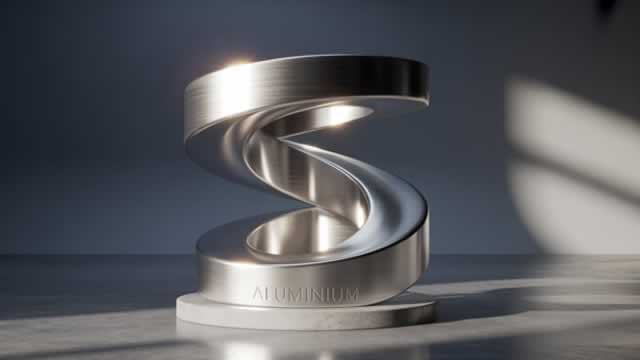
Constellium is a specialized aluminum producer that operates in the midstream portion of the value chain—transforming purchased (or otherwise sourced) primary aluminum into higher-value downstream products. The value proposition is expressed through (i) conversion of commodity metal into engineered formats and end-uses, and (ii) manufacturing reliability and qualification to meet customer specifications in applications such as beverage packaging and aerospace/industrial components.

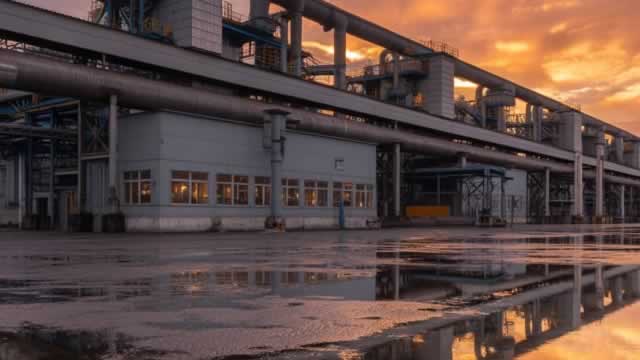
The business structure is centered on capacity located near key customer clusters and logistics nodes, enabling lower delivered costs versus purely commodity-based supply. Downstream manufacturing also allows product differentiation through thickness/finish control, alloying capability, and performance consistency—factors that reduce the ease of switching suppliers for qualified production lines.

💰 Revenue Streams & Monetisation Model

Revenue is generated primarily through contract and spot sales of aluminum sheet/foil and related rolled products, plus sales of value-added aluminum components (including aerospace-oriented products and other engineered applications). Monetisation is driven less by pure metal price and more by the “conversion premium” captured by efficient production, quality yield, and product mix.

  • Downstream product sales (transactional, but supported by customer qualification and order patterns): Typically priced off aluminum input costs with negotiated premiums tied to specification, volume, and service levels.
  • Longer-duration customer relationships: Beverage packaging supply arrangements and aerospace qualification cycles create durability in order intake even when end-demand fluctuates.
  • Margin drivers: Conversion spreads, manufacturing yield, energy and freight efficiency, and the ability to manage working capital and input cost volatility.

🧠 Competitive Advantages & Market Positioning

The moat is primarily rooted in customer qualification + manufacturing execution (a form of switching friction) and cost/placement advantages supported by asset locations and logistics. While the underlying aluminum input remains a commodity, the ability to produce spec-grade rolled products and components with stable quality and dependable delivery is harder to replicate than importing primary metal.

  • Switching friction (qualification and process integration): Beverage packaging and aerospace supply chains require consistent metallurgical properties, surface/finish specifications, and production reliability. After line trials and certification, switching suppliers becomes administratively costly and operationally risky for customers.
  • Cost advantage via location and logistics: Plant footprints positioned close to end-markets and distribution routes reduce delivered-cost volatility (freight and lead-time), improving resilience versus competitors with less favorable geographic exposure.
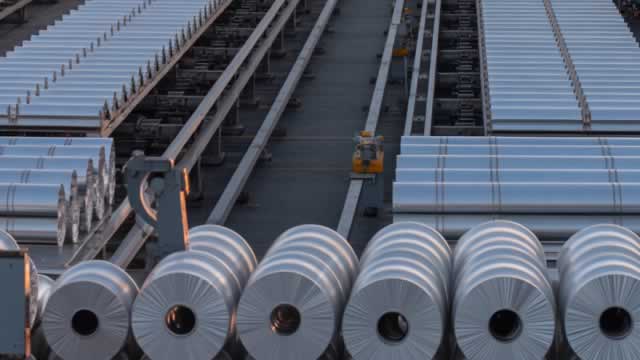
  • Scale and yield optimization: Downstream aluminum conversion economics depend on throughput, scrap rates, and energy efficiency. Higher utilization and stable operations support lower unit costs.

COMPETITIVE BENCHMARKING

  • Hydro (Norway-based, global aluminum rolled products): Strong positioning in rolled aluminum and can supply; often competes on integrated supply capabilities and geographic reach.
  • Novelis (global rolled aluminum leader): Focused on beverage packaging and engineered rolled products; competes on manufacturing footprint and customer qualification.
  • Alcoa (global integrated aluminum and downstream): More exposed to upstream/downstream integration depending on product line; competes through broad aluminum capabilities and scale.

Constellium’s positioning: Emphasis on specialized rolled/engineered aluminum where specification, delivery reliability, and conversion know-how matter. Compared with broader or more upstream-heavy peers, Constellium’s relative strength often reflects its ability to monetize downstream processing through proximity to demand and disciplined manufacturing execution rather than relying solely on primary metal ownership.

🚀 Multi-Year Growth Drivers

Over a 5–10 year horizon, growth potential is supported by structural demand for lightweight materials, recycling-led sustainability expectations, and continued penetration of aluminum in packaging and transportation. For Constellium, the key is capturing value in higher-margin converted formats where quality and supply reliability remain decisive.

  • Aluminum substitution: Ongoing replacement of heavier materials in packaging, transport, and industrial applications supports durable end-markets for sheet and engineered aluminum products.
  • Recycling and lower-carbon procurement: Recycling content and emissions-focused procurement policies support demand for aluminum formats where customers can demonstrate sustainability attributes.
  • Customer qualification cycles that extend stickiness: In beverage packaging and aerospace-related uses, supplier relationships and certification reduce the speed of market share changes, supporting steadier converted-product revenues.
  • TAM expansion in advanced packaging and engineered applications: Growth in flexible packaging formats and lightweight engineered components expands addressable volumes for high-spec aluminum products.

⚠ Risk Factors to Monitor

  • Commodity input volatility: Aluminum price movements can compress or expand conversion economics; margins depend on the ability to pass through costs via pricing mechanisms.
  • Energy cost and power-market dynamics: Even for midstream conversion, energy and process costs influence unit economics; cost disadvantage can emerge if energy inputs rise relative to competitors’ locations.
  • Demand cyclicality and customer destocking: Beverage packaging and aerospace/industrial end-markets can experience volume swings that impact capacity utilization.
  • Capacity additions and competitive overcapacity: New rolling/extrusion capacity can pressure premiums and spreads.
  • Capital intensity and execution risk: Downstream aluminum facilities require continued investment to maintain yield, quality, and cost competitiveness.
  • Regulatory and trade exposure: Tariffs, carbon-related policy changes, and trade compliance requirements can affect input sourcing, export economics, and customer procurement.

📊 Valuation & Market View

The market typically values aluminum converters using EV/EBITDA-type frameworks and/or normalized earnings measures because cash flow is sensitive to conversion premiums, utilization, and input-output price relationships. In practice, valuation tends to track:

  • Durability of conversion spreads (premium over input metal)
  • Cost position (energy efficiency, yield, freight/logistics execution)
  • Balance of contract vs. spot exposure and the pricing mechanism’s effectiveness
  • Cyclicality management (working capital discipline and capacity alignment)

Because aluminum markets are cyclical, investors typically look for resilience in downside economics (ability to preserve margins during weaker pricing) and a credible pathway to improved conversion profitability through product mix and operational discipline.

🔍 Investment Takeaway

Constellium’s investment case rests on a defensible position as a downstream aluminum converter: customer qualification and process integration create switching friction, while geographically advantaged manufacturing and logistics support cost competitiveness. The long-term opportunity is tied to structural aluminum substitution and recycling-linked procurement preferences, with returns dependent on maintaining conversion premiums and disciplined cost execution through industry cycles.


⚠ AI-generated — informational only. Validate using filings before investing.

📰 Market News & Coverage

15 Stories Available

Real-time institutional reporting and market updates for CSTM.

seekingalpha.com2026-06-04

Constellium: Buy Before The Q2 Beat

Constellium is up nearly 83% YTD, driven by strong aluminum pricing and robust end-market demand for engineered products. I initiate coverage with a Buy rating, expecting a material Q2 earnings beat fueled by shipment growth, improved pricing, and margin expansion. CSTM trades at a discounted 10.4x forward earnings and 6.8x EV/EBITDA, despite superior value-added positioning versus peers.

seekingalpha.com2026-06-03

Constellium: Quality Segments, Better Cash Flow, And Still Reasonable Upside

Constellium: Quality Segments, Better Cash Flow, And Still Reasonable Upside

zacks.com2026-06-03

Strong Performance Continues at CSTM's A&T Segment: What's Next?

Constellium's A&T segment posts 18% shipment growth and 30% higher revenues in Q1 2026, aided by aerospace demand, defense strength and aluminum prices.

zacks.com2026-06-02

Constellium Rises 92.9% in a Year: Should Investors Buy or Wait?

CSTM surges 92.9% in six months as packaging, aerospace growth, rising aluminum prices and buybacks fuel momentum despite cost pressures.

zacks.com2026-06-01

Is Constellium (CSTM) Stock Undervalued Right Now?

Here at Zacks, our focus is on the proven Zacks Rank system, which emphasizes earnings estimates and estimate revisions to find great stocks. Nevertheless, we are always paying attention to the latest value, growth, and momentum trends to underscore strong picks.

gurufocus.com2026-05-27

Constellium SE (CSTM) Shares Fall 3.7% -- GF Value Says Still Overvalued

On May 27, 2026, Constellium SE (CSTM) shares fell 3.7% to a current price of $33.96. This decline comes amid a strong year-to-date performance of 80.2% and a r

globenewswire.com2026-05-26

Voting Results from Constellium's 2026 Annual General Meeting

PARIS, May 26, 2026 (GLOBE NEWSWIRE) -- Constellium SE (NYSE: CSTM) announced the voting results for its Annual General Meeting of Shareholders held on May 21, 2026 (the “AGM”). The proposals for the appointment of Ingrid Joerg and the re-appointment of John Ormerod to the Company's Board of Directors for a period of three years following the Annual General Meeting passed. The complete voting results on all proposals have been published on the Company's website (https://www.constellium.com/investors/shareholder-meetings).

globenewswire.com2026-05-26

Voting Results from Constellium's 2026 Annual General Meeting

PARIS, May 26, 2026 (GLOBE NEWSWIRE) -- Constellium SE (NYSE: CSTM) announced the voting results for its Annual General Meeting of Shareholders held on May 21, 2026 (the "AGM"). The proposals for the appointment of Ingrid Joerg and the re-appointment of John Ormerod to the Company's Board of Directors for a period of three years following the Annual General Meeting passed.

zacks.com2026-05-25

Constellium (CSTM) is a Great Momentum Stock: Should You Buy?

Does Constellium (CSTM) have what it takes to be a top stock pick for momentum investors? Let's find out.

zacks.com2026-05-25

Are Industrial Products Stocks Lagging Constellium (CSTM) This Year?

Here is how Constellium (CSTM) and Generac Holdings (GNRC) have performed compared to their sector so far this year.

zacks.com2026-05-25

Fast-paced Momentum Stock Constellium (CSTM) Is Still Trading at a Bargain

Constellium (CSTM) could be a great choice for investors looking to buy stocks that have gained strong momentum recently but are still trading at reasonable prices. It is one of the several stocks that made it through our 'Fast-Paced Momentum at a Bargain' screen.

gurufocus.com2026-05-22

Is Constellium SE (CSTM) Overvalued After 3.8% Rally? GF Value Says Overvalued

On May 22, 2026, Constellium SE (CSTM) shares rose 3.8% to $33.24. This recent price movement continues to reflect a significant year-to-date gain of 76.3%, wit

gurufocus.com2026-05-13

A Look at Constellium SE (CSTM) After 3.8% Gain -- GF Value $19.70 vs Price $34.56

On May 13, 2026, Constellium SE (CSTM) shares rose 3.8% to a current price of $34.56. Over the past week, the stock has gained 3.7%, and in the last month, it h

zacks.com2026-05-07

What Makes Constellium (CSTM) a Strong Momentum Stock: Buy Now?

Does Constellium (CSTM) have what it takes to be a top stock pick for momentum investors? Let's find out.

zacks.com2026-05-07

All You Need to Know About Constellium (CSTM) Rating Upgrade to Strong Buy

Constellium (CSTM) has been upgraded to a Zacks Rank #1 (Strong Buy), reflecting growing optimism about the company's earnings prospects. This might drive the stock higher in the near term.

📊 AI Financial Analysis

Powered by StockMarketInfo
Earnings Data: Q Ending 2026-03-31

"CSTM reported Q1 2026 revenue of $2.46B and net income of $196.0M (EPS not meaningful in the provided dataset; net margin 7.96%). On a YoY basis, revenue rose to $2.46B from $1.98B in Q1 2025 (+24.3%), while net income increased from $37.0M to $196.0M (+430.9%). Sequentially (QoQ), revenue increased from $1.11B in Q4 2025 to $2.46B (+122.2%), and net income rose from $83.8M to $196.0M (+133.9%). Profitability improved over the last four quarters: net margin expanded from ~1.87% (Q1 2025) to 7.97% (Q1 2026), indicating strong operating leverage (despite quarter-to-quarter volatility in gross profit reporting). Cash flow quality strengthened in Q1 2026 with operating cash flow of $73.0M and free cash flow of ~$1.0M (after $72.0M capex). Leverage remains meaningful: total debt was $1.97B and net debt ~$1.83B, while equity improved to ~$1.15B (up from ~$0.95B in Q4 2025). There were no dividends in the period; shareholder returns are therefore driven by market performance and buybacks (Q1 shows no repurchases). Total shareholder returns are strongly positive given the very high 1-year price momentum (+246.8%)."

Revenue Growth

Good

YoY revenue growth in Q1 2026 was +24.3% ($2.46B vs $1.98B in Q1 2025). QoQ revenue jumped +122.2% vs Q4 2025 ($1.11B), though the sequential pattern indicates volatility rather than a steady run-rate.

Profitability

Good

Net income rose from $37.0M (Q1 2025) to $196.0M (Q1 2026), +430.9% YoY; QoQ net income increased +133.9%. Net margin expanded from 1.87% (Q1 2025) to 7.96% (Q1 2026), suggesting margin expansion over the 4-quarter window.

Cash Flow Quality

Fair

Operating cash flow was $73.0M in Q1 2026, but free cash flow was only ~$1.0M after $72.0M capex. While operating profitability improved, cash conversion appears less consistent quarter-to-quarter.

Leverage & Balance Sheet

Positive

Leverage remains elevated (total debt ~$1.97B; net debt ~$1.83B), but balance sheet resilience improved: equity increased to ~$1.15B vs ~$0.95B in Q4 2025 and total assets rose to ~$5.85B.

Shareholder Returns

Excellent

Dividend payouts were zero. Total shareholder return is dominated by strong price momentum (+246.8% 1Y). Buybacks are not reflected in Q1 2026, but the market’s valuation uplift indicates strong investor confidence.

Analyst Sentiment & Valuation

Neutral

Price is $29.58 vs consensus target $32 (implied upside ~8.1%). Despite upside potential, the very large 1Y run-up suggests valuation already reflects much of the optimism.

Disclaimer:This analysis is AI-generated for informational purposes only. Accuracy is not guaranteed and this does not constitute financial advice.

Fundamentals Overview

Loading fundamentals overview...

Constellium delivered a strongly beat quarter with adjusted EBITDA of $359M (+93% YoY), including a $97M noncash metal price lag benefit. Excluding that lag, adjusted EBITDA was $262M, up 78% YoY and an all-time record, driven by improved aerospace/TID volumes, standout PARP performance (+152% YoY), and favorable North America recycling/casting economics from elevated scrap spreads and metal pricing. The company raised 2026 guidance to adjusted EBITDA (ex-metal price lag) of $900M–$940M and free cash flow >$275M, citing continued benefit from North America automotive rolled product supply shortages, improved aerospace/TID environment, and favorable scrap/metal dynamics—while explicitly assuming no tailwind from today’s scrap spread environment for 2028 targets. Cash returned via buybacks ($28M in Q1; new $300M program through Dec 2028) and leverage improved to 2.2x with $904M liquidity. Key near-term risks center on recycling volatility, Middle East-driven cost inflation, and persistent Europe automotive weakness.

AI IconGrowth Catalysts

  • Aerospace: Aerospace shipments up 13% YoY; improved Aerospace pricing/mix tailwind and steady demand into record commercial aircraft backlogs
  • TID: TID shipments up 18% YoY driven by U.S. onshoring demand and North America dynamics from automotive rolled product supply disruption
  • PARP/Automotive: PARP adjusted EBITDA +152% YoY, benefiting from aluminum automotive body sheet supply shortages in North America and improved pricing/mix
  • Recycling economics: significantly higher North America scrap and metal pricing environment and improved scrap spreads boosting recycling/casting throughput profitability

Business Development

  • Multiyear contract with Airbus for extruded products from French operations, including proprietary Airware aluminum-lithium technology (aircraft application product flow and long-term relationship cited as ‘cementing’)

AI IconFinancial Highlights

  • Revenue: $2.5B, +24% YoY due to higher revenue per ton (including higher metal prices); pass-through model reduces direct metal price risk exposure
  • Adjusted EBITDA: $359M, +93% YoY; includes +$97M noncash metal price lag impact
  • Adjusted EBITDA ex-metal price lag: $262M, +78% YoY and all-time record; new quarterly record for PARP and new first-quarter record for A&T
  • Net income: $196M vs $38M prior year quarter
  • Free cash flow: $5M (lower vs stronger EBITDA due to working capital use and higher capex)
  • Share repurchases: $28M in the quarter for 1.2M shares; total since program start: 14.7M shares for $221M; Board approved new $300M program expiring Dec 2028
  • Safety: recordable case rate 1.16 per million hours vs 1.91 in 2025; target annual recordable case rate of 1.5 per million hours

AI IconCapital Funding

  • New $300M share repurchase authorization (replacing prior program) expiring December 2028; steady pace intent
  • Cash returned in Q1: $28M via repurchase of 1.2M shares
  • Balance sheet: net debt $1.8B stable vs end of 2025; leverage reduced to 2.2x (within target range)
  • Liquidity: $904M at end of Q1 (up $38M vs end of 2025)
  • Debt profile: no bond maturities until 2028
  • 2026 cash allocation intent: free cash flow used for share repurchases and gross debt reduction

AI IconStrategy & Ops

  • Return-seeking capex focus supports 2028 targets: capex guidance increased to ~$330M (from $315M previously)
  • Aerospace/recycling capacity build: third Airware casthouse in Issoire expected to start up by end of 2026
  • Recycling/casting ramp plan: Neuf-Brisach recycling center ramp fully in 2027; Muscle Shoals DC casting pit ramp in 2027; Airware casthouse starts end of 2026 (transition into 2028)
  • Metal cost management under volatile recycling economics: improving metal costs via increased scrap utilization, including more difficult scrap types and upcycling/sorting technologies
  • Tariff mitigation progress: actions to reduce direct tariff exposure; direct exposure described as manageable and consistent with prior expectations

AI IconMarket Outlook

  • 2026 guidance: adjusted EBITDA (excluding noncash metal price lag) $900M–$940M and free cash flow >$275M (raised from prior and assumes favorable conditions persist)
  • Cadence: management expects Q2 to be seasonally strongest quarter; second half subject to volatility and higher annual outage costs
  • 2028 targets: adjusted EBITDA ex-metal price lag of $300M free cash flow by 2028; guidance excludes current favorable scrap spread environment and excludes automotive rolled-product supply shortage benefits
  • Scrap/metal: Q2 assumed essentially ‘locked in’ for scrap needs; for 2H, >50% of needs locked in with remaining volume using a ‘middle of the road’ scrap spread scenario

AI IconRisks & Headwinds

  • Middle East conflict: potential inflationary pressures in freight, lubricants and coatings; management expects net impact digestible but longer-term end-market disruption uncertain
  • Volatile recycling economics: scrap spread and metal price volatility over last 18 months; management notes need for additional scrap supply for 2H in a highly dynamic market
  • Automotive weakness in Europe: premium vehicle segment exposure with increased Chinese competition, reduced BEV ambitions, and weakness continuing into 2026; management expects no automotive improvement in 2027 and ‘rather weak’ outlook
  • Tariff uncertainty: despite net positive indirect benefits (domestic U.S. demand/pricing and improved recycling), macro/geopolitical volatility could impact end-market demand in 2H
  • Freight/lubricants/coatings inflation risk acknowledged; however, direct primary aluminum cost exposure is limited due to pass-through model

Q&A: Analyst Interest

  • Cadence & 2H ’26/’27 bridge: Management reiterated seasonality—Q2 typically strongest (packaging volumes), while 2H carries higher costs from annual outages. For 2027, they framed it as a transition year: Neuf-Brisach recycling ramp completion, Muscle Shoals DC casting ramp, and Airware start-up, with automotive Europe expected weak and aerospace/packaging/TID providing partial offsets.
  • Scrap spread assumptions for guidance: Management said Q2 scrap needs are essentially locked in, and that UBC spread economics are more favorable in Q2 versus Q1. For 2H, >50% is locked; remaining volume uses a ‘middle of the road’ approach—above prior expectations but less aggressive than H1 ’26 and not as conservative as late ’24/’25.
  • Automotive impacts (PARP/AS&I) and tariffs: On Section 232 derivatives, they stated the latest changes don’t materially impact them (minor AS&I exposure), and confirm tariffs should stick, preserving indirect benefits. Regarding automotive outage benefits, PARP benefits expected to continue into the year; AS&I impact seen as financially minor with visibility limited on platform ramp-down/up effects.

Sentiment: POSITIVE

Note: This summary was synthesized by AI from the CSTM Q1 2026 earnings transcript. Financial data is complex; please verify all metrics against official SEC filings before making investment decisions.

📋 Official Regulatory 10-K / 10-Q SEC Filings

Direct authenticated documentation links to audited SEC database reports for CSTM.

SEC EDGAR Live Feed
Loading financial data and tables...
📁

SEC Filings (CSTM)

© 2026 Stock Market Info — Constellium SE (CSTM) Financial Profile