The Estée Lauder Companies Inc.

The Estée Lauder Companies Inc. (EL) Market Cap

The Estée Lauder Companies Inc. has a market capitalization of $30.20B.

Price: $83.49

0.59 (0.71%)

Market Cap: 30.20B

NYSE · time unavailable

CEO: Stephane de la Faverie

Sector: Consumer Defensive

Industry: Household & Personal Products

IPO Date: 1995-11-17

Website: https://www.elcompanies.com

The Estée Lauder Companies Inc. (EL) - Company Information

Market Cap: 30.20B|Sector: Consumer Defensive

Company Profile

The Estée Lauder Companies Inc. manufactures, markets, and sells skin care, makeup, fragrance, and hair care products worldwide. The company offers a range of skin care products, including moisturizers, serums, cleansers, toners, body care, exfoliators, acne care and oil correctors, facial masks, cleansing devices, and sun care products; and makeup products, such as lipsticks, lip glosses, mascaras, foundations, eyeshadows, nail polishes, and powders, as well as compacts, brushes, and other makeup tools. It also provides fragrance products in various forms comprising eau de parfum sprays and colognes, as well as lotions, powders, creams, candles, and soaps; and hair care products that include shampoos, conditioners, styling products, treatment, finishing sprays, and hair color products, as well as sells ancillary products and services. The company offers its products under Estée Lauder, Aramis, Clinique, Lab Series, Origins, M·A·C, Bobbi Brown, La Mer, Aveda, Jo Malone London, Bumble and bumble, Darphin, Smashbox, Le Labo, Editions de Parfums Frédéric Malle, GLAMGLOW, By Kilian, BECCA, Too Faced, Dr. Jart+, DECIEM, and The Ordinary brands. It also holds license arrangements for Tommy Hilfiger, Donna Karan New York, DKNY, Michael Kors, and Ermenegildo Zegna brands. The company sells its products through department stores, specialty-multi retailers, upscale perfumeries and pharmacies, and salons and spas; freestanding stores; its own and authorized retailer websites; third-party online malls; stores in airports; and in-flight and duty-free shops. The company was founded in 1946 and is headquartered in New York, New York.

Analyst Sentiment

77%
Strong Buy

From 25 Active Polls

1Y Forecast: $105.38

▲ +26.2% Potential Upside

Consensus Target Metrics

Low Bound

$75

Median

$106

High Bound

$140

Average

$105

Price & Moving Averages

Loading chart...

🎯 Wall Street Analyst Intelligence Report

1-Year structural target targets, chart projections, and sentiment maps.

Average 1Y Target
$105.38
▲ +26.22% Upside
Low Target
$75.00
-10% Risk
Median Target
$106.00
27% Mid
High Target
$140.00
68% Max
Consensus
Hold
20 / 46 Buys

Consensus Trend Projection

Trailing closures vs. 12-month metrics map.

Analyst Vote Distribution

Aggregate institutional coverage sentiment weights.

📊 Historical Valuation Multiples

Real-time Trailing Twelve Month (TTM) momentum side-by-side with discrete quarterly metrics.

Fiscal QuarterTTMQ1 2026Q4 2025Q3 2025Q2 2025Q1 2025Q4 2024Q3 2024Q2 2024
Period EndingTrailing 12MMar 31, 2026Dec 31, 2025Sep 30, 2025Jun 30, 2025Mar 31, 2025Dec 31, 2024Sep 30, 2024Jun 30, 2024
Market Cap ($M)30,19626,03137,91931,82929,14523,78026,99335,84937,874
Enterprise Value ($M)36,37032,20545,88239,03235,66330,53133,79043,50944,305
Price to Earnings Ratio (P/E)-122.1073.1258.52169.30-13.3437.39-11.44-57.45-33.34
Price/Earnings-to-Growth Ratio (PEG)2.6977.95-0.60
Price to Sales Ratio (P/S)2.047.018.959.148.556.706.7410.679.78
Price to Book Ratio (P/B)7.586.529.418.187.545.476.477.057.13
Price to Free Cash Flow Ratio (P/FCF)23.5083.9737.29-73.0073.97146.7929.18-44.2056.36
Enterprise Value to Sales (EV/Sales)8.6810.8311.2110.478.608.4412.9511.45
Enterprise Value to EBITDA (EV/EBITDA)22.5857.8258.6798.82-289.9457.39-95.72362.571926.29
Debt to Equity Ratio3.832.332.742.422.442.162.251.971.85

EL Growth Runway Model

Standard long term linear growth fade

Multi-Stage Discounted Cash Flow Sandbox

Market Price$83.49
Intrinsic Value$28.64
Market Alignment
Overvalued by 65.7%relative to calculated intrinsic value
9.00%
Exp: -4%-4%
i

Growth runway slowdown

This value provides a time window for the growth rate to decline beyond Stage 1 toward the terminal rate. Longer windows are most useful for companies with high growth starting conditions or strong competitive advantages. This option stretches out the growth rate slowdown across 5, 10, or 15-year steps. A high-growth starting condition (exceeding a 25% initial growth rate) automatically applies a curve decay to simulate realistic, rapid market saturation.
i

Terminal growth rate

With long-term inflation between 3-5%, revenue must grow by that baseline to maintain flat real-world market share. This value sets the permanent terminal growth rate to factor into the valuation beyond the growth slowdown runway toward maturity.

3-Stage Financial Runway Horizon

🧠 Perpetuity Horizon Engine (Stage 3: Post-2035)

Terminal FCF Base$0.85B
Perpetuity TV Value$16.06B
Discounted TV (PV)$6.78B
TV Weighting %54.9%
⚠️
Financial Model Disclaimer & Risk Disclosure: This interactive scenario simulator is an educational sandbox provided strictly for informational and analytical research purposes. Core historical financial statements and consensus estimates are sourced directly via Financial Modeling Prep (FMP). All downstream outputs are entirely deterministic, hypothetical projections generated by combining automated mathematical formulas (including linear interpolation and Gaussian bell-curve decay models) with user-selected variables and third-party financial data inputs. Users assume all liability for trading decisions executed based on these sandbox calculations.

📘 Full Research Report

ℹ️

AI-Generated Research: This report is for informational purposes only.

📘 ESTEE LAUDER INC CLASS A (EL) — Investment Overview

🧩 Business Model Overview

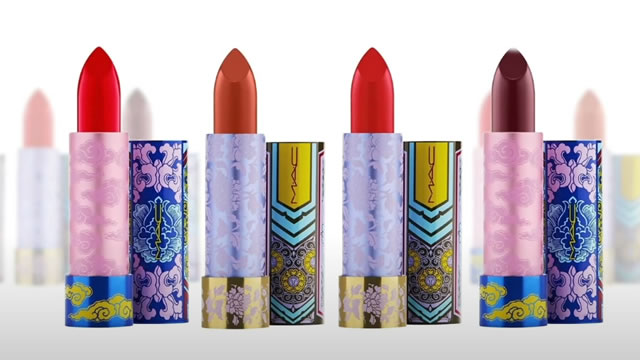
Estee Lauder designs, manufactures (partially in-house and via contract manufacturing), markets, and distributes prestige beauty products across skincare, makeup, fragrance, and haircare. The value chain centers on (1) product development and brand-led innovation, (2) brand-specific go-to-market through selective retail and department store partners, and (3) direct-to-consumer (DTC) channels that increase data capture, improve inventory control, and support higher-margin sales. Demand is driven by repeat purchase behavior within beauty routines, seasonal gifting cycles (notably fragrance), and retailer/region-specific merchandising.

Customer “stickiness” is supported by repeat usage patterns and regimen continuity: consumers tend to rebuy proven products and formulations, creating practical switching friction even when there is no contractual lock-in.

💰 Revenue Streams & Monetisation Model

Revenue is primarily transactional but exhibits repeat-purchase characteristics, with monetisation supported by both new product launches and ongoing replenishment of core franchises. Profitability is influenced by:

  • Mix and pricing within prestige: higher proportion of skincare and certain fragrances generally supports stronger margins than mass-market categories.
  • DTC contribution: DTC can sustain better economics through fuller capture of brand value, reduced retailer dependence, and improved promotions discipline.
  • Operating leverage: marketing effectiveness, SKU rationalization, and manufacturing/fulfillment efficiency can translate incremental sales into operating profit.
  • Promotional cadence and retailer inventory health: excessive promotional intensity or channel correction can pressure gross margin and working capital.

🧠 Competitive Advantages & Market Positioning

Estee Lauder’s moat is best characterized as a blend of Intangible Assets (brand-franchise equity), Scale/Distribution leverage (selective retail footprint plus DTC reach), and Private-label resistance (prestige positioning that is harder to replicate through generic offerings).

  • Intangible assets / premium franchise depth: Prestige portfolios build durable consumer associations with specific product categories (e.g., skincare regimen solutions, fragrance occasions). Competitors face difficulty matching the breadth of successful franchises and the track record of innovation pipelines.
  • Distribution leverage: Strong relationships with department stores and specialty beauty retailers create shelf presence and promotional support—important in a category where discovery and trial often occur at retail.
  • Switching friction (practical, not contractual): Consumers frequently rebuy within the same brand ecosystem due to perceived efficacy, routine compatibility, and habitual purchasing behavior.

Competitive benchmarking (industry peers):

  • L’Oréal (mass + prestige): broader global scale and a large portfolio spanning multiple price tiers; often competes on marketing reach and wide assortment breadth rather than single-franchise dominance.
  • Procter & Gamble (mass and select prestige): strengths in consumer packaged goods execution; tends to compete with scale-driven distribution and manufacturing efficiency more than prestige-specific franchise depth.
  • Coty (notably fragrance and select beauty): competes strongly in fragrance and celebrity-driven demand cycles; may pressure shelf space through aggressive campaign cadence, but typically has less diversified skincare franchise structure than EL.

Compared with these rivals, Estee Lauder maintains a comparatively concentrated emphasis on prestige beauty and franchise-led innovation, which supports premium positioning and reduces direct private-label substitution in many categories.

🚀 Multi-Year Growth Drivers

Over a 5–10 year horizon, growth is anchored in category expansion and share capture within premium segments:

  • Skincare penetration and premiumization: Consumers continue shifting toward skincare-led routines, supporting sustained demand for efficacy-focused formats and ingredient-driven narratives.
  • Fragrance as an occasion market: Gifting and personal-signature behavior support resilience relative to purely trend-driven categories, with portfolio refresh sustaining replacement demand.
  • DTC scaling and personalization: Online and owned-channel investment can improve customer lifetime value through targeted merchandising and improved inventory planning.
  • Geographic and channel expansion: Continued development of prestige distribution in emerging markets and travel retail can broaden the customer base beyond mature department store channels.
  • Innovation cadence within core franchises: Recurring demand is supported by disciplined product lifecycle management (new variants, limited editions, and reformulations).

⚠ Risk Factors to Monitor

  • Competitive intensity and promotional pressure: Prestige beauty remains crowded; brands can lose momentum if promotional activity rises faster than brand equity.
  • Channel inventory and sell-through volatility: Retail partner ordering patterns can create timing mismatches between production and demand.
  • FX and regional demand heterogeneity: Currency movements and differing consumer confidence levels can impact translation and localized growth rates.
  • Regulatory and ingredient compliance: Cosmetic regulations vary by geography and can constrain formulation timelines or increase compliance costs.
  • Product execution risk: New launch failures or slower-than-expected adoption can affect category growth and marketing ROI.

📊 Valuation & Market View

The market typically values prestige beauty companies using a mix of EV/EBITDA and P/S, with attention to the sustainability of gross margin, the durability of brand-driven pricing, and the quality of revenue growth (sell-through vs. inventory build). Key valuation drivers include:

  • Gross margin trajectory: influenced by mix (skincare/fragrance), product cost structure, and promotional intensity.
  • Operating leverage: the ability to convert incremental sales into operating profit through marketing efficiency and cost discipline.
  • DTC mix and replenishment health: DTC strength and stable inventory cycles reduce earnings volatility.
  • Quality of earnings: metrics related to channel inventory and cash conversion matter in consumer categories where timing can distort reported performance.

🔍 Investment Takeaway

Estee Lauder’s long-term investment case rests on prestige franchise intangibles, distribution and DTC leverage, and practical switching friction created by repeat-behavior beauty routines. The primary objective for an investor is to assess whether EL can sustain innovation-led franchise momentum and maintain disciplined promotion while converting premium mix into durable margins across economic cycles.


⚠ AI-generated — informational only. Validate using filings before investing.

📰 Market News & Coverage

15 Stories Available

Real-time institutional reporting and market updates for EL.

gurufocus.com2026-06-05

Did The Estee Lauder Companies, Inc. Insiders Breach their Fiduciary Duties to Shareholders?

Did The Estee Lauder Companies, Inc. Insiders Breach their Fiduciary Duties to Shareholders? PR Newswire NEW YOR

prnewswire.com2026-06-05

Did The Estee Lauder Companies, Inc. Insiders Breach their Fiduciary Duties to Shareholders?

Shareholders are encouraged to contact the firm to discuss their rights and options at no cost or obligation. We would handle any matter on a contingent fee basis, whereby you would not be responsible for out-of-pocket payment of our legal fees or expenses.

zacks.com2026-06-05

New Strong Buy Stocks for June 5th

PLOW, PGY, BMA, EL and SHBI have been added to the Zacks Rank #1 (Strong Buy) List on June 5, 2026.

zacks.com2026-06-04

SSDOY vs. EL: Which Stock Should Value Investors Buy Now?

Investors looking for stocks in the Cosmetics sector might want to consider either Shiseido Co. (SSDOY) or Estee Lauder (EL). But which of these two stocks presents investors with the better value opportunity right now?

zacks.com2026-06-03

Top Wide-Moat Stocks to Buy for Steady Long-Term Returns

EL, TER, LRCX and ASML use strong moats to fend off rivals and deliver consistent returns amid market shifts.

seekingalpha.com2026-06-02

The Estée Lauder Companies Inc. (EL) Presents at 23rd annual dbAccess Global Consumer Conference Transcript

The Estée Lauder Companies Inc. (EL) Presents at 23rd annual dbAccess Global Consumer Conference Transcript

reuters.com2026-06-02

Estee Lauder still open to acquisitions after failed Puig talks, CEO says

An Estee Lauder merger with Jean Paul Gaultier-owner Puig failed to go through because of the ​price tag, Stephane de La Faverie, President ‌and CEO of the U.S. cosmetics maker said on Tuesday, but added the company was still open to acquisitions ​if they made financial sense.

fool.com2026-06-01

Ulta Beauty vs. The Estée Lauder Companies: Which Consumer Stock Is a Better Buy in 2026?

Ulta Beauty and Estée Lauder take distinct paths in a changing beauty market, each with unique growth drivers, risk profiles, and financial health.

zacks.com2026-05-29

This Top Consumer Staples Stock is a #1 (Strong Buy): Why It Should Be on Your Radar

Finding strong, market-beating stocks with a positive earnings outlook becomes easier with the Zacks Rank.

zacks.com2026-05-29

Can EL's Beauty Reimagined Strategy Revive Long-Term Growth?

EL's Beauty Reimagined strategy is gaining traction with online growth, margin expansion and innovation, helping support its long-term recovery.

businesswire.com2026-05-26

The Estée Lauder Companies to Participate in the dbAccess Global Consumer Conference

NEW YORK--(BUSINESS WIRE)--Stéphane de La Faverie, President and Chief Executive Officer, and Roberto Canevari, Executive Vice President, Chief Value Chain Officer, of The Estée Lauder Companies Inc. (NYSE: EL) will participate in the dbAccess Global Consumer Conference 2026 in Paris on Tuesday, June 2, 2026, at 09:15 a.m. CEST. Interested parties can access the live webcast of the fireside chat on Tuesday, June 2nd from 09:15 a.m. – 09:55 a.m. CEST at http://www.elcompanies.com/investors. The.

feeds.benzinga.com2026-05-26

GE Vernova, Estée Lauder, A Health Care Stock And More On CNBC's 'Final Trades'

GE Vernova fell 0.5% to settle at $1,038.74 during the Friday session while AbbVie shares gained 0.6% to close at $215.70 on Friday.

zacks.com2026-05-25

Here's Why Estee Lauder (EL) is a Strong Momentum Stock

Wondering how to pick strong, market-beating stocks for your investment portfolio? Look no further than the Zacks Style Scores.

zacks.com2026-05-25

Estee Lauder (EL) Recently Broke Out Above the 20-Day Moving Average

Estee Lauder (EL) reached a significant support level, and could be a good pick for investors from a technical perspective. Recently, EL broke through the 20-day moving average, which suggests a short-term bullish trend.

nypost.com2026-05-22

How leaks, demands and a phone call derailed Estée Lauder's deal to create a $40B luxe giant

The merged company would have put together brands such as Tom Ford, Clinique and MAC with Carolina Herrera and Charlotte Tilbury, popular with TikTok influencers and affluent millennials.

📊 AI Financial Analysis

Powered by StockMarketInfo
Earnings Data: Q Ending 2026-03-31

"E.l.f. Beauty (EL) reported 2026-03-31 (Q3) revenue of $3.712B and net income of $89M, with EPS of $0.25. Revenue declined QoQ versus 2025-12-31 (Q2) from $4.238B to $3.712B (-12.4% QoQ), but rose YoY versus 2025-03-31 (Q3) from $3.550B to $3.712B (+4.6% YoY). Net income fell sharply QoQ from $162M to $89M (-45.1% QoQ) but was down YoY from $159M to $89M (-44.0% YoY). Profitability is mixed but overall margins compressed: net margin declined from 3.82% (Q2) to 2.40% (Q3) and from 4.48% (prior-year Q3) to 2.40% (-208 bps YoY). Gross margin remained broadly stable (76.55% Q2 vs 76.40% Q3; 74.96% YoY), suggesting cost structure and below-the-line items drove the profit decline. Cash generation remained positive: operating cash flow was $412M and free cash flow $310M. The company continued shareholder distributions—dividends paid were $126M and buybacks were $67M in the quarter—while keeping cash at $3.126B. Over the shareholder returns lens, price momentum is strong with a +44.7% 1-year change (capital appreciation). Dividend yield is modest (~0.48%) so total return is primarily price-driven. Analysts have a consensus target around ~$106.7 vs $76.2 current (~+40% upside)."

Revenue Growth

Neutral

Revenue was -12.4% QoQ but +4.6% YoY for the most recent quarter, indicating modest underlying growth with a near-term pullback.

Profitability

Caution

Net income fell -45.1% QoQ and -44.0% YoY; net margin compressed to 2.40% from 3.82% (QoQ) and 4.48% (YoY), while gross margin was broadly stable.

Cash Flow Quality

Positive

Positive operating cash flow ($412M) and free cash flow ($310M) support ongoing distributions (dividends $126M; buybacks $67M), though coverage/income is lower given weaker net income.

Leverage & Balance Sheet

Neutral

Assets were stable at ~$19.66B; equity was about $4.0B. Leverage remains elevated with net debt of ~$6.17B, but liquidity (cash $3.13B) is strong and current ratio ~1.27.

Shareholder Returns

Good

1-year price appreciation is strong (+44.7%), materially driving total return. Dividend yield is relatively low (~0.48%), but buybacks and dividends continue.

Analyst Sentiment & Valuation

Positive

Consensus target ($106.73) implies sizable upside (~+40% vs $76.2). Valuation multiples remain high (e.g., price/earnings provided), but sentiment appears constructive given momentum and targets.

Disclaimer:This analysis is AI-generated for informational purposes only. Accuracy is not guaranteed and this does not constitute financial advice.

Fundamentals Overview

Loading fundamentals overview...

Estée Lauder delivered a strong Q3 and meaningful margin recovery, validating the Beauty Reimagined/PRGP turnaround. Organic sales rose 2% YoY with broad fragrance strength and double-digit online momentum. Profitability improved sharply: gross margin expanded 140 bps to 76.4% and operating margin rose 360 bps to 15.0%, supported by PRGP efficiency programs (including zero-waste), excess/obsolescence reductions, and better sales leverage. EPS grew 40% to $0.91, though the quarter included Middle East-related dilution ($0.02) and tax rose to 31.8%. Management raised FY26 organic sales to ~3% (high end), operating margin to 10.7%–11.0%, and EPS to $2.35–$2.45, while flagging heavier Q4 Middle East disruption (~2pp sales growth; $0.06 EPS). FY27 preliminary guidance calls for 3%–5% net sales growth and 12.5%–13% operating margin, with margin runway tied to continued gross margin strength and SG&A discipline plus restructuring.

AI IconGrowth Catalysts

  • Double-digit fragrance organic growth led by luxury brands across Americas and Mainland China; also benefited from newness (e.g., Oud Voyager launch, Figue Érotique; KILIAN PARIS Her Majesty).
  • Le Labo sustained strong like-for-like door growth and double-digit organic sales growth, supported by Violette 30.
  • Skin care momentum in Mainland China supported by La Mer eye and Estée Lauder Supreme franchise launches; skincare breadth weaker vs prior-year Q3.
  • Makeup share gains in the U.S. and category stabilization; M·A·C momentum tied to Sephora entry (#1 lead brand across launched stores; rapid lip share gains).
  • One ELC operating ecosystem rollout and PRGP execution contributing to gross margin expansion and operating leverage.

Business Development

  • Accenture selected for enterprise business services; Shopify selected to modernize direct-to-consumer omnichannel experience.
  • WPP appointed for unified enterprise-led media buying approach.
  • M·A·C entry into U.S. Sephora (launched early March); M·A·C also expanded on Amazon Premium Beauty stores and global TikTok Shop.
  • Forest Essentials: company agreed in March to acquire remaining shares to expand from minority owner; closing expected H2 calendar 2026.
  • 111Skin: minority investment in April, positioned for pre- and post-procedure demand.

AI IconFinancial Highlights

  • Organic net sales +2% YoY in the quarter (fractured by geography/channel: North America down low single digits; double-digit online growth).
  • Gross margin 76.4%, up 140 bps YoY; drivers included PRGP operational efficiencies and zero-waste initiatives reducing excess/obsolescence; partially offset by incremental tariffs/inflation; also included +95 bps favorable in-period charge reversal from last year.
  • Operating margin expanded 360 bps to 15.0% (vs 11.4% last year); mix and shift in spending to Q4 drove better-than-expected results.
  • Nonconsumer-facing expenses reduced 4%; consumer-facing investment increased 9% (5% excluding FX).
  • Effective tax rate 31.8% vs 30.8% last year.
  • Diluted EPS $0.91 vs $0.65 prior year (+40%); includes $0.02 dilutive impact from Middle East disruption.
  • Restructuring: $1.1B cumulative charges through March 31; expects total restructuring and other charges $1.5B–$1.7B before taxes.

AI IconCapital Funding

  • CapEx investment of $306M for 9 months; CapEx down 23% vs prior year due to project phasing.
  • Net cash from operating activities $1.2B for 9 months vs $671M last year, despite restructuring payments.
  • No explicit buyback amount or ending debt/cash runway disclosed in the provided transcript.

AI IconStrategy & Ops

  • PRGP restructuring program milestone: initiatives approved through April 29 at high end of gross saving range; expanding positions largely tied to anticipated exit of select unproductive department store and freestanding doors, shifting toward online.
  • Restructuring approvals expected to complete by end of fiscal 2026; line of sight to additional growth via selling model optimization led to increasing target gross savings range (no numeric range provided in transcript).
  • Enterprise Business Services go-live completed across consumer care, CRM, and tech infrastructure; EBS fully deployed by end of calendar 2026.
  • Enterprise ecosystem modernization: consolidating vendors across brands/regions/functions to simplify governance and reduce long-tail spend.

AI IconMarket Outlook

  • Fiscal 2026 raised outlook: organic net sales ~3% (high end of prior range).
  • Fiscal 2026 operating margin expected 10.7%–11.0% (midpoint previously 10%).
  • Fiscal 2026 gross margin assumed ~75%.
  • Fiscal 2026 diluted EPS expected $2.35–$2.45 (YoY +56% to +62%); includes ~$0.07 dilutive impact from Middle East.
  • Fiscal 2026 weighted average share count assumed ~365M shares.
  • Middle East conflict outlook impact: for Q4, expect ~2 percentage points unfavorable impact to sales growth and $0.06 to EPS; full-year impact expected <1%.
  • Fiscal 2027 preliminary view (to be refined with full FY26 results in August): net sales growth 3%–5%; operating margin 12.5%–13.0%.

AI IconRisks & Headwinds

  • Geopolitical conflict in the Middle East: Q3 sales disruption already minimal (impact to EUKEM sales growth ~1 percentage point; consolidated impact not material), but Q4 expected heavier impact (~2pp to sales growth; $0.06 EPS).
  • North America pressure: sales down low single digits driven by brick-and-mortar softness including retailer bankruptcies and shop-in-shop closures.
  • Tariffs and inflation headwinds partially offset by PRGP net benefits (tariffs/inflation mentioned as pressure in gross margin bridge).
  • Skin care innovation breadth noted as weaker vs prior-year Q3 globally, implying category execution risk if innovation pipeline lags.

Q&A: Analyst Interest

  • Topic: Long-term margin path beyond fiscal 2027 and whether high-teens operating margins are achievable. Management framed Beauty Reimagined as a margin-recovery milestone, not sprint, citing ~+500 bps potential from ~8% start to ~11% in FY26 and 12.5%–13% in FY27; incremental leverage from growth and market-share gains.
  • Topic: Geographic and category drivers behind expected prestige acceleration and where EL expects biggest share improvement. Management emphasized resilient category lifecycle expansion (younger entry, longer retention), emerging market consumer growth, online accessibility, and specialty-multi growth; cited China as fifth quarter of share gains, balanced channel/brand execution, and U.S. stabilization with across-category share gains.
  • Topic: FY27 North America turn and inventory destocking expectations. Management answered affirmatively: stabilization to acceleration expected, attributing to rebalancing channels and consistent brand performance; cited proof points including Amazon expansion (12 EL brands) and very recent M·A·C Sephora launch showing rapid market-share gains and category momentum.

Sentiment: POSITIVE

Note: This summary was synthesized by AI from the EL Q3 2026 earnings transcript. Financial data is complex; please verify all metrics against official SEC filings before making investment decisions.

📋 Official Regulatory 10-K / 10-Q SEC Filings

Direct authenticated documentation links to audited SEC database reports for EL.

SEC EDGAR Live Feed
Loading financial data and tables...
📁

SEC Filings (EL)

© 2026 Stock Market Info — The Estée Lauder Companies Inc. (EL) Financial Profile