The Kroger Co.

The Kroger Co. (KR) Market Cap

The Kroger Co. has a market capitalization of .

No quote data available.

CEO: Gregory S. Foran

Sector: Consumer Defensive

Industry: Grocery Stores

IPO Date: 1977-01-02

Website: https://www.thekrogerco.com

The Kroger Co. (KR) - Company Information

Market Cap: -|Sector: Consumer Defensive

Company Profile

The Kroger Co. operates as a retailer in the United States. The company operates combination food and drug stores, multi-department stores, marketplace stores, and price impact warehouses. Its combination food and drug stores offer natural food and organic sections, pharmacies, general merchandise, pet centers, fresh seafood, and organic produce; and multi-department stores provide apparel, home fashion and furnishings, outdoor living, electronics, automotive products, and toys. The company's marketplace stores offer full-service grocery, pharmacy, health and beauty care, and perishable goods, as well as general merchandise, including apparel, home goods, and toys; and price impact warehouse stores provide grocery, and health and beauty care items, as well as meat, dairy, baked goods, and fresh produce items. It also manufactures and processes food products for sale in its supermarkets and online; and sells fuel through 1,613 fuel centers. As of January 29, 2022, the company operated 2,726 supermarkets under various banner names in 35 states and the District of Columbia. The Kroger Co. was founded in 1883 and is based in Cincinnati, Ohio.

Analyst Sentiment

65%
Buy

From 24 Active Polls

1Y Forecast: $74.86

▲ +0.0% Potential Upside

Consensus Target Metrics

Low Bound

$68

Median

$75

High Bound

$83

Average

$75

Price & Moving Averages

Loading chart...

🎯 Wall Street Analyst Intelligence Report

1-Year structural target targets, chart projections, and sentiment maps.

Average 1Y Target
$74.86
▲ +17.76% Upside
Low Target
$68.00
7% Risk
Median Target
$75.00
18% Mid
High Target
$83.00
31% Max

Consensus Trend Projection

Trailing closures vs. 12-month metrics map.

Analyst Vote Distribution

Aggregate institutional coverage sentiment weights.

Sentiment volume allocation data unavailable.

Historical valuation matrix unavailable.

📘 Full Research Report

ℹ️

AI-Generated Research: This report is for informational purposes only.

📘 KROGER (KR) — Investment Overview

🧩 Business Model Overview

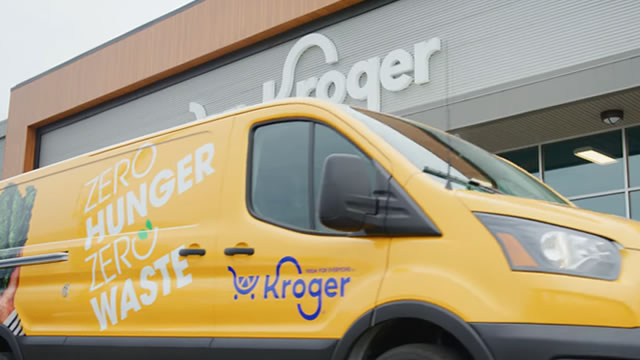
Kroger operates a large-scale grocery value chain that converts purchasing power and logistics into everyday household demand. The company sources products across grocery, produce, dairy, and related categories, then distributes them through owned/contracted logistics networks to retail stores and customer fulfillment channels. Customer visits and loyalty program engagement drive repeat purchasing, while pharmacy and other services broaden trip frequency and basket depth. The operating model emphasizes scale-driven procurement, controlled shrink and spoilage, and efficient store labor deployment—supported by omnichannel fulfillment (store-based picking and delivery) and digital tools that reduce friction in repeat buying.

💰 Revenue Streams & Monetisation Model

Kroger’s monetisation is primarily transactional, but supported by recurring behavior through loyalty and services:

  • Grocery and consumables: Core volume-driven revenue with gross margin management through mix, promotions discipline, and cost of goods optimization.
  • Perishables (produce, meat, dairy): Margin is structurally impacted by shrink, waste, and procurement discipline; operational excellence can materially shift profitability.
  • Pharmacy: A higher-value, service-oriented revenue stream that also supports store traffic. Profitability depends on reimbursement dynamics and formulary/channel mix.
  • Fuel: A traffic-and-margin lever (often low margin but high attach), with earnings sensitivity to fuel cost spreads.
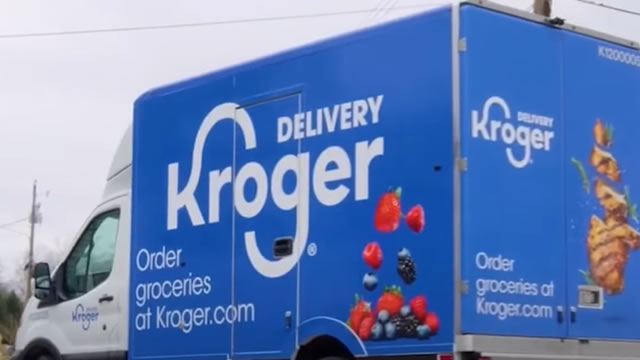
  • Digital and omnichannel: Monetizes existing demand through delivery/pick services; margins depend on fulfillment productivity and density.
  • Third-party/advertising and other services (where applicable): Incremental monetisation tied to consumer engagement and partner spend.

Margin drivers tend to cluster around (1) procurement and logistics cost per unit, (2) store-level productivity (labor and shrink), and (3) mix toward private label and services such as pharmacy.

🧠 Competitive Advantages & Market Positioning

Kroger competes in a highly price- and cost-sensitive retail category. The durable edge comes from scale economics and assortment control that are difficult to replicate quickly.

Moat thesis: Scale/distribution leverage plus private label resistance (and reinforcement from loyalty-enabled merchandising).

  • Scale/Distribution leverage: Dense store networks and a logistics footprint create lower cost per case and improved inbound purchasing terms. Competitors can match retail pricing, but matching unit economics at scale is structurally harder.
  • Private label resistance: Private label programs give Kroger a cost and margin management lever and help protect market share during promotional cycles. Customers accustomed to private label quality and value are less likely to fully switch competitors solely due to price changes.
  • Loyalty-enabled merchandising: Frequent shopper behavior supports better demand forecasting, promo targeting, and assortment optimization—reducing markdowns and waste.

Competitive benchmarking (primary competitors):

  • Walmart: Competes on national scale and aggressive everyday pricing, often with strong logistics efficiency. Kroger’s differentiation is tighter local grocery expertise, private label breadth in categories, and pharmacy/service depth.
  • Target: Emphasizes general merchandise and promotional retailing more than grocery density. Kroger’s advantage is grocery frequency and perishables operations—areas where category specialization and shrink control are crucial.
  • Albertsons (and broader regional grocers): Competes in similar demographics and categories. Kroger’s scale in procurement and logistics tends to support better cost leverage and promotional flexibility.

🚀 Multi-Year Growth Drivers

Growth over a 5–10 year horizon is less about new product cycles and more about sustained share gains and margin capture from structural trends:

  • Omnichannel penetration: Continued customer shift toward pickup and delivery expands TAM for store-based fulfillment. The opportunity is to improve pick productivity, manage substitution quality, and raise order frequency among loyalty members.
  • Private label and value assortment: Consumer demand for value provides a path for resilient volumes while supporting gross margin via mix and procurement efficiencies.
  • Healthcare services expansion: Pharmacy and adjacent services can increase trip frequency and stabilize earnings relative to pure grocery exposure, subject to reimbursement and regulatory dynamics.
  • Supply chain modernization: Investments that reduce labor intensity per order, improve forecasting, and tighten inventory control can convert fixed cost into variable performance benefits.
  • Store productivity and footprint optimization: Remodeling, labor scheduling optimization, and format adjustments can improve productivity without requiring significant greenfield buildout.

⚠ Risk Factors to Monitor

  • Margin pressure from competition: Grocery retail is structurally promotion- and price-competitive. Sustained price competition can compress gross margin and operating leverage.
  • Labor and occupancy costs: Wage inflation and productivity shortfalls can weaken store-level profitability.
  • Food price volatility and mix shifts: Commodity cost swings affect gross margin, particularly where pass-through is incomplete or shrink/waste rises.
  • Regulatory and reimbursement changes: Pharmacy reimbursement and healthcare-related policy changes can impact service profitability; antitrust scrutiny can influence deal/operating outcomes in the grocery sector.
  • Execution risk in omnichannel: Delivery economics and inventory accuracy can deteriorate if fulfillment density, staffing, or systems underperform.
  • Capital intensity and financing conditions: Maintaining logistics, store refresh cycles, and technology capabilities requires ongoing investment; adverse credit/interest-rate environments can affect flexibility.

📊 Valuation & Market View

Equity markets typically frame large grocery retailers through earnings quality and free cash flow durability rather than high-growth expectations. Common valuation lenses include EV/EBITDA, P/E, and P/FCF, with P/S used less often for major value/scale retailers due to the importance of margin and cash conversion.

Key drivers that tend to move valuation include:

  • Sustainable operating margin (procurement and shrink discipline, labor productivity, and mix toward private label/services).
  • Cash conversion (inventory management and working capital efficiency).
  • Omnichannel profitability trajectory (order growth balanced against fulfillment labor and logistics costs).
  • Balance sheet and cash needs (maintenance capex, debt maturity profile, and pension/other obligations).

🔍 Investment Takeaway

Kroger’s long-term investment case rests on durable economics from scale-driven distribution advantages and private label/value positioning that help defend share and margins in a highly competitive grocery landscape. The pathway to multi-year value creation is to convert loyalty and omnichannel engagement into repeat purchasing while maintaining cost discipline across perishables, labor, and fulfillment operations. The primary debate centers on the sustainability of margins under competitive pressure and the execution of omnichannel efficiency—rather than on a simple volume growth narrative.


⚠ AI-generated — informational only. Validate using filings before investing.

📊 AI Financial Analysis

Powered by StockMarketInfo
Earnings Data: Q Ending 2026-01-31

"KR reported Revenue of $34.73B in the latest quarter (2026-01-31), up +2.6% QoQ from $33.86B (2025-11-08) and up about +1.2% YoY versus $34.31B (closest prior year period: 2025-02-01). Net income swung to $0.86B from a loss of -$1.32B QoQ, while also improving +35.8% YoY versus $0.63B. Profitability appears to be stabilizing/improving: the net margin moved from negative in the prior quarter to ~2.5% in the latest quarter, and expanded versus the prior-year period (~1.9%). On the balance sheet, Total Assets declined to $49.94B (down ~2.9% QoQ), and Total Equity fell to $5.94B (down ~15.7% QoQ). Net debt remains elevated at ~$21.35B, though (consistent with a banking-style focus) equity durability is the key watch item. Shareholder returns look mixed: the stock price is roughly flat over 1 year (-1.19%), with a modest dividend yield of ~0.57%. Share count declined from 655M to 629M (~4%), suggesting buyback support. Overall, earnings momentum improved materially QoQ, but total return momentum is limited by a lack of strong share-price appreciation."

Revenue Growth

Neutral

Revenue rose +2.6% QoQ (from $33.86B to $34.73B) and was up ~+1.2% YoY versus the closest prior-year quarter provided ($34.31B). Growth is positive but not accelerating.

Profitability

Good

Net income improved sharply QoQ (loss of -$1.32B to +$0.86B) and increased ~+35.8% YoY. Net margin normalized to ~2.5% in the latest quarter, versus ~1.9% in the prior-year period—an improving trend.

Cash Flow Quality

Neutral

No operating/cash-flow line items were provided, so cash conversion cannot be validated. Dividend payout ratio is positive (~0.26 latest), indicating coverage looks reasonable despite volatility in earnings.

Leverage & Balance Sheet

Neutral

Total Assets decreased ~2.9% QoQ, while Total Equity declined ~15.7% QoQ (to $5.94B). Net debt remains ~21B+, so resilience depends on earnings stability and equity rebuilding.

Shareholder Returns

Neutral

Total shareholder return is restrained: 1Y price change is -1.19% (no >20% momentum). Dividend yield is low (~0.57%), but share count fell ~4% QoQ, indicating buyback support.

Analyst Sentiment & Valuation

Positive

Latest P/E is ~11.5 and the consensus price target ($74.75) is above the current price ($68.19), implying a moderate upside bias. Valuation does not appear stretched based on provided multiples.

Disclaimer:This analysis is AI-generated for informational purposes only. Accuracy is not guaranteed and this does not constitute financial advice.

Fundamentals Overview

Loading fundamentals overview...

Kroger delivered a solid Q4 and FY 2025 with improving units, stronger grocery mix, positive year-end share gains, and double-digit Q4 EPS growth. E-commerce rose 20% and scaled to $16B as profitability trends improved, while cost discipline supported margin stability despite stepped-up price investments. Management is simplifying the portfolio, expanding into new markets, and elevating AI and loyalty initiatives, with e-commerce profitability targeted in 2026. Guidance for 2026 is modest given IRA headwinds, lower inflation, and pharmacy mix pressure, but the company’s balance sheet, free cash flow, and share repurchase capacity underpin confidence.

Growth

  • Q4 identical sales ex-fuel +2.4% (≈40 bps IRA headwind); 2-year stack +4.8%
  • FY identical sales ex-fuel +2.9%; adjusted EPS +9% to $4.85
  • Q4 adjusted EPS $1.28, +12% YoY
  • E-commerce sales +20% in Q4; scaled to ~$16B business
  • Positive market share gains in the final period of the year (best since 2021)
  • Strength in Fresh; improving food units; grocery a larger mix of sales
  • Pharmacy growth supported by core scripts and GLP-1s (lower contribution vs Q3)

Business Development

  • Announced sale of Vitacost (non-core asset)
  • Plan to close nearly 50 underperforming Little Clinic locations
  • Partnerships with DoorDash and Uber Eats exceeding plan; alongside Instacart, convenience offerings targeted to >$1.5B sales in 2026
  • Introduced 1,100+ new Our Brands items in 2025 (health-focused innovation; Simple Truth and Private Selection lead)
  • Appointed Greg Foran as CEO; leadership promotions across divisions
  • Elevated Milen Mahadevan to lead company-wide AI initiatives

Financials

  • Q4 identical sales ex-fuel +2.4% (IRA ~40 bps headwind); FY +2.9%
  • Q4 adjusted FIFO operating profit ~$1.2B
  • Q4 adjusted EPS $1.28 (+12% YoY); FY adjusted EPS $4.85 (+9%)
  • Q4 FIFO gross margin rate ex-RDA/fuel flat YoY; FY rate +14 bps ex-fuel/adjustments despite price investments
  • Q4 OG&A rate ex-fuel/adjustments +21 bps YoY (cycling real estate gains; labor investments), partly offset by lower incentives/productivity
  • Q4 LIFO charge $11M (vs. $30M LY); FY LIFO $157M (vs. $95M LY), ~$0.07 EPS headwind; 2026 LIFO expected similar
  • Fuel profitability ahead of LY despite lower gallon volumes
  • Adjusted free cash flow ~$3.9B for FY, above expectations
  • Food inflation moderated ~90 bps vs Q3; egg deflation a significant headwind; beef inflation a partial offset

Capital & Funding

  • Completed $7.5B share repurchase authorization in FY (incl. $5B ASR)
  • Board approved additional $2B repurchase authorization in Dec; expected completion by end of fiscal 2026
  • Net debt to adjusted EBITDA below long-term target range; expect to migrate back toward target over time
  • Focus on ROIC improvement; remodels delivering better-than-expected returns

Operations & Strategy

  • Continued price investments and expanded promotions; improved customer value perception
  • Added store hours in high-traffic departments; faster checkout and better customer satisfaction
  • Cost savings from sourcing, supply chain, shrink reduction, and modernized ways of working; reinvested in price and service
  • Hybrid e-commerce fulfillment model implemented; e-commerce profitability targeted in 2026
  • Simplification: closed underperforming stores; reduced corporate headcount; ongoing non-core asset review
  • Accelerating new store program: 29 major projects in 2025; plan to increase openings by ~30% in 2026 and enter Jacksonville and Kansas City
  • AI prioritized to enhance pricing, shrink, fulfillment, and associate tools; exploring agentic shopping
  • Enhancing loyalty in 2026 with updated rewards and a revamped Kroger credit card

Market & Outlook

  • Customers remain value-focused; Kroger continuing to invest in price
  • 2026 guidance: identical sales ex-fuel +1% to +2%; excluding ~130 bps IRA headwind, +2.3% to +3.3%
  • Q1 2026 expected near low end due to ongoing egg deflation; improvement expected as this eases
  • Overall inflation expected lower than 2025
  • Pharmacy sales growth to moderate to low-to-mid single digits (IRA reimbursement impact; faster brand-to-generic mix), partly offset by GLP-1 adoption and script growth
  • E-commerce growth to accelerate with delivery strength and expanded third-party store-based fulfillment
  • Gradual recovery of ESI households; not expected to fully return

Risks Or Headwinds

  • Inflation Reduction Act: ~40 bps Q4 headwind and ~130 bps FY 2026 headwind to identical sales (no gross profit dollar impact)
  • Egg deflation near term; overall lower inflation could temper reported sales growth
  • Pharmacy margin pressure from brand-to-generic shift and reimbursement dynamics
  • Competitive pricing environment as company invests in lower prices
  • Fuel gallon declines
  • Partial, gradual recovery of ESI-related pharmacy volumes

Sentiment: MIXED

Note: This summary was synthesized by AI from the KR Q4 2025 earnings transcript. Financial data is complex; please verify all metrics against official SEC filings before making investment decisions.

Loading financial data and tables...
© 2026 Stock Market Info — The Kroger Co. (KR) Financial Profile