Energy Recovery, Inc.

Energy Recovery, Inc. (ERII) Market Cap

Energy Recovery, Inc. has a market capitalization of $412.9M.

Price: $8.01

-0.28 (-3.38%)

Market Cap: 412.88M

NASDAQ · time unavailable

CEO: David W. Moon

Sector: Industrials

Industry: Industrial - Pollution & Treatment Controls

IPO Date: 2008-07-02

Website: https://www.energyrecovery.com

Energy Recovery, Inc. (ERII) - Company Information

Market Cap: 412.88M|Sector: Industrials

Company Profile

Energy Recovery, Inc., together with its subsidiaries, designs, manufactures, and sells various solutions for the seawater reverse osmosis desalination and industrial wastewater treatment industries worldwide. The company operates through Water and Emerging Technologies segments. It offers a suite of products, including energy recovery devices, and high-pressure feed and recirculation pumps; hydraulic turbochargers and boosters; and spare parts, as well as repair, field, and commissioning services. The company also offers a solution to reduce energy consumption in natural gas processing and in refrigeration systems that use carbon dioxide. It provides its products under the ERI, Ultra PX, PX, Pressure Exchanger, PX Pressure Exchanger, PX PowerTrain, VorTeq, IsoBoost, AT, and AquaBold names to large engineering, procurement, and construction firms; end-users and industry consultants; original equipment manufacturers; and aftermarket customers. The company was incorporated in 1992 and is headquartered in San Leandro, California.

Analyst Sentiment

68%
Buy

From 4 Active Polls

1Y Forecast: $12.50

▲ +56.1% Potential Upside

Consensus Target Metrics

Low Bound

$12

Median

$13

High Bound

$13

Average

$13

Price & Moving Averages

Loading chart...

🎯 Wall Street Analyst Intelligence Report

1-Year structural target targets, chart projections, and sentiment maps.

Average 1Y Target
$12.50
▲ +56.05% Upside
Low Target
$12.00
50% Risk
Median Target
$12.50
56% Mid
High Target
$13.00
62% Max
Consensus
Buy
11 / 16 Buys

Consensus Trend Projection

Trailing closures vs. 12-month metrics map.

Analyst Vote Distribution

Aggregate institutional coverage sentiment weights.

📊 Historical Valuation Multiples

Real-time Trailing Twelve Month (TTM) momentum side-by-side with discrete quarterly metrics.

Fiscal QuarterTTMQ1 2026Q4 2025Q3 2025Q2 2025Q1 2025Q4 2024Q3 2024Q2 2024
Period EndingTrailing 12MMar 31, 2026Dec 31, 2025Sep 30, 2025Jun 30, 2025Mar 31, 2025Dec 31, 2024Sep 30, 2024Jun 30, 2024
Market Cap ($M)4135307148206938728321,004729
Enterprise Value ($M)372489675783647834814953701
Price to Earnings Ratio (P/E)20.48-10.826.6352.9084.40-22.078.8729.61-283.70
Price/Earnings-to-Growth Ratio (PEG)0.063.760.340.120.71-2.27
Price to Sales Ratio (P/S)3.0354.6310.7225.6224.72108.1712.4126.0326.79
Price to Book Ratio (P/B)2.292.883.464.533.744.403.964.293.33
Price to Free Cash Flow Ratio (P/FCF)15.1926.22111.27-236.04172.8883.1994.05-316.6492.55
Enterprise Value to Sales (EV/Sales)50.3810.1424.4623.06103.4512.1424.7025.76
Enterprise Value to EBITDA (EV/EBITDA)9.59-54.0316.95154.28223.85-78.7427.56111.94-1244.33
Debt to Equity Ratio-1.070.050.050.060.060.060.050.050.06

ERII Growth Runway Model

Standard long term linear growth fade

Multi-Stage Discounted Cash Flow Sandbox

Market Price$8.01
Intrinsic Value$8.00
Market Alignment
Overvalued by 0.1%relative to calculated intrinsic value
9.00%
Exp: -4%-4%
i

Growth runway slowdown

This value provides a time window for the growth rate to decline beyond Stage 1 toward the terminal rate. Longer windows are most useful for companies with high growth starting conditions or strong competitive advantages. This option stretches out the growth rate slowdown across 5, 10, or 15-year steps. A high-growth starting condition (exceeding a 25% initial growth rate) automatically applies a curve decay to simulate realistic, rapid market saturation.
i

Terminal growth rate

With long-term inflation between 3-5%, revenue must grow by that baseline to maintain flat real-world market share. This value sets the permanent terminal growth rate to factor into the valuation beyond the growth slowdown runway toward maturity.

3-Stage Financial Runway Horizon

🧠 Perpetuity Horizon Engine (Stage 3: Post-2035)

Terminal FCF Base$0.02B
Perpetuity TV Value$0.46B
Discounted TV (PV)$0.19B
TV Weighting %54.8%
⚠️
Financial Model Disclaimer & Risk Disclosure: This interactive scenario simulator is an educational sandbox provided strictly for informational and analytical research purposes. Core historical financial statements and consensus estimates are sourced directly via Financial Modeling Prep (FMP). All downstream outputs are entirely deterministic, hypothetical projections generated by combining automated mathematical formulas (including linear interpolation and Gaussian bell-curve decay models) with user-selected variables and third-party financial data inputs. Users assume all liability for trading decisions executed based on these sandbox calculations.

📘 Full Research Report

ℹ️

AI-Generated Research: This report is for informational purposes only.

📘 ENERGY RECOVERY INC (ERII) — Investment Overview

🧩 Business Model Overview

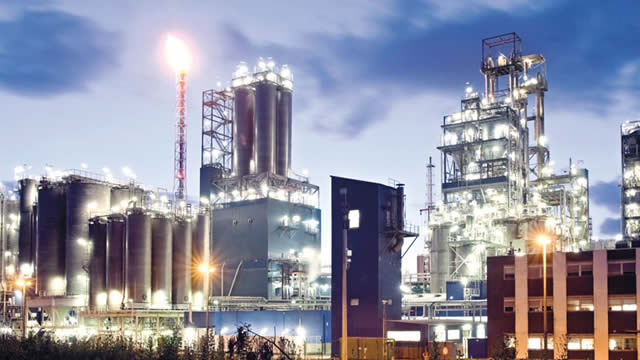
ENERGY RECOVERY INC designs and manufactures hydraulic energy-recovery equipment that captures pressure energy that would otherwise be lost in high-pressure fluid systems. The core value proposition is to convert wasted pressure (and the associated power draw) into useful energy or to reduce the effective energy required to move fluids.

The value chain typically follows: (1) technical engagement and system design with customers and EPCs, (2) delivery of energy-recovery devices/systems for installation in process trains, and (3) long-term aftermarket support through spare parts, maintenance, and performance-related services. Customer stickiness tends to come from integration into the project design, site-specific operating envelopes, and the installed base that benefits from ongoing service.

💰 Revenue Streams & Monetisation Model

ERII monetizes through a combination of product and service revenues:

  • Equipment / project revenue: device and system sales tied to water and industrial infrastructure builds and retrofits. Margin profile is influenced by product mix, installation complexity, and engineering content.
  • Aftermarket / services: spare parts, refurbishment, and service agreements that support lifecycle performance. This stream tends to be more recurring than project-only demand.

The primary margin drivers are (1) technology performance that reduces customers’ energy costs (supporting acceptance and repeat orders), (2) installed-base expansion that supports aftermarket pull-through, and (3) the share of revenue attributable to higher-margin service and replacement activity relative to one-off project sales.

🧠 Competitive Advantages & Market Positioning

ERII’s moat is best characterized as a mix of Switching Costs (installed-base lock-in) and Intangible Assets (proprietary technology and know-how) rather than pure scale alone.

  • Switching costs / integration burden: energy-recovery devices must fit the customer’s operating conditions, system layout, control philosophy, and performance targets. Replacement or displacement requires re-engineering, new procurement, and performance validation—raising friction versus an “apples-to-apples” component swap.
  • Installed-base leverage: once deployed, the installed base creates recurring service demand and supports incremental retrofits/upgrades where performance optimization is valued.
  • Technology and application expertise: designing for efficiency, reliability, and maintainability across diverse fluid and pressure regimes is a learned capability. Proprietary know-how and engineering depth reduce customer perceived risk versus alternatives.
  • Intangible assets via defensibility: patent and trade-secret protection, plus accumulated operating knowledge, make it difficult for general industrial equipment suppliers to replicate equivalent performance and lifecycle economics quickly.

Competitive benchmarking:

  • Danfoss: strong in industrial fluid components (e.g., valves/controls and broader system components). In many projects, Danfoss solutions compete indirectly by offering components or control approaches rather than a purpose-built energy-recovery architecture.
  • Flowserve: a major supplier of pumps and process equipment, which can address pressure management and system efficiency. Competition typically arises at the system level, where customers may consider alternative pump/valve configurations instead of specialized energy-recovery hardware.
  • Grundfos: a large pump player that competes through pump efficiency and system integration. ERII’s positioning is more specialized around recovering pressure energy that would otherwise be throttled or wasted.

Compared with these broader industrial suppliers, ERII maintains a focused industry and technology specialization in energy-recovery solutions, which can shorten the path to a credible design and lifecycle value proposition for water and industrial process applications.

🚀 Multi-Year Growth Drivers

Over a five- to ten-year horizon, ERII’s addressable opportunity is supported by structural demand for energy efficiency and water infrastructure expansion:

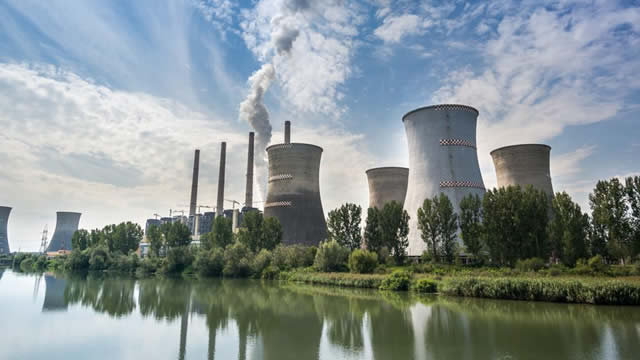
  • Desalination and water reuse growth: more desalination capacity and tighter water stress in multiple regions increase the need to reduce the energy intensity of membrane-based and high-pressure treatment systems.
  • Decarbonization and energy-cost discipline: energy recovery aligns with institutional requirements to lower operating costs and reduce energy consumption—benefiting projects where power and lifecycle economics matter.
  • Industrial pressure reduction applications: many industrial processes feature high-pressure supply streams where throttling or inefficient pressure management leads to avoidable energy loss. ERII targets segments where pressure-energy capture can materially improve economics.
  • Retrofit potential: existing facilities can seek upgrades to improve efficiency, especially where energy costs are structurally high or where operational performance targets tighten.

⚠ Risk Factors to Monitor

  • Project execution and performance risk: energy-recovery equipment must meet efficiency and reliability requirements under site-specific operating conditions. Performance shortfalls can delay acceptance, shift warranty exposure, or reduce repeat demand.
  • Capital cycle sensitivity: equipment-heavy revenue is exposed to infrastructure and industrial spending cycles, which can affect ordering patterns and timing.
  • Competitive substitution: large industrial suppliers may offer alternative system designs (pumps/valves/control strategies) that reduce the urgency to adopt specialized energy-recovery hardware.
  • Regulatory and permitting constraints: water infrastructure projects can face delays from permitting, environmental reviews, and local procurement requirements.
  • Manufacturing and supply chain constraints: specialized components can create margin and delivery volatility if supply availability or quality issues arise.

📊 Valuation & Market View

Equity valuation for ERII typically reflects expectations for a specialized industrial technology business with both project revenue and a growing aftermarket component. Market participants often anchor on:

  • EV/EBITDA and cash-flow durability characteristics of an industrial equipment and services model.
  • P/S or growth-adjusted multiples when investors emphasize backlog conversion, installed-base expansion, and service mix improvement.
  • Key sensitivities: gross margin trajectory, service/recurring revenue contribution, backlog quality/visibility, and working capital dynamics tied to project milestones.

Drivers that typically move the valuation narrative include demonstrated efficiency and reliability outcomes, expansion of installed base across end markets, and evidence that service revenue grows as deployments mature.

🔍 Investment Takeaway

ERII offers a differentiated, technology-led approach to capturing wasted pressure energy in high-pressure fluid systems. The enduring investment case rests on switching costs from integration and installed-base adoption, supported by defensible engineering know-how and a service-oriented pathway to repeat demand. Growth is linked to structural trends in water infrastructure expansion and energy-efficiency mandates, while key risks center on execution/performance and the cyclicality of capital-intensive customer spending.


⚠ AI-generated — informational only. Validate using filings before investing.

📰 Market News & Coverage

15 Stories Available

Real-time institutional reporting and market updates for ERII.

businesswire.com2026-05-28

Energy Recovery Announces Appointment of Alex Buehler as Interim President and Chief Executive Officer

SAN LEANDRO, Calif.--(BUSINESS WIRE)--Energy Recovery (Nasdaq: ERII), a global leader in energy-efficient technology enabling affordable, reliable water and reduced emissions, today announced that current Board of Directors member Alex Buehler has been named Interim President and CEO, effective immediately, until the permanent position has been filled. For personal reasons, President and CEO David Moon has decided to accelerate the timing of his previously announced retirement. The Board thanks.

businesswire.com2026-05-08

Energy Recovery to Participate in Upcoming Investor Conference

SAN LEANDRO, Calif.--(BUSINESS WIRE)--Energy Recovery, Inc. (Nasdaq: ERII), a global leader in energy-efficient technology enabling affordable, reliable water and reduced emissions, today announced its participation at the B. Riley Securities 26th Annual Investor Conference. Mr. Aidan Ryan, interim Chief Financial Officer, will participate in investor meetings on Thursday, May 21. About Energy Recovery Energy Recovery (Nasdaq: ERII) designs and manufactures world-class energy-saving technology.

seekingalpha.com2026-05-07

Energy Recovery, Inc. (ERII) Q1 2026 Earnings Call Transcript

Energy Recovery, Inc. (ERII) Q1 2026 Earnings Call Transcript

zacks.com2026-05-06

Energy Recovery (ERII) Reports Q1 Loss, Tops Revenue Estimates

Energy Recovery (ERII) came out with a quarterly loss of $0.11 per share versus the Zacks Consensus Estimate of a loss of $0.1. This compares to a loss of $0.13 per share a year ago.

businesswire.com2026-05-06

Energy Recovery Reports its First Quarter 2026 Financial Results and Organizational Updates

SAN LEANDRO, Calif.--(BUSINESS WIRE)--Energy Recovery, Inc. (Nasdaq:ERII) (“Energy Recovery”, “Company”, “we”, and “our”) today announced its financial results for the first quarter ended March 31, 2026. Management has released a letter to shareholders reviewing business and financial updates from the first quarter and discussing our outlook for 2026. This letter is located under “News and Events” in the “Investors” section on the Energy Recovery website (https://ir.energyrecovery.com/news-even.

zacks.com2026-05-05

4 Pollution Control Stocks to Watch on Robust Industry Trends

The Zacks Pollution Control industry has been benefiting from healthy demand for products, driven by global initiatives to tackle greenhouse gas emissions. DCI, CECO, ERII and FTEK are some notable stocks in the industry.

globenewswire.com2026-05-05

SHARC Energy Selected by National Laboratory of the Rockies for Advanced Wastewater Energy Recovery Project

VANCOUVER, British Columbia, May 05, 2026 (GLOBE NEWSWIRE) -- SHARC International Systems Inc. (CSE: SHRC) (FSE: IWIA) (OTCQB: INTWF) ("SHARC Energy" or the “Company”), a global leader in Wastewater Energy Transfer (“WET”) technology, is pleased to announce that it has received a purchase order from the National Laboratory of the Rockies (NLR), a federally funded research laboratory operated by Alliance for Energy Innovation, LLC. The purchase order supports the deployment of SHARC Energy's PIRANHA wastewater heat recovery system as part of a high-profile U.S. Department of War (DoW)-supported program at the Naval Postgraduate School's historic Hotel Del Monte in Monterey, California.

businesswire.com2026-04-17

Energy Recovery to Release First Quarter 2026 Financial Results

SAN LEANDRO, Calif.--(BUSINESS WIRE)--Energy Recovery, Inc. (NASDAQ: ERII or the Company) announced today it will release its financial results for the quarter ending March 31, 2026. The Company will host a conference call to discuss the results and related matters on May 6, 2026, after market close. EARNINGS RELEASE Wednesday, May 6, 2026 (after market close) LIVE CONFERENCE CALL Wednesday, May 6, 2026, 2 p.m. PT / 5 p.m. ET Listen-only, US / Canada Toll-Free: +1 (877) 709-8150 Listen-only, Lo.

defenseworld.net2026-04-16

Energy Recovery (NASDAQ:ERII) Shares Gap Down Following Analyst Downgrade

Shares of Energy Recovery, Inc. (NASDAQ: ERII - Get Free Report) gapped down before the market opened on Wednesday after Northcoast Research downgraded the stock from a buy rating to a neutral rating. The stock had previously closed at $11.29, but opened at $10.48. Energy Recovery shares last traded at $10.7280, with a volume of 184,437

youtube.com2026-04-08

FAST TURNAROUND: Former energy sec predicts SHOCKINGLY swift energy recovery

Former Energy Secretary Rick Perry joins ‘Varney & Co.' to weigh in on falling oil prices after President Donald Trump's Iran ceasefire, the path to $60 crude, and how U.S. strength is reshaping global energy markets and weakening Iran. 0:00 Oil Prices Crash: The Trump-Iran Cease-Fire 0:36 The Path to $60 Oil: Rick Perry's Prediction 1:05 American Ingenuity & Global Power Operations 1:53 Why Critics Can't Celebrate Foreign Policy Wins 2:46 Repairing Gulf Energy Infrastructure & Defanging Iran 3:53 Working with Allies: The Future of Energy Flow

defenseworld.net2026-04-08

Energy Recovery, Inc. $ERII Shares Sold by JPMorgan Chase & Co.

JPMorgan Chase and Co. trimmed its stake in shares of Energy Recovery, Inc. (NASDAQ: ERII) by 40.5% during the undefined quarter, according to the company in its most recent Form 13F filing with the Securities and Exchange Commission. The firm owned 119,450 shares of the industrial products company's stock after selling 81,155 shares

defenseworld.net2026-04-03

Analysts Set Energy Recovery, Inc. (NASDAQ:ERII) Target Price at $15.00

Shares of Energy Recovery, Inc. (NASDAQ: ERII - Get Free Report) have received an average rating of "Moderate Buy" from the five ratings firms that are currently covering the firm, Marketbeat reports. Two research analysts have rated the stock with a hold recommendation, two have issued a buy recommendation and one has given a strong buy

zacks.com2026-03-24

Energy Recovery (ERII) Soars 7.0%: Is Further Upside Left in the Stock?

Energy Recovery (ERII) saw its shares surge in the last session with trading volume being higher than average. The latest trend in earnings estimate revisions could translate into further price increase in the near term.

defenseworld.net2026-03-22

Energy Recovery (NASDAQ:ERII) Reaches New 12-Month Low – Time to Sell?

Energy Recovery, Inc. (NASDAQ: ERII - Get Free Report)'s stock price reached a new 52-week low during trading on Friday. The stock traded as low as $9.59 and last traded at $9.6810, with a volume of 61354 shares. The stock had previously closed at $9.73. Analyst Upgrades and Downgrades ERII has been the subject of

defenseworld.net2026-03-14

Alpha Wave Global LP Trims Stake in Energy Recovery, Inc. $ERII

Alpha Wave Global LP reduced its stake in Energy Recovery, Inc. (NASDAQ: ERII) by 26.1% during the undefined quarter, according to the company in its most recent filing with the Securities and Exchange Commission. The firm owned 527,871 shares of the industrial products company's stock after selling 186,450 shares during the period. Energy

📊 AI Financial Analysis

Powered by StockMarketInfo
Earnings Data: Q Ending 2026-03-31

"ERII reported 2026-03-31 (Q1) revenue of $0.20M and net income of -$12.25M (EPS -; input shows $0, consistent with non-meaningful diluted share data). Versus the prior quarter (2025-12-31), revenue declined sharply from $66.59M to $0.20M (QoQ ~-99.7%), and net income deteriorated from +$26.91M to -$12.25M. Versus the same quarter last year (2025-03-31), revenue rose from $8.07M to $0.20M (YoY ~-97.5%), while profitability weakened further: net income swung from -$9.88M to -$12.25M (YoY deterioration ~-24%). Profitability margins contracted dramatically. Q1 gross profit was -$1.49M with a gross margin of about -7.5%, and operating income was -$6.54M (operating margin about -33.0%); this contrasts with strong profitability in 2025-12-31 (net margin ~40%). Cash flow quality remained relatively resilient on the cash basis: operating cash flow was +$21.0M and free cash flow +$20.2M despite net losses, helped by working-capital movements and non-cash items. Balance sheet resilience is strong with cash & short-term investments of ~$86.2M and equity of ~$184.3M; leverage is low with net debt of -$41.3M (net cash position). Shareholder returns appear weak: stock price is $10.58 and 1-year change is -28.85% (no provided dividend/buyback yield evidence). Overall, sentiment seems challenged, and valuation support is unclear given the profitability volatility."

Revenue Growth

Neutral

Revenue fell from $66.59M (2025-12-31) to $0.20M (2026-03-31), a QoQ decline of ~-99.7%. YoY, revenue dropped from $8.07M (2025-03-31) to $0.20M, about -97.5%, indicating extreme volatility and a weak near-term demand/recognition profile.

Profitability

Neutral

Margins swung sharply lower: gross margin ~-7.5% in 2026-03-31 vs ~67.3% in 2025-12-31. Net income was -$12.25M vs +$26.91M QoQ, and net income was worse YoY (-$12.25M vs -$9.88M). Operating loss was ~-33% margin vs ~48% operating margin in the prior quarter.

Cash Flow Quality

Neutral

Despite net loss, operating cash flow was +$21.0M and free cash flow +$20.2M in 2026-03-31. This partially offsets earnings weakness, but cash generation appears driven by working-capital/non-cash items and may not be sustainable if revenue normalizes poorly.

Leverage & Balance Sheet

Good

Balance sheet strength remains notable: equity of ~$184.3M (vs ~$206.2M in 2025-12-31) and a net cash position (net debt ~- $41.3M). Cash & short-term investments total ~$86.2M, supporting resilience during earnings volatility.

Shareholder Returns

Neutral

Total shareholder returns look negative based on price performance: 1y_change is -28.85%. Dividend yield is shown as 0 and no clear buyback/dividend contributions are evidenced in the provided quarter data (2026-03-31 shows repurchases, but no yield/total-return breakdown).

Analyst Sentiment & Valuation

Neutral

Price targets are $13 (high/low/consensus all $13) vs current price $10.58, implying modest upside (~+23%). However, the quarter’s extreme earnings deterioration and revenue collapse reduce confidence in forward fundamentals.

Disclaimer:This analysis is AI-generated for informational purposes only. Accuracy is not guaranteed and this does not constitute financial advice.

Fundamentals Overview

Loading fundamentals overview...

ERII’s Q1 2026 call focused less on quantified results and more on operational momentum versus macro uncertainty. The main upside catalyst is the PX Q650, launched in March, already generating a first commercial order and design activity with multiple large desalination customers. Management framed the Q650 transition as a multi-year shift, with Q400 still central near-term and Q650 expected to become primary around 2028, based on a historical Q300→Q400 ramp. The dominant risk is the war in Iran: management withdrew 2026 guidance, citing meaningful Middle East exposure and reduced visibility. In Q&A, leadership argued delays are likely schedule slips into 2027 rather than long-term demand impairment, supported by enduring water scarcity fundamentals. To manage uncertainty, they emphasized inventory building and reliance on Q400-spec projects that are already far into design. Wastewater and desal guidance remains paused pending a potential Q2/Q3 update.

AI IconGrowth Catalysts

  • PX Q650 launched in March; first commercial order received; working with multiple large customers to design into large desalination plants
  • Q650 transition expected to take years, with management targeting becoming primary product around 2028

Business Development

  • Multiple large desalination customers collaborating on Q650 design-in for large desalination plants (named only as 'multiple large customers')

AI IconFinancial Highlights

  • Management withdrew 2026 financial guidance due to meaningful Middle East exposure from the war in Iran; company stated original 2026 guidance is no longer reliable
  • Wastewater revenue outlook previously communicated as $10 million to $15 million for 2026 is paused; company will not provide specific desalination/wastewater guidance until overall guidance is updated in Q2 or Q3
  • No EPS or revenue vs. expectations figures were provided in the transcript
  • No quantified bps/margin changes disclosed in the transcript

AI IconCapital Funding

    AI IconStrategy & Ops

    • Inventory build strategy to be ready to serve customers despite uncertainty in Middle East project timing
    • Production planning rationale: known projects over next 12–24 months are Q400-spec and far along in design, making product change unlikely
    • Manufacturing footprint expansion remains on track: target by Q1 to start manufacturing Q400s and overseas Q400 assembly
    • Cost discipline emphasis: lean/Kaizen to reduce domestic manufacturing costs; prior major reduction in force (last year) and additional reduction at start of this year; no large remaining one-time SG&A opportunities

    AI IconMarket Outlook

    • Guidance update timing: company hopes to update overall guidance in Q2 or Q3
    • Management expectation that Middle East project delays primarily move from 2026 into 2027 (fundamentals still supported by water scarcity/water security)
    • Primary product transition path: Q300/Q400 took 2+ years to reach Q400 dominance; management expects the Q650 transition to take even with early momentum, likely becoming primary around 2028

    AI IconRisks & Headwinds

    • War in Iran and broader Middle East conflict: potential project delays (management expects mainly 2026 into 2027) and uncertainty in regional investor confidence
    • Energy prices higher due to the conflict; management stated no broad global desal project delays identified yet, but small wastewater delays occurred due to material input costs
    • Potential second-order demand/region confidence deflation risk acknowledged by analyst; management response was limited to 'not hearing anything that would tell us otherwise at this point'

    Q&A: Analyst Interest

    • Middle East risk profile and delay type: Management said industry conversations indicate delays are likely schedule pushes from 2026 into 2027, not fundamental demand breaks, citing durable desalination drivers (water scarcity and water security). Management also said they are not hearing contrary information externally yet.
    • Inventory and spec planning amid uncertainty: Management explained they are building inventory because 12–24 month projects are Q400-spec and far along in design, making product changes unlikely. They added a historical transition reference (Q300→Q400 took 2+ years) and projected Q650 primary around 2028.
    • Global project delay checks under higher energy costs: Analyst asked whether energy-cost spikes cause delays outside the Middle East. Management replied 'no' to this point for desal globally, though they observed some small wastewater delays tied to material input costs. They flagged impact depends on war persistence.

    Sentiment: CAUTIOUS

    Note: This summary was synthesized by AI from the ERII Q1 2026 earnings transcript. Financial data is complex; please verify all metrics against official SEC filings before making investment decisions.

    📋 Official Regulatory 10-K / 10-Q SEC Filings

    Direct authenticated documentation links to audited SEC database reports for ERII.

    SEC EDGAR Live Feed
    Loading financial data and tables...
    📁

    SEC Filings (ERII)

    © 2026 Stock Market Info — Energy Recovery, Inc. (ERII) Financial Profile