L.B. Foster Company

L.B. Foster Company (FSTR) Market Cap

L.B. Foster Company has a market capitalization of $312.7M.

Financials based on reported quarter end 2025-12-31

Price: $29.90

-0.04 (-0.13%)

Market Cap: 312.71M

NASDAQ · time unavailable

CEO: John F. Kasel

Sector: Industrials

Industry: Railroads

IPO Date: 1981-06-09

Website: https://www.lbfoster.com

L.B. Foster Company (FSTR) - Company Information

Market Cap: 312.71M · Sector: Industrials

L.B. Foster Company provides engineered and manufactured products and services for the building and infrastructure projects worldwide. The company's Rail, Technologies, and Services segment offers new rail to passenger and short line freight railroads, industrial companies, and rail contractors; used rails; rail accessories, including track spikes and anchors, bolts, angle bars, tie plates, and other products; power rail, direct fixation fasteners, coverboards, and special accessories; and trackwork products, as well as engineers and manufactures insulated rail joints and related accessories. This segment also provides friction management products and application systems, railroad condition monitoring systems and equipment, wheel impact load detection systems, wayside data collection and management systems, track fasteners, and engineered concrete railroad ties; and aftermarket services. Its Precast Concrete Products segment offers a range of specialty precast concrete products, such as sound walls, burial vaults, bridge beams, box culverts, septic tanks, and other custom pre-stressed products for use in transportation and general infrastructure markets. This segment also manufactures precast concrete buildings for use as restrooms, concession stands, and protective storage buildings in national, state, and municipal parks. The company's Steel Products and Measurement segment provides bridge decking, bridge railing, structural steel fabrications, expansion joints, bridge forms, and other products for highway construction and repair. This segment also produces threaded pipe products for industrial water well, irrigation, and oil and gas markets, as well as offers pipe coatings for oil and gas pipelines and utilities, and precision measurement systems for the oil and gas market. The company markets its products directly, as well as through a network of agents. L.B. Foster Company was founded in 1902 and is headquartered in Pittsburgh, Pennsylvania.

Analyst Sentiment

60%
Buy

Based on 7 ratings

Analyst 1Y Forecast: $0.00

Average target (based on 1 sources)

Consensus Price Target

Low

$21

Median

$21

High

$21

Average

$21

Downside: -29.8%

Price & Moving Averages

Loading chart...

📘 Full Research Report

ℹ️

AI-Generated Research: This report is for informational purposes only.

📘 LB FOSTER (FSTR) — Investment Overview

🧩 Business Model Overview
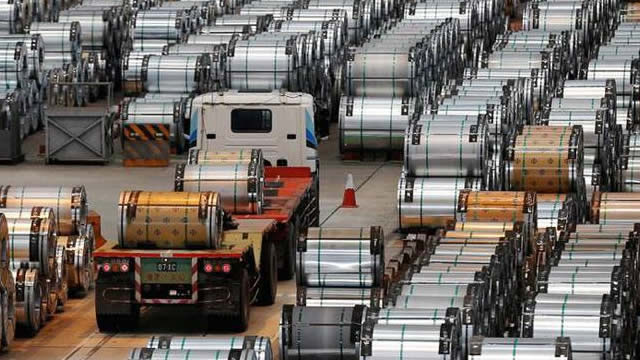
LB Foster manufactures and supplies engineered products used in rail and bridge infrastructure. The value chain typically runs from specification and design support through manufacturing and then installation/turnover in customer projects. For rail, products are designed to fit within existing track and bridge systems where reliability, tolerances, and compliance with railroad standards matter. For bridge-related applications, products are specified for long-life performance in structures that require predictable load transfer and durability.

Customer stickiness is supported by (1) qualification and approval processes at the railroad or prime-contractor level, (2) the need for engineered fit and performance in safety- and reliability-critical environments, and (3) the practical difficulty of changing approved suppliers once components are established across corridors or asset classes.

💰 Revenue Streams & Monetisation Model

Revenue is driven primarily by engineered product sales tied to infrastructure projects and maintenance/renewal cycles. Monetisation generally follows a “specification to supply” model: when LB Foster’s products are selected into design packages or maintenance programs, revenue converts into manufacturing throughput and project deliveries. Follow-on demand can emerge through ongoing infrastructure upkeep, replacement schedules, and expanded deployment where performance proves out.

Margin drivers typically include: (1) product mix toward higher-complexity, engineered components; (2) operating leverage across manufacturing capacity; (3) the extent to which material and logistics costs can be passed through or managed through sourcing discipline; and (4) execution quality that reduces rework and warranty-like costs. While revenue is not purely subscription-like, the aftermarket/renewal characteristics of infrastructure systems can make cash flows less “one-off” than commodity-heavy manufacturing.

🧠 Competitive Advantages & Market Positioning

Primary moat: Switching costs and specification/qualification advantage.

  • Switching costs: Railroads and infrastructure owners rely on vetted suppliers due to safety, performance verification, and design compatibility. Once approved, suppliers tend to remain embedded in procurement ecosystems for subsequent work.
  • Hard-to-replicate engineering and application knowledge: Engineered rail and bridge components require product design, manufacturing control, and knowledge of installation constraints. Competitors face difficulty replicating both the technical outcome and the qualification pathway.
  • Intangible assets: Long-standing relationships with rail customers, contractor networks, and established standards familiarity support repeat specification.

Network effects: Not a classic consumer network effect. However, in infrastructure procurement, “network effects” can appear indirectly through standardization—once a product category becomes part of preferred standards on a corridor or fleet, procurement patterns reinforce selection.

🚀 Multi-Year Growth Drivers

  • Infrastructure renewal and maintenance: Aging rail and bridge assets require continued replacement, refurbishment, and upgrades—creating a multi-year demand floor for engineered components.
  • Capacity expansion in freight and transit: Increased rail utilization and system upgrades support demand for track and structure components tied to uptime and reliability.
  • Safety and reliability requirements: Components that improve durability, reduce maintenance frequency, or meet evolving performance criteria can gain share when specifications tighten.
  • Geographic and program-based TAM expansion: Infrastructure spending cycles across regions and government/owner programs can expand addressable project volumes for engineered suppliers that can qualify and deliver.

Over a 5–10 year horizon, the most durable growth tends to come from the maintenance/renewal portion of the market and from supplier selection where performance and qualification reduce operational risk for owners.

⚠ Risk Factors to Monitor

  • Project and capex cyclicality: Revenue exposure to infrastructure budgets means demand can vary with approval timing and spending priorities, especially in discretionary upgrade categories.
  • Execution risk: Engineered products are sensitive to manufacturing quality, lead times, and field installation conditions. Cost overruns or delivery constraints can pressure margins.
  • Material and input cost inflation: Exposure to steel and related inputs can affect profitability if price pass-through mechanisms lag input costs.
  • Customer concentration and procurement dynamics: Railroad and contractor purchasing patterns can shift based on internal standardization, multi-year contracting decisions, or supplier performance evaluations.
  • Regulatory/specification changes: Evolving standards for safety, environmental impact, or durability may advantage incumbents but can also require ongoing engineering and compliance investment.

📊 Valuation & Market View

Market pricing for industrial infrastructure suppliers typically centers on earnings power and cash conversion rather than growth-only narratives. The market often pays for a durable mix of (1) margin stability, (2) backlog visibility or project pipeline quality, and (3) evidence of operating leverage through cycles.

Common valuation frameworks in the sector include EV/EBITDA and EV/earnings multiples adjusted for cyclicality, as well as price-to-sales where margins and conversion are expected to improve with scale and product mix. Key valuation drivers are sustained gross margin, disciplined working capital management, and the ability to protect pricing versus input cost inflation.

🔍 Investment Takeaway

LB Foster presents a defensible long-term thesis grounded in specification-driven switching costs and engineered product qualification that embed the company into rail and bridge infrastructure ecosystems. The investment case strengthens when evaluating the company as an operator with potential operating leverage tied to infrastructure renewal demand, while monitoring cyclicality, input costs, and execution quality that directly influence margin resilience.


⚠ AI-generated — informational only. Validate using filings before investing.

Fundamentals Overview

Loading fundamentals overview...

📊 AI Financial Analysis

Powered by StockMarketInfo
Earnings Data: Q Ending 2025-12-31

"FSTR reported revenue of $160.37M with a net income of $2.42M, yielding an EPS of $0.24. The company has total assets of $330.37M and total liabilities of $155.10M, resulting in total equity of $176.00M. The balance sheet indicates a net debt of $62.67M. Operating cash flow is strong at $22.17M, leading to a free cash flow of $14.35M. While FSTR has a history of dividends, the last payout was in 2016 and no dividends have been issued recently. The current stock price is $28.05, showing a notable 1-year price appreciation of 33.32%, reflecting a robust performance despite the absence of recent dividend payments. Overall, FSTR appears to be managing its growth and profitability effectively, with a solid balance sheet and positive cash flow generation."

Revenue Growth

Positive

Revenue of $160.37M demonstrates significant growth.

Profitability

Neutral

Net income of $2.42M reflects positive profitability but still relatively modest.

Cash Flow Quality

Good

Strong operating and free cash flows indicate good cash flow quality.

Leverage & Balance Sheet

Positive

Solid balance sheet with manageable debt levels.

Shareholder Returns

Good

Strong stock price increase indicates high total returns despite no recent dividends.

Analyst Sentiment & Valuation

Neutral

Current valuation appears reasonable with upside potential based on price targets.

Disclaimer:This analysis is AI-generated for informational purposes only. Accuracy is not guaranteed and this does not constitute financial advice.

Management delivered very strong Q4 execution—net sales $160.4M (+25.1%), adjusted EBITDA $13.7M (+89%), and operating cash flow $22.2M—while still taking margin hits from UK Rail (gross margin -260 bps; Rail margin -440 bps). The operational hard stuff is candid: UK restructuring charges ($2.2M in Q4; $1.5M–$2.0M run-rate savings in 2026) plus start-up/restructuring costs across the precast and UK automated-material-handling exit. In the Q&A, analysts pushed on “puts and takes” behind the 2026 ranges. Management’s tone was confident that Rail cadence should normalize (Q2–Q3 peak) because PO flow and bidding activity are back, contrasting with last year’s Doge-driven PO curtailment. However, analysts also highlighted remaining variability drivers—Infrastructure order cancellation (Summit $19M) and construction seasonality. Net: bullish on demand recovery and executable backlog, but margin sustainability still depends on successful UK and cost actions.

AI IconGrowth Catalysts

  • Rail Technologies (Friction Management) drove Rail Q4 revenue growth (Friction Management +41.6% YoY; Rail Products +31.1% YoY)
  • Infrastructure steel momentum: steel products +58.2% YoY in Q4, led by protective coatings +206.5% YoY
  • Protective coatings strength expected to continue into 2026 (protective coatings +42.7% in full-year 2025)
  • Environment/Keeper water management solution demand increasing with “large projects wins” already in backlog

Business Development

  • UK Rail: secured a $20.0 million multi-year order (driving Rail backlog up vs prior year)
  • Infrastructure: Summit order cancellation of $19.0 million (reported in Q3) reduced Infrastructure backlog

AI IconFinancial Highlights

  • Q4 net sales: $160.4M, +25.1% YoY (highest Q4 sales since 2018)
  • Q4 gross margin: 19.7%, down 260 bps (primary cause: weaker UK Rail margins tied to TS&S business; also unfavorable Rail mix)
  • Q4 SG&A: 14.4% of sales, down 470 bps YoY (SG&A dollars down $1.3M or -5.2% despite higher volume)
  • Q4 adjusted EBITDA: $13.7M, +$6.4M (+89%) YoY
  • Q4 operating cash flow: $22.2M; Q4 free cash flow supported seasonal working-capital unwind
  • Capital allocation (Q4): CapEx $2.4M; stock repurchases $3.3M; net debt reduced $16.9M to $38.4M
  • Gross leverage: 1.0x at quarter-end (down from 1.6x at start of quarter; 1.2x a year ago)
  • UK Rail restructuring: Q4 total charge $2.2M (=$1.0M in gross margin +$1.2M in SG&A); expected 2026 run-rate savings $1.5M–$2.0M
  • Full-year 2025: sales $540.0M, +1.7% YoY; Infrastructure sales +14.9% YoY; Rail sales -6.5% YoY (Doge-related U.S. Government funding impact + UK scale-down)
  • Full-year 2025 gross margin headwinds included start-up/restructuring costs: ~$2.2M start-up costs (new precast facility) and UK automated material handling product line exit costs $1.4M plus UK restructuring costs $2.2M
  • Full-year effective tax rate: higher than last year due to higher UK pretax losses not tax-effective; company expects substantially lower effective tax rate in 2026

AI IconCapital Funding

  • Q4 stock repurchases: $3.3M (121,000 shares)
  • 2025 stock repurchases: $14.4M total; shares outstanding reduced 5.4%; program restarting since 3 years ago (just over 1,000,000 shares or ~9% outstanding at avg price just under $23)
  • Buyback authorization remaining: $28.7M as of end of 2025 (authorization approved Feb 2025)
  • Net debt (end of Q4): $38.4M; gross leverage ratio for revolver just under 1.0x

AI IconStrategy & Ops

  • UK Rail: completed additional restructuring in Q4 with staff reductions and two facility closures
  • 2026 CapEx intent: increase CapEx rate to 2.7% of sales (management cited targeted organic growth programs in Precast Concrete)
  • Operational cadence/seasonality: management emphasized “bell curve” expectations for Rail in 2026 (highest revenues expected in Q2–Q3; less “make-up” required in Q4 vs 2025)
  • Rail supply chain flexibility was key in recovering billings in 2H 2025 after earlier PO curtailment

AI IconMarket Outlook

  • 2026 guidance: sales growth of 3.7% (at midpoint per management framing); adjusted EBITDA growth guidance cited as a range with midpoints referenced as 11.1% to 10.3% (as stated on the call)
  • Free cash flow (2026) expected robust: midpoint $20.0M
  • Backlog trajectory: end of Q4 backlog $189.3M (+1.8% YoY); during first two months of 2026 backlog up ~15% vs year-end
  • Rail backlog: up $34.5M vs prior year; Rail Products backlog up $10.6M; Friction Management backlog up 7.6%; TS&NS UK backlog up via $20M multi-year order
  • Infrastructure backlog down $31.1M vs prior year primarily due to Summit cancellation

AI IconRisks & Headwinds

  • UK Rail remains “extremely challenging” and drove Q4 gross margin contraction (gross margin down 260 bps; Rail margin down 440 bps in Q4)
  • Doge-related U.S. Government funding impact early 2025 created “soft Q1 start” and required 2H catch-up; management repeatedly contrasts 2026 as more normal absent similar disruptions
  • Infrastructure: Summit order cancellation ($19.0M) and lower open orders (Bridgeforms and precast concrete) weighed on Infrastructure backlog and book-to-bill
  • Effective tax rate headwind in 2025: higher due to UK pretax losses not tax-effective; management expects improvement in 2026
  • Residential real estate softness impacted demand for Biocast wall system (Florida facility) in the short term
  • Tariffs: management stated rising tariffs had a “minor impact” and are being absorbed/managed by supply chain and commercial teams

Sentiment: MIXED

Note: This summary was synthesized by AI from the FSTR Q4 2025 earnings transcript. Financial data is complex; please verify all metrics against official SEC filings before making investment decisions.

Loading financial data and tables...
📁

SEC Filings (FSTR)

© 2026 Stock Market Info — L.B. Foster Company (FSTR) Financial Profile