NLI Holdings, Inc.

NLI Holdings, Inc. (NL) Market Cap

NLI Holdings, Inc. has a market capitalization of $280.5M.

Price: $5.74

β–Ό -0.19 (-3.20%)

Market Cap: 280.47M

NYSE Β· time unavailable

CEO: Courtney J. Riley

Sector: Industrials

Industry: Security & Protection Services

IPO Date: 1980-03-17

Website: https://nliholdingsinc.com

NLI Holdings, Inc. (NL) - Company Information

Market Cap: 280.47M|Sector: Industrials

Company Profile

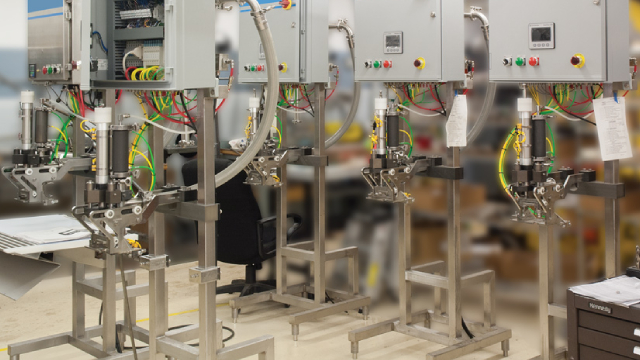
NL Industries, Inc., through its subsidiary CompX International Inc., is a global and domestic manufacturer specializing in diverse component products. The company provides an extensive portfolio of mechanical and electronic locking mechanisms. This range includes various cabinet locks, such as classic disc tumbler and pin tumbler designs, alongside modern electronic options like CompX eLock and StealthLock systems. These security solutions are integral to a wide array of applications, including ignition systems, mailboxes, office furniture (file and desk cabinets), tool storage, integrated inventory and access control for secure narcotics boxes, vending and cash containment systems, medical cabinetry, electronic circuit panels, general storage compartments, and gas station security. Beyond locking devices, NL Industries also supplies a broad selection of original equipment and aftermarket components, primarily for performance and ski/wakeboard boats. These offerings include stainless steel exhaust systems such as headers, pipes, and mufflers, as well as other exhaust-related parts. The company also provides instrumentation like GPS speedometers and tachometers, mechanical and electronic controls and throttles, and specialized marine accessories. The latter category encompasses wake enhancement devices, trim tabs, steering wheels, various billet aluminum accessories, grab handles, and pin cleats. Additionally, they offer electrical components such as dash panels, LED indicators, and wiring harnesses. Complementing its product lines, the company also delivers insurance brokerage and risk management services. NL Industries distributes its component products directly to original equipment manufacturers and leverages a network of distributors. Founded in 1891, NL Industries, Inc. is based in Dallas, Texas, and operates as a subsidiary of Valhi, Inc.

Analyst Sentiment

0%
Underperform

From 1 Active Polls

1Y Forecast: $6.00

β–² +4.5% Potential Upside

Consensus Target Metrics

Low Bound

$6

Median

$6

High Bound

$6

Average

$6

Price & Moving Averages

Loading chart...

🎯 Wall Street Analyst Intelligence Report

1-Year structural target targets, chart projections, and sentiment maps.

Average 1Y Target
$6.00
β–² +4.53% Upside
Low Target
$6.00
5% Risk
Median Target
$6.00
5% Mid
High Target
$6.00
5% Max
Consensus
Sell
0 / 1 Buys

Consensus Trend Projection

Trailing closures vs. 12-month metrics map.

Analyst Vote Distribution

Aggregate institutional coverage sentiment weights.

πŸ“Š Historical Valuation Multiples

Real-time Trailing Twelve Month (TTM) momentum side-by-side with discrete quarterly metrics.

Fiscal QuarterTTMQ1 2026Q4 2025Q3 2025Q2 2025Q1 2025Q4 2024Q3 2024Q2 2024
Period EndingTrailing 12MMar 31, 2026Dec 31, 2025Sep 30, 2025Jun 30, 2025Mar 31, 2025Dec 31, 2024Sep 30, 2024Jun 30, 2024
Market Cap ($M)280285267301313386380363289
Enterprise Value ($M)177181154199202276217217122
Price to Earnings Ratio (P/E)-8.2716.39-2.17-9.61219.18197.505.712.519.23
Price/Earnings-to-Growth Ratio (PEG)β€”2.15β€”β€”939.0140.880.41β€”β€”
Price to Sales Ratio (P/S)1.777.027.097.527.759.589.8810.788.04
Price to Book Ratio (P/B)0.780.790.740.800.790.970.960.940.77
Price to Free Cash Flow Ratio (P/FCF)66.76-72.19-56.2743.2352.60-7.9943.41-59.0219.10
Enterprise Value to Sales (EV/Sales)β€”4.474.094.985.006.865.646.463.39
Enterprise Value to EBITDA (EV/EBITDA)-4.1724.35-3.45-27.5199.6698.0510.134.7311.24
Debt to Equity Ratio2.440.000.000.000.000.000.000.000.00

πŸ“˜ Full Research Report

ℹ️

AI-Generated Research: This report is for informational purposes only.

πŸ“˜ NL INDUSTRIES INC (NL) β€” Investment Overview

🧩 Business Model Overview

NL Industries operates as a B2B industrial producer, manufacturing and selling chemical products into downstream manufacturing chains (producers of plastics/resins, coatings, and other industrial applications). The value proposition is delivered through (1) reliable production of specification-driven chemicals, (2) compliance with customer and regulatory requirements, and (3) logistics that support dependable delivery.

Customer stickiness is supported by qualification and specification requirements: once a customer selects an input based on performance, purity, and regulatory documentation, switching can require re-validation, changes to formulations, and procurement reworkβ€”creating practical switching frictions even when commodity pricing is competitive.

πŸ’° Revenue Streams & Monetisation Model

Revenue is primarily driven by the sale of manufactured chemical products. Monetisation is largely transactional (product volumes multiplied by realized pricing), but with a meaningful embedded element of customer relationship continuity due to specification/qualification needs.

Margin drivers tend to be structural and operational:

  • Feedstock and energy costs: cost position relative to competitors materially impacts gross margins.
  • Plant utilization and operating discipline: fixed-cost absorption and turnaround execution influence earnings power.
  • Product mix and specification premium: higher-spec products can partially offset commodity pricing pressure.
  • Freight/logistics efficiency: ability to ship competitively into demand centers helps preserve spread.

🧠 Competitive Advantages & Market Positioning

NL’s moat is best understood as a combination of cost-and-delivery execution plus qualification-driven switching costs. In industrial chemicals, competitors can replicate capacity, but they cannot quickly replicate a supplier’s operational track record, documentation, and consistency for specification-bound customers. This supports customer retention and reduces churn during normal demand conditions.

  • Switching Costs (qualification + formulation integration): customers must validate performance, regulatory attributes, and supply reliability.
  • Cost Advantage (feedstock/energy + operational execution): sustained margin depends on production efficiency and procurement economics versus regional peers.
  • Operational Intangibles: safety/environmental performance, quality systems, and customer-facing technical support tend to strengthen supplier stickiness over time.

Competitive benchmarking (selected peers):

  • Eastman Chemical β€” broader integrated specialty and intermediate platform; often benefits from scale and diversification across end markets.
  • Celanese β€” strength in high-performance materials and process technology; tends to compete on differentiated chemistries and performance attributes.
  • Lanxess β€” specialty chemicals focus; competes through portfolio differentiation and application-level support.

Compared with these larger, more diversified specialty platforms, NL is typically positioned as a narrower player where competitive advantage is more dependent on achieving an efficient cost curve and maintaining specification-driven customer relationships rather than relying on broad diversification across many chemical families.

πŸš€ Multi-Year Growth Drivers

  • Demand growth in downstream end markets: chemicals used in durable goods, industrial equipment, and construction tend to benefit from long-run global replacement and expansion cycles.
  • Product qualification for higher-spec formulations: improvements in performance requirements can shift mix toward products that customers validate for longer periods.
  • Regional supply economics: sustaining attractive spreads requires alignment with favorable feedstock/energy and efficient logistics into demand centers.
  • Capital allocation and operational restructuring: prudent maintenance/sustaining capex and discipline around operating performance can improve earnings durability over a full cycle.

⚠ Risk Factors to Monitor

  • Commodity and spread cyclicality: realized pricing and margin can compress when demand weakens or when competitive supply increases.
  • Regulatory and compliance risk: chemical production faces ongoing environmental, safety, and emissions requirements that can raise costs and constrain throughput.
  • Capital intensity and turnaround execution: maintenance and reliability risks can create earnings volatility and cash flow pressure.
  • Contingent liabilities: like many legacy industrials, NL should be evaluated for the balance of ongoing obligations versus future cash generation capacity.

πŸ“Š Valuation & Market View

The market for industrial chemicals and materials typically values equities using enterprise value to earnings (EV/EBITDA) and enterprise value to free cash flow, with adjustments for cycle normalization and balance-sheet/contingent liability risk. The primary valuation drivers are:

  • Durable gross margin level (sustained cost position and mix)
  • Cash conversion (working capital management and capex discipline)
  • Risk-adjusted earnings quality (volatility from spreads and utilization)
  • Balance sheet resilience (ability to fund operations and absorb shocks without value-destructive actions)

πŸ” Investment Takeaway

NL Industries’ long-term investment case rests on industrial switching frictions arising from qualification and specification requirements, supported by cost-and-operational execution in a competitive chemical manufacturing environment. Upside typically hinges on maintaining an efficient cost curve and stable supply performance across the cycle, while downside is concentrated in spread compression, regulatory/capex shocks, and legacy liability dynamics. The most rational approach is to underwrite earnings durability through operating discipline and downside resilience rather than relying on permanent price growth.


⚠ AI-generated β€” informational only. Validate using filings before investing.

πŸ“° Market News & Coverage

15 Stories Available

Real-time institutional reporting and market updates for NL.

zacks.comβ€’2026-07-17

Zacks Initiates Coverage of NL With Neutral Recommendation

Discover why Zacks, being the first on Wall Street to initiate the stock coverage, rates NL Industries as "Neutral." Explore how NL's diversified industrial portfolio balances steady growth opportunities with TiO2 market and margin risks.

globenewswire.comβ€’2026-07-14

NLI HOLDINGS ANNOUNCES EXPECTED SECOND QUARTER 2026 EARNINGS RELEASE DATE

Dallas, Texas, July 14, 2026 (GLOBE NEWSWIRE) -- NLI Holdings, Inc. (NYSE: NL) today announced that, subject to the completion of quarter-end closing procedures, it expects to report second quarter 2026 earnings in a press release after market close on Wednesday, August 5, 2026.

reuters.comβ€’2026-05-28

German-Dutch corps to lead NATO land forces in Estonia and Latvia

A combined German-Dutch army corps will take command of NATO land forces in Estonia and Latvia ​later this year to strengthen the alliance's eastern β€Œflank against a potential Russian attack, the countries said on Thursday.

globenewswire.comβ€’2026-05-14

NL INDUSTRIES, INC. ANNOUNCES QUARTERLY DIVIDEND AND RESULTS OF ANNUAL SHAREHOLDER MEETING

Dallas, Texas, May 14, 2026 (GLOBE NEWSWIRE) -- NL Industries, Inc. (NYSE:Β  NL) announced that its board of directors has declared a quarterly dividend of ten cents ($0.10) per share on its common stock, payable on June 23, 2026 to shareholders of record at the close of business on June 4, 2026.

globenewswire.comβ€’2026-04-14

NL INDUSTRIES ANNOUNCES EXPECTED FIRST QUARTER 2026 EARNINGS RELEASE DATE

Dallas, Texas, April 14, 2026 (GLOBE NEWSWIRE) -- NL Industries, Inc. (NYSE: NL) today announced that, subject to the completion of quarter-end closing procedures, it expects to report first quarter 2026 earnings in a press release after market close on Wednesday, May 6, 2026.

defenseworld.netβ€’2026-03-30

NL Industries, Inc. (NYSE:NL) Sees Significant Growth in Short Interest

NL Industries, Inc. (NYSE: NL - Get Free Report) was the recipient of a significant increase in short interest in March. As of March 13th, there was short interest totaling 134,662 shares, an increase of 51.1% from the February 26th total of 89,133 shares. Based on an average trading volume of 64,324 shares, the days-to-cover ratio

defenseworld.netβ€’2026-03-25

NL Industries (NYSE:NL) Share Price Crosses Below Two Hundred Day Moving Average – Time to Sell?

Shares of NL Industries, Inc. (NYSE: NL - Get Free Report) crossed below its 200-day moving average during trading on Tuesday. The stock has a 200-day moving average of $5.90 and traded as low as $5.63. NL Industries shares last traded at $5.7910, with a volume of 46,902 shares. Analysts Set New Price Targets A

globenewswire.comβ€’2026-03-09

NL REPORTS FOURTH QUARTER 2025 RESULTS

Dallas, Texas, March 09, 2026 (GLOBE NEWSWIRE) -- NL Industries, Inc. (NYSE: NL) today reported a net loss attributable to NL stockholders of $31.0 million, or $.63 per share, in the fourth quarter of 2025 compared to net income attributable to NL stockholders of $16.5 million, or $.34 per share, in the fourth quarter of 2024. NL's results include an unrealized loss of $4.5 million in the fourth quarter of 2025 compared to an unrealized loss $12.0 million in the fourth quarter of 2024 related to the change in value of marketable equity securities. For the full year of 2025, NL reported a net loss attributable to NL stockholders of $37.8 million, or $.77 per share, compared to net income attributable to NL stockholders of $67.2 million, or $1.38 per share for the full year of 2024. NL's full year results include an unrealized loss of $13.6 million in 2025 compared to an unrealized gain of $9.8 million in 2024 related to the change in value of marketable equity securities. Net loss per share attributable to NL stockholders for the fourth quarter and for the full year of 2025 also includes a loss of $19.7 million (or $.32 per share, net of tax) related to the termination of our U.S. pension plan. Net income per share attributable to NL stockholders for the fourth quarter and for the full year of 2024 includes aggregate income of $31.4 million ($24.8 million, $.51 per share, net of tax) related to an environmental remediation settlement, including income of $21.8 million related to the adjustment of an associated environmental accrual and $9.6 million received from former customers.

globenewswire.comβ€’2026-02-26

NL INDUSTRIES ANNOUNCES QUARTERLY DIVIDEND FOR THE FIRST QUARTER OF 2026 AT $.10 PER SHARE

Dallas, Texas, Feb. 26, 2026 (GLOBE NEWSWIRE) -- NL Industries, Inc. (NYSE: NL) today announced that its board of directors has declared a quarterly dividend of ten cents ($0.10) per share on its common stock, payable on March 26, 2026 to shareholders of record at the close of business on March 10, 2026.

seekingalpha.comβ€’2026-02-26

NL Industries: A Complex Little Performer To Watch

NL Industries trades at a material discount to book value, with a cash-rich, debt-light balance sheet and two well-performing operating entities. Ongoing litigation remains the primary risk, but recent settlements and case closures improve the forward outlook for NL. Financial forecasts suggest 5.7% revenue growth and 45.5% underlying net income growth, but margins remain volatile due to Valhi exposure.

defenseworld.netβ€’2026-02-22

Analyzing NL Industries (NYSE:NL) & Sherwin-Williams (NYSE:SHW)

Sherwin-Williams (NYSE: SHW - Get Free Report) and NL Industries (NYSE: NL - Get Free Report) are both basic materials companies, but which is the superior investment? We will compare the two companies based on the strength of their profitability, risk, analyst recommendations, earnings, institutional ownership, valuation and dividends. Profitability This table compares Sherwin-Williams and NL Industries'

defenseworld.netβ€’2026-02-22

Givaudan (OTCMKTS:GVDNY) versus NL Industries (NYSE:NL) Financial Comparison

NL Industries (NYSE: NL - Get Free Report) and Givaudan (OTCMKTS:GVDNY - Get Free Report) are both basic materials companies, but which is the superior stock? We will compare the two businesses based on the strength of their analyst recommendations, dividends, valuation, institutional ownership, earnings, profitability and risk. Insider and Institutional Ownership 10.7% of NL Industries

globenewswire.comβ€’2026-02-10

NL INDUSTRIES ANNOUNCES EXPECTED FOURTH QUARTER 2025 EARNINGS RELEASE DATE

Dallas, Texas, Feb. 10, 2026 (GLOBE NEWSWIRE) -- NL Industries, Inc. (NYSE: NL) today announced that, subject to the completion of year-end closing procedures, it expects to report fourth quarter 2025 earnings in a press release after market close on Monday, March 9, 2026.

defenseworld.netβ€’2025-12-30

Comparing NL Industries (NYSE:NL) & Trinseo (NYSE:TSE)

Trinseo (NYSE: TSE - Get Free Report) and NL Industries (NYSE: NL - Get Free Report) are both small-cap basic materials companies, but which is the superior investment? We will contrast the two businesses based on the strength of their earnings, risk, analyst recommendations, valuation, institutional ownership, dividends and profitability. Earnings and Valuation This table compares Trinseo

seekingalpha.comβ€’2025-11-20

NL Industries: Majority-Owned CompX Offsetting Kronos Concerns

NL Industries remains a strong long-term income play, despite recent share price decline and rangebound technicals. NL's real trailing dividend yield is an impressive 10.4%, boosted by special dividends and supported by a robust cash balance. CompX continues to deliver strong sales and profit growth, offsetting ongoing weakness at Kronos Worldwide.

πŸ“Š AI Financial Analysis

Powered by StockMarketInfo
Earnings Data: Q Ending 2026-03-31

"NL delivered Q1’26 revenue of $40.57M, up +0.71% QoQ (vs. $37.70M in Q4’25) and essentially flat YoY at -0.74% (vs. $40.27M in Q1’25). Net income rose sharply to $4.34M from a loss in Q4’25 (-$30.98M), improving QoQ by $35.32M. YoY, net income increased from $0.67M to $4.34M (+550.5%). Profitability strengthened: gross margin improved to 32.67% from 32.09% QoQ and 30.20% YoY, while net margin expanded to 10.71% from -82.17% QoQ and 1.66% YoY. Operating income was $4.11M with an operating margin of 10.12%, up materially QoQ (9.48% in Q4’25) and vs. 7.82% YoY. Cash flow quality is mixed. Operating cash flow was -$3.54M and free cash flow -$3.95M in Q1’26, despite positive earningsβ€”suggesting working-capital and non-cash item volatility. Dividend payments were -$1.76M, implying a payout ratio of ~40.5% of earnings, which looks more sustainable than prior quarters. Balance sheet resilience appears strong for this period: total liabilities were $83.6M with equity of $377.6M, though cash on the balance sheet is shown as 0 in Q1’26 (data issue vs. prior quarters). Total shareholder returns appear negative on price alone: the stock is down -22.82% over 1 year, indicating weak momentum. Analyst sentiment/valuation data is limited, with a consensus target of $6 vs. current $5.85 (~+2.6%)."

Revenue Growth

Neutral

Revenue was $40.57M in Q1’26: +0.71% QoQ and -0.74% YoY, indicating near-flat top-line growth.

Profitability

Good

Net income improved to $4.34M (+550.5% YoY) and operating margin rose to 10.12%. Margins expanded vs both Q4’25 and Q1’25.

Cash Flow Quality

Caution

Operating cash flow was -$3.54M and free cash flow -$3.95M in Q1’26 despite positive net income; dividend payout (~40.5%) is manageable but cash conversion is weak.

Leverage & Balance Sheet

Neutral

Equity is high ($377.6M) and liabilities are lower ($83.6M) vs prior quarters, with low stated debt ($0.93M). However, cash shown as 0 in Q1’26 conflicts with prior cash levels (possible reporting/data inconsistency).

Shareholder Returns

Neutral

Price momentum is negative: 1Y change -22.82% suggests poor capital appreciation. Dividend yield is low (~0.62%), so total return likely underwhelming.

Analyst Sentiment & Valuation

Neutral

Consensus target is $6 vs. $5.85 current (~+2.6% upside). Limited data on buybacks and no strong valuation signal from the provided multiples.

Disclaimer:This analysis is AI-generated for informational purposes only. Accuracy is not guaranteed and this does not constitute financial advice.

Fundamentals Overview

Loading fundamentals overview...

πŸ“‹ Official Regulatory 10-K / 10-Q SEC Filings

Direct authenticated documentation links to audited SEC database reports for NL.

SEC EDGAR Live Feed
Loading financial data and tables...
πŸ“

SEC Filings (NL)

Β© 2026 Stock Market Info β€” NLI Holdings, Inc. (NL) Financial Profile