Eagle Materials Inc.

Eagle Materials Inc. (EXP) Market Cap

Eagle Materials Inc. has a market capitalization of $6.29B.

Price: $204.94

-0.54 (-0.26%)

Market Cap: 6.29B

NYSE · time unavailable

CEO: Michael R. Haack

Sector: Basic Materials

Industry: Construction Materials

IPO Date: 1994-04-12

Website: https://www.eaglematerials.com

Eagle Materials Inc. (EXP) - Company Information

Market Cap: 6.29B|Sector: Basic Materials

Company Profile

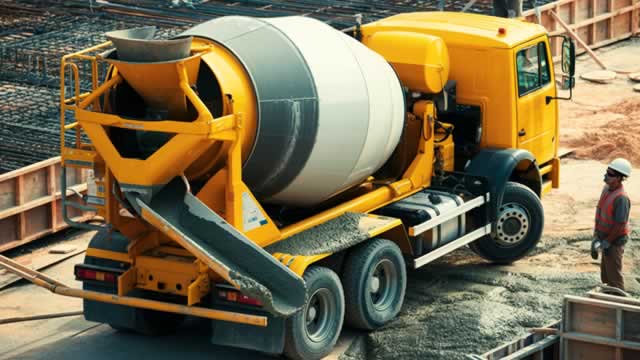
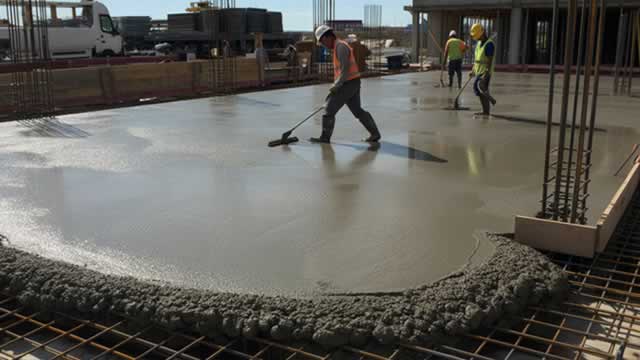
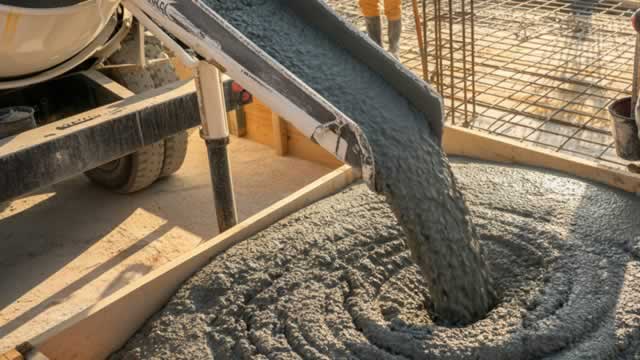
Eagle Materials Inc., operating through its subsidiaries across the United States, stands as a key producer and supplier of both heavy construction and light building materials. The company's diverse operations are organized into distinct segments: Cement; Concrete and Aggregates; Gypsum Wallboard; and Recycled Paperboard. Its core activities involve the mining of limestone for the comprehensive manufacture, distribution, and sale of Portland cement, alongside the grinding and distribution of slag. Additionally, Eagle Materials extracts gypsum to produce and market gypsum wallboard, an essential product utilized for finishing interior walls and ceilings in residential, commercial, and industrial structures. The firm also engages in the production and sale of recycled paperboard, catering to the gypsum wallboard industry and other paperboard converters, while also providing containerboard and lightweight packaging grades. Furthermore, its product portfolio includes ready-mix concrete, complemented by the mining, extraction, and sale of various aggregates such as crushed stone, sand, and gravel. These fundamental materials are integral to a broad spectrum of projects, ranging from residential and commercial building construction to public infrastructure developments and the critical construction, expansion, and repair of roads and highways. Established in 1963, the company was initially known as Centex Construction Products, Inc. before rebranding to Eagle Materials Inc. in January 2004. Its corporate headquarters are located in Dallas, Texas.

Analyst Sentiment

53%
Hold

From 10 Active Polls

1Y Forecast: $219.80

▲ +7.3% Potential Upside

Consensus Target Metrics

Low Bound

$200

Median

$219

High Bound

$240

Average

$220

Price & Moving Averages

Loading chart...

🎯 Wall Street Analyst Intelligence Report

1-Year structural target targets, chart projections, and sentiment maps.

Average 1Y Target
$219.80
▲ +7.25% Upside
Low Target
$200.00
-2% Risk
Median Target
$219.00
7% Mid
High Target
$240.00
17% Max
Consensus
Buy
16 / 25 Buys

Consensus Trend Projection

Trailing closures vs. 12-month metrics map.

Analyst Vote Distribution

Aggregate institutional coverage sentiment weights.

📊 Historical Valuation Multiples

Real-time Trailing Twelve Month (TTM) momentum side-by-side with discrete quarterly metrics.

Fiscal QuarterTTMQ2 2026Q1 2026Q4 2025Q3 2025Q2 2025Q1 2025Q4 2024Q3 2024
Period EndingTrailing 12MJun 30, 2026Mar 31, 2026Dec 31, 2025Sep 30, 2025Jun 30, 2025Mar 31, 2025Dec 31, 2024Sep 30, 2024
Market Cap ($M)6,2876,9615,9316,6657,5646,5947,4088,2219,616
Enterprise Value ($M)7,5528,2267,4298,0478,8557,8848,6639,23210,620
Price to Earnings Ratio (P/E)16.1117.0524.4116.0013.7113.3727.6017.1816.76
Price/Earnings-to-Growth Ratio (PEG)0.4820.640.386.83
Price to Sales Ratio (P/S)2.7010.6912.3811.9911.8410.3915.7514.7315.42
Price to Book Ratio (P/B)4.264.684.024.464.924.425.095.506.72
Price to Free Cash Flow Ratio (P/FCF)36.87207.02-297.67109.7078.75108.92512.21113.3857.66
Enterprise Value to Sales (EV/Sales)12.6415.5114.4713.8612.4218.4316.5417.03
Enterprise Value to EBITDA (EV/EBITDA)10.2845.1463.0443.6035.3937.4864.6245.5245.08
Debt to Equity Ratio1.721.011.221.210.860.900.880.700.77

📘 Full Research Report

ℹ️

AI-Generated Research: This report is for informational purposes only.

📘 EAGLE MATERIALS INC (EXP) — Investment Overview

🧩 Business Model Overview

Eagle Materials is a North American producer of construction and industrial materials, with key end markets spanning cement, aggregates, and performance/industrial applications where lime-based products are used for chemical processing and environmental treatment. The business model is built around manufacturing from geographically located resource bases (quarries/limestone and cement clinker capacity), followed by distribution to nearby customers through in-region logistical routes (plant-to-customer trucking, rail, and limited long-haul transportation).

This creates customer reliance on local, spec-qualified supply—especially where product performance and delivery reliability matter more than brand preference. In practice, customers source based on a combination of technical fit, delivery economics, and continuity of supply.

💰 Revenue Streams & Monetisation Model

Revenue is primarily transactional: sales of cement, aggregates, and lime/related industrial products priced off prevailing market conditions. Monetisation is therefore driven by (1) volume in construction/industrial cycles, (2) realized pricing versus input and operating costs, and (3) freight/logistics economics.

Margin structure typically depends on:

  • Cost position: limestone quality, quarrying efficiency, and plant operating stability.
  • Energy and utility costs: kiln and process energy costs can pressure margins.
  • Logistics economics: minimizing long-haul freight and securing distribution routes protect spread.
  • Product mix: industrial/environmental volumes can be less construction-cyclical than pure aggregates exposure.

While the company does not operate like a subscription-based model, industrial customers can exhibit more repeat purchasing behavior when technical requirements and delivery lead times favor established local suppliers.

🧠 Competitive Advantages & Market Positioning

Eagle’s moat is primarily rooted in geographic cost advantage and logistical infrastructure, supported by spec and supply continuity that raise practical switching friction.

  • Geographic cost advantage (low-cost resource proximity): Limestone and other inputs are heavy and costly to move. Quarry proximity and yield/quality advantages lower delivered cost relative to competitors dependent on longer transportation routes.
  • Logistical infrastructure: Distribution within effective shipping radii (including rail/truck networks and plant placement) reduces delivered cost and helps sustain service levels during demand fluctuations.
  • Operational and specification stickiness: For industrial/lime applications (e.g., steel fluxing, environmental neutralization, and process chemistry), customers value consistent product performance and reliable supply—creating friction to switch to distant or less-tested producers.

Competitive benchmarking:

  • Lhoist and Carmeuse (lime): These players compete across similar industrial applications, often leveraging their own regional quarry and plant networks. Eagle’s positioning relies on matching cost and delivery economics in its key service areas rather than competing globally on scale.
  • Martin Marietta and CalPortland (cement/aggregates): These rivals emphasize integrated construction materials footprints. Eagle competes by combining cement/aggregate production with its industrial/lime exposure, which can diversify end-market cyclicality.

Overall, compared with broader construction-material competitors, Eagle’s industrial exposure tied to lime applications strengthens the argument for durable demand pockets where logistics and performance requirements limit easy displacement.

🚀 Multi-Year Growth Drivers

Over a 5–10 year horizon, growth is supported less by category “share capture” and more by macro demand durability and regulatory/industrial needs that favor calcium-based materials.

  • Infrastructure and housing-related cement/aggregate demand: long-cycle capital spending supports baseline volumes.
  • Environmental compliance and emissions control: lime-based products are used in air and water treatment processes. Regulatory frameworks and ongoing retrofit activity sustain demand for neutralization and sulfur capture applications.
  • Steel and metals processing: lime functions as a flux and in process chemistry. Industrial capex and resource intensity in metals can support volumes beyond pure construction cycles.
  • Operational efficiency and capacity rationalization: in material businesses, disciplined maintenance, cost control, and prudent capacity utilization often matter as much as headline demand growth for long-run shareholder value.
  • Geographic specialization: expanding distribution within existing low-cost footprints and optimizing logistics can grow value capture without requiring structurally higher-cost new build.

⚠ Risk Factors to Monitor

  • Cyclicality and construction demand: cement and aggregates are sensitive to construction activity and credit conditions.
  • Energy and input cost volatility: kiln/process energy, utilities, and consumables can compress margins if pricing does not track cost inflation.
  • Environmental permitting and regulatory constraints: quarrying, emissions, and waste handling requirements can raise costs and constrain long-term capacity.
  • Logistics and regional supply changes: new capacity or capacity restarts in served regions can intensify price competition and reduce spreads.
  • Capital intensity: cement and material plants are capital-heavy; major maintenance cycles, expansion, or compliance retrofits can influence free cash flow.
  • Substitution risk in niche industrial uses: process modifications or alternative chemistries can reduce lime consumption in specific end uses.

📊 Valuation & Market View

The market typically values building materials and industrial producers using EV/EBITDA and enterprise-value-based frameworks, supplemented by free cash flow yield given cyclicality. In many such businesses, valuation sensitivity is driven by:

  • Operating margin durability (pricing power vs. energy and logistics costs)
  • Volume and utilization across cement/aggregate cycles
  • Capital discipline and expected maintenance versus growth capex profiles
  • Net leverage and balance-sheet flexibility through downturns

Because product markets are commodity-like, sustained premium valuation generally requires evidence of structural cost advantage (resource access, logistics, and execution) rather than purely cyclical expansion.

🔍 Investment Takeaway

Eagle Materials presents a defensible long-term thesis grounded in geographic cost advantage from resource proximity, logistical infrastructure that supports delivered-cost competitiveness, and practical switching friction in industrial applications where performance and supply continuity matter. The investment case is strengthened by exposure to both construction-linked demand and regulatory/environmental and metals-processing uses of calcium-based materials, providing a framework for navigating cycles while maintaining emphasis on cost discipline and capacity utilization.


⚠ AI-generated — informational only. Validate using filings before investing.
📰 Market News & Coverage

15 Stories Available

Real-time institutional reporting and market updates for EXP.

marketbeat.com2026-07-29

Eagle Materials Q1 Earnings Call Highlights

Eagle Materials NYSE: EXP reported record first-quarter fiscal 2027 revenue of $651 million, up 3% from a year earlier, as higher cement volumes, record recycled paperboard sales and increased aggregates sales offset weaker wallboard results.

seekingalpha.com2026-07-29

Eagle Materials Inc. (EXP) Q1 2027 Earnings Call Transcript

Eagle Materials Inc. (EXP) Q1 2027 Earnings Call Transcript

zacks.com2026-07-29

Eagle Materials (EXP) Q1 Earnings: Taking a Look at Key Metrics Versus Estimates

The headline numbers for Eagle Materials (EXP) give insight into how the company performed in the quarter ended June 2026, but it may be worthwhile to compare some of its key metrics to Wall Street estimates and the year-ago actuals.

zacks.com2026-07-29

Eagle Materials (EXP) Tops Q1 Earnings and Revenue Estimates

Eagle Materials (EXP) came out with quarterly earnings of $3.29 per share, beating the Zacks Consensus Estimate of $3.26 per share. This compares to earnings of $3.76 per share a year ago.

businesswire.com2026-07-29

Eagle Materials Reports First Quarter Results

DALLAS--(BUSINESS WIRE)--Eagle Materials Inc. (NYSE: EXP) today reported financial results for the first quarter of fiscal 2027 ended June 30, 2026. Notable items for the quarter are highlighted below. (Unless otherwise noted, all comparisons are with the prior year's fiscal first quarter.) First Quarter Fiscal 2027 Highlights Record Revenue of $651.0 million, up 3% Net Earnings of $102.1 million, down 17% Net Earnings per diluted share of $3.29, down 13% Cashflow from Operations of $154 millio.

defenseworld.net2026-07-29

Dimensional Fund Advisors LP Grows Stake in Eagle Materials Inc $EXP

Dimensional Fund Advisors LP boosted its holdings in shares of Eagle Materials Inc (NYSE: EXP) by 2.7% during the undefined quarter, according to its most recent filing with the Securities and Exchange Commission. The firm owned 627,427 shares of the construction company's stock after purchasing an additional 16,782 shares during the quarter. Dimensional

fool.com2026-07-22

What This Eagle Materials Filing Signals With Cement Up 10% and Wallboard Down 9%

A director at Eagle Materials reported the disposal of 1,577 shares worth about $336,279 based on the June 17, 2026, weighted average price. The disposal reduced the director's direct common stock holdings by 3%.

zacks.com2026-07-22

Earnings Preview: Eagle Materials (EXP) Q1 Earnings Expected to Decline

Eagle Materials (EXP) doesn't possess the right combination of the two key ingredients for a likely earnings beat in its upcoming report. Get prepared with the key expectations.

defenseworld.net2026-07-18

Allspring Global Investments Holdings LLC Cuts Stake in Eagle Materials Inc $EXP

Allspring Global Investments Holdings LLC lessened its holdings in shares of Eagle Materials Inc (NYSE: EXP) by 34.8% during the undefined quarter, according to its most recent filing with the Securities and Exchange Commission. The firm owned 391,591 shares of the construction company's stock after selling 209,234 shares during the quarter. Allspring Global

businesswire.com2026-07-15

Eagle Materials Schedules First Quarter Fiscal 2027 Earnings Release and Conference Call With Senior Management

DALLAS--(BUSINESS WIRE)--Eagle Materials Inc. (NYSE: EXP) will release financial results for the first quarter of fiscal year 2027 ended June 30, 2026, on Wednesday, July 29, 2026, before the open of the NYSE and will host an investor conference call the same day, Wednesday, July 29, 2026, at 8:30 am Eastern Time (7:30 am Central Time). The call can be accessed as follows:   Webcast and slide presentation: ir.eaglematerials.com/webcasts-presentations   The slides will be available for download.

zacks.com2026-07-10

3 Concrete & Aggregates Stocks Set to Gain From Infrastructure Boom

Federal infrastructure spending should help the Zacks Building Products - Concrete & Aggregates industry players like VMC, EXP and RMIX.

zacks.com2026-07-02

Best Value Stocks to Buy for July 2nd

ADM, EXP and OPFI made it to the Zacks Rank #1 (Strong Buy) value stocks list on July 2, 2026.

zacks.com2026-06-19

Eagle Materials (EXP) Surges 5.3%: Is This an Indication of Further Gains?

Eagle Materials (EXP) witnessed a jump in share price last session on above-average trading volume. The latest trend in earnings estimate revisions for the stock suggests that there could be more strength down the road.

zacks.com2026-06-03

Eagle Materials (EXP) Upgraded to Buy: Here's Why

Eagle Materials (EXP) has been upgraded to a Zacks Rank #2 (Buy), reflecting growing optimism about the company's earnings prospects. This might drive the stock higher in the near term.

businesswire.com2026-05-20

Eagle Materials Declares Quarterly Dividend

DALLAS--(BUSINESS WIRE)--The Board of Directors of Eagle Materials Inc. (NYSE: EXP) has declared a quarterly cash dividend of $0.25 per share, payable on July 20, 2026, to stockholders of record of its Common Stock at the close of business on June 15, 2026. About Eagle Materials Inc. Eagle Materials Inc. is a leading U.S. manufacturer of heavy construction products and light building materials. Eagle's primary products, Portland Cement and Gypsum Wallboard, are essential for building, expanding.

📊 AI Financial Analysis

Powered by StockMarketInfo
Earnings Data: Q Ending 2026-06-30

"EXP reported Q1 2026 revenue of $651.0M and net income of $102.1M (EPS $3.30). Versus the prior quarter (Q4 2025), revenue rose 35.9% (from $479.1M to $651.0M) and net income increased 69.8% (from $60.2M to $102.1M). Year over year (Q1 2025 vs Q1 2026), revenue grew 2.6% (from $634.7M to $651.0M) while net income fell 17.2% (from $123.4M to $102.1M). Profitability was mixed: gross margin declined to 24.8% from 29.2% in Q1 2025, and net margin eased to 15.7% (down from 19.4% a year ago). QoQ, operating income and EBITDA improved materially alongside the revenue rebound (EBITDA margin improved to 28.0% vs 24.6% in Q4 2025). Cash flow quality was solid this quarter—operating cash flow of $154.4M supported a positive free cash flow of $33.6M, despite continuing buybacks ($86.4M) and modest dividends ($8.0M). Balance sheet resilience remained stable with total assets at $3.86B and equity at $1.49B; leverage is elevated with net debt of ~$1.27B. Total shareholder returns are likely restrained given the stock’s -7.0% 1y performance, despite ongoing capital returns. Analyst valuation context is broadly neutral-to-positive with a consensus target ($219.8) above the current price (~$201.3)."

Revenue Growth

Positive

QoQ revenue jumped 35.9% ($479.1M to $651.0M) while YoY growth was modest at +2.6% ($634.7M to $651.0M), suggesting a quarter-specific rebound rather than sustained acceleration.

Profitability

Caution

Margins contracted over the year: gross margin to 24.8% from 29.2% and net margin to 15.7% from 19.4%. QoQ profitability improved (net income +69.8%), but the YoY drift is negative.

Cash Flow Quality

Positive

Q1 OCF was $154.4M and free cash flow was positive at $33.6M (vs Q4 FCF negative). Dividends were small ($8.0M) and buybacks continued ($86.4M), indicating acceptable cash generation to fund returns.

Leverage & Balance Sheet

Fair

Balance sheet stayed relatively stable (total assets ~$3.86B; equity ~$1.49B), but leverage remains meaningful with net debt of ~$1.27B and total debt ~$1.50B.

Shareholder Returns

Fair

Capital returns are present (buybacks + dividends), but stock momentum is weak: 1y change is -7.0%, which likely offsets some shareholder value from buybacks.

Analyst Sentiment & Valuation

Positive

Consensus price target ($219.8) sits above the current price (~$201.3), implying upside bias from street expectations.

Disclaimer:This analysis is AI-generated for informational purposes only. Accuracy is not guaranteed and this does not constitute financial advice.

Fundamentals Overview

Loading fundamentals overview...

Eagle delivered another solid year of throughput amid a choppy housing backdrop, with FY2026 revenue at $2.3B (+2%) and Q4 revenue at $479M (+2%). EPS of $13.16 was down 4% as weaker Wallboard volume/prices drove lower net earnings, partially offset by a 5% reduction in diluted shares via repurchases. Heavy materials were the offset: cement volume grew 8%, concrete & aggregates revenue rose 19%, and total aggregate volume reached a record 6.6M tons (+70% YoY) supported by acquired operations and 24% organic growth. Margin support came from plant efficiency improvements and normalized operations, while freight/diesel inflation was quantified ($2 to $3 sequential on delivered Wallboard; several dollars per ton for cement terminal freight). Management is actively executing cement and Wallboard price actions (April 1 and June 1). Capital remains heavy for modernization—Mountain Cement (~60% complete) and Duke wallboard (~30%)—with FY2027 CapEx guided at $490M–$525M and a target double-digit return on the two major projects. Near-term risks remain residential affordability and Wallboard demand lag.

AI IconGrowth Catalysts

  • Cement volume uplift supported by tightening regional markets from public infrastructure and data center development
  • Heavy materials improvement driven by 8% cement sales volume growth and 19% higher concrete & aggregates revenue
  • Organic aggregates volume growth of 24% indicating underlying demand strength
  • Wallboard relative price stability amid industry raw material/supply constraints
  • Operational efficiency improvements across plants supporting margin profile

Business Development

  • Acquired aggregates businesses contributing to record aggregate volume and sales volume growth (70% YoY; organic aggregates +24%)

AI IconFinancial Highlights

  • FY2026 revenue: $2.3B, +2% YoY; Q4 revenue: $479M, +2% YoY
  • FY2026 EPS: $13.16, down 4% (net earnings decline driven by lower Wallboard volume/prices offset partially by 5% share count reduction from buybacks)
  • Heavy materials revenue +10% (cement volume +8%; concrete & aggregates revenue +19%); aggregate sales volume record 6.6M tons (+70% YoY total; +24% organic)
  • Light materials (Wallboard & recycled paperboard): revenue -9% to $881M and operating earnings -15% to $331M due to lower Wallboard volume and prices
  • Cement net prices down 1% (operating earnings +10% despite net cement sales price decline)
  • Diesel/freight cost quantification: Wallboard freight cost impact estimated +$2 to +$3 per unit on delivered pricing; cement freight to terminals also showed several dollars per ton inflation
  • Price actions: cement price increases in most markets effective April 1; Wallboard June 1 price increase explicitly tied to freight bill reverting to company
  • Capital return: $414M returned in FY2026 ($382M repurchase for ~1.7M shares + dividends), leaving 2.9M shares under repurchase authorization

AI IconCapital Funding

  • Issued $750M 10-year senior notes at 5% interest (improved maturity profile; enhanced committed liquidity)
  • Repaid borrowings under bank credit facility using part of note proceeds
  • Ended quarter with $298M cash and ~$1B total committed liquidity
  • Leverage/coverage metrics: net debt-to-capital 50%; net debt-to-EBITDA 1.9x; no significant near-term debt maturities mentioned
  • Repurchase authorization remaining: ~2.9M shares

AI IconStrategy & Ops

  • Mountain Cement plant modernization: ~60% complete; commissioning of new kiln line expected late calendar 2026
  • Duke, Oklahoma wallboard plant: ~30% complete; commissioning expected in second half of calendar 2027
  • Investments expected to lower cost structure, improve reliability, expand capacity, and increase production flexibility
  • Paper mill running record well; recycled paperboard/paper mill efficiency cited as key driver of margin stability; long-term supply agreements with inflators/deflators mitigate OCC variability

AI IconMarket Outlook

  • Fiscal 2027 CapEx guidance: $490M to $525M (peak spending expected in FY2027; Mountain Cement commissioning late calendar 2026 and Duke project expected to conclude mid-FY2028)
  • Construction season commentary: improved order/volume momentum starting in April and carrying into May; shaping up for a good FY2027 year
  • Volume expectation: management remains optimistic for positive momentum in cement volumes in FY2027 (not expecting double-digit growth) versus cited national data showing low single-digit declines
  • Wallboard: demand and pricing linked to housing normalization; near-term crystal ball unclear, but broader time period shows upside for volume/price/margins given underbuilt housing

AI IconRisks & Headwinds

  • Wallboard demand affected by residential affordability headwinds; requires mortgage-rate relief to drive home inventory turnover and normalized new home construction
  • Wallboard sales volumes and prices down YoY in FY2026 causing sector revenue -9% and operating earnings -15%
  • Cement pricing pressure: net cement sales prices down 1% YoY and some Western/down-south markets did not have April 1 increases (executing thereafter) with higher freight costs partly offsetting price increases
  • Ocean freight/fuel cost pressures: Baltic Dry Index tick-up increasing costs and upward pressure on import pricing into South Texas and Northern California markets
  • Macro policy uncertainty: proposed IIJA replacement/gas tax holiday chatter creates early uncertainty on timing/amounts despite management viewing IIJA extension supportive

Q&A: Analyst Interest

  • Topic: Cement & Wallboard pricing mechanics and freight/diesel quantification: Management quantified Wallboard freight bill exposure at roughly a $2 to $3 per unit sequential increase because Wallboard is priced on a delivered basis. Cement exposure was described as a mix of customer pickup and company freight to terminals; they cited several dollars per ton and emphasized delivered costs as more meaningful.
  • Topic: April 1 cement price increases and potential Wallboard pricing bottom: Management confirmed April 1 cement price increases in most markets, with some regions (notably Western/down south) lacking increases and later execution underway. For Wallboard, they stated a June 1 price increase with freight bill reversion support, but near-term pricing depends on demand given housing remains far below expected trend.
  • Topic: Forward demand outlook versus industry data (PCA/ACA) and data center contribution: Management agreed data-center demand is meaningful and argued it is not late-cycle, citing early-stage site work and that private non-res components (warehouses, data centers, fabrication facilities) now materially contribute. They remain optimistic for positive cement volume momentum in fiscal 2027, not double-digit growth, with market-level outperformance versus national trends.

Sentiment: MIXED

Note: This summary was synthesized by AI from the EXP Q4 2026 earnings transcript. Financial data is complex; please verify all metrics against official SEC filings before making investment decisions.

📋 Official Regulatory 10-K / 10-Q SEC Filings

Direct authenticated documentation links to audited SEC database reports for EXP.

SEC EDGAR Live Feed
Loading financial data and tables...
📁

SEC Filings (EXP)

© 2026 Stock Market Info — Eagle Materials Inc. (EXP) Financial Profile