Flex Ltd.

Flex Ltd. (FLEX) Market Cap

Flex Ltd. has a market capitalization of $55.66B.

Price: $151.92

-7.59 (-4.76%)

Market Cap: 55.66B

NASDAQ · time unavailable

CEO: Revathi Advaithi

Sector: Technology

Industry: Hardware, Equipment & Parts

IPO Date: 1994-03-18

Website: https://www.flex.com

Flex Ltd. (FLEX) - Company Information

Market Cap: 55.66B|Sector: Technology

Company Profile

Flex Ltd. provides design, engineering, manufacturing, and supply chain services and solutions to original equipment manufacturers in Asia, the Americas, and Europe. It operates through three segments: Flex Agility Solutions (FAS), Flex Reliability Solutions (FRS), and Nextracker. The company provides cross-industry technologies, including human-machine interface, internet of things platforms, power, sensor fusion, and smart audio. It also offers integrated solar tracker and software solutions used in utility-scale and ground-mounted distributed generation solar projects. In addition, the company provides value-added design and engineering services; and systems assembly and manufacturing services that include enclosures, testing services, and materials procurement and inventory management services. Further, it offers chargers for smartphones and tablets; adapters for notebooks and gaming systems; power supplies for the server, storage, and networking markets; and power solutions, such as switchgear, busway, power distribution, modular power systems, and monitoring solutions and services. Additionally, the company provides after-market and forward supply chain logistics services to computing, consumer digital, infrastructure, industrial, mobile, automotive, and medical industries; and reverse logistics and repair solutions, including returns management, exchange programs, complex repair, asset recovery, recycling, and e-waste management. It serves to cloud, communications, enterprise, automotive, industrial, consumer devices, lifestyle, healthcare, and energy industries. The company was formerly known as Flextronics International Ltd. and changed its name to Flex Ltd. in September 2016. Flex Ltd. was incorporated in 1990 and is based in Singapore.

Analyst Sentiment

85%
Strong Buy

From 11 Active Polls

1Y Forecast: $150.00

▼ -1.3% Potential Upside

Consensus Target Metrics

Low Bound

$80

Median

$171

High Bound

$203

Average

$150

Price & Moving Averages

Loading chart...

🎯 Wall Street Analyst Intelligence Report

1-Year structural target targets, chart projections, and sentiment maps.

Average 1Y Target
$150.00
▼ -1.26% Upside
Low Target
$80.00
-47% Risk
Median Target
$171.00
13% Mid
High Target
$203.00
34% Max
Consensus
Buy
18 / 25 Buys

Consensus Trend Projection

Trailing closures vs. 12-month metrics map.

Analyst Vote Distribution

Aggregate institutional coverage sentiment weights.

📊 Historical Valuation Multiples

Real-time Trailing Twelve Month (TTM) momentum side-by-side with discrete quarterly metrics.

Fiscal QuarterTTMQ1 2026Q4 2025Q3 2025Q2 2025Q1 2025Q4 2024Q3 2024Q2 2024
Period EndingTrailing 12MMar 31, 2026Dec 31, 2025Sep 26, 2025Jun 27, 2025Mar 31, 2025Dec 31, 2024Sep 27, 2024Jun 28, 2024
Market Cap ($M)55,66024,48222,71821,60319,00812,86814,85713,22311,778
Enterprise Value ($M)53,83622,65825,26223,64721,03314,72716,69814,80713,213
Price to Earnings Ratio (P/E)64.5724.4823.7627.1424.7514.4914.1215.4521.18
Price/Earnings-to-Growth Ratio (PEG)4.126.377.798.9584.034.220.53
Price to Sales Ratio (P/S)1.993.273.223.182.892.012.272.021.87
Price to Book Ratio (P/B)11.054.764.444.293.742.572.982.642.36
Price to Free Cash Flow Ratio (P/FCF)52.91116.0383.5271.3071.4640.0949.3661.2251.43
Enterprise Value to Sales (EV/Sales)3.033.583.483.202.302.552.262.09
Enterprise Value to EBITDA (EV/EBITDA)31.4553.3166.8350.3147.9131.4034.1533.0535.33
Debt to Equity Ratio-1.070.111.090.850.840.830.830.840.74

FLEX Growth Runway Model

Standard long term linear growth fade

Multi-Stage Discounted Cash Flow Sandbox

Market Price$151.92
Intrinsic Value$172.27
Market Alignment
Undervalued by 13.4%relative to calculated intrinsic value
9.00%
Exp: 4%4%
i

Growth runway slowdown

This value provides a time window for the growth rate to decline beyond Stage 1 toward the terminal rate. Longer windows are most useful for companies with high growth starting conditions or strong competitive advantages. This option stretches out the growth rate slowdown across 5, 10, or 15-year steps. A high-growth starting condition (exceeding a 25% initial growth rate) automatically applies a curve decay to simulate realistic, rapid market saturation.
i

Terminal growth rate

With long-term inflation between 3-5%, revenue must grow by that baseline to maintain flat real-world market share. This value sets the permanent terminal growth rate to factor into the valuation beyond the growth slowdown runway toward maturity.

3-Stage Financial Runway Horizon

🧠 Perpetuity Horizon Engine (Stage 3: Post-2036)

Terminal FCF Base$2.32B
Perpetuity TV Value$43.64B
Discounted TV (PV)$16.91B
TV Weighting %56.2%
⚠️
Financial Model Disclaimer & Risk Disclosure: This interactive scenario simulator is an educational sandbox provided strictly for informational and analytical research purposes. Core historical financial statements and consensus estimates are sourced directly via Financial Modeling Prep (FMP). All downstream outputs are entirely deterministic, hypothetical projections generated by combining automated mathematical formulas (including linear interpolation and Gaussian bell-curve decay models) with user-selected variables and third-party financial data inputs. Users assume all liability for trading decisions executed based on these sandbox calculations.

📘 Full Research Report

ℹ️

AI-Generated Research: This report is for informational purposes only.

📘 FLEX LTD (FLEX) — Investment Overview

🧩 Business Model Overview

FLEX operates in electronics manufacturing services (EMS) with an engineering and supply-chain layer that supports customers from early design through production and lifecycle services. The value chain centers on (1) design/engineering support (often translating customer requirements into manufacturable product architectures), (2) large-scale procurement and component sourcing, (3) global manufacturing execution (including test, integration, and quality systems), and (4) logistics and after-production services that reduce customer operational burden.

The business model creates stickiness through embedded know-how and qualification processes: once a product program is designed, tooled, tested, and approved across FLEX’s manufacturing sites and supplier network, switching costs rise for both engineering teams and operations due to re-qualification requirements, supply assurance needs, and the disruption risk to production schedules.

💰 Revenue Streams & Monetisation Model

Revenue is primarily driven by contracted electronics production and related services. Monetisation typically comes from:

  • Manufacturing services: unit-based revenue tied to product programs, with margins influenced by factory utilization, yield/quality, and product mix.
  • Engineering and lifecycle services: higher-value work that can carry better margin profiles than pure assembly, and tends to be supported by longer customer relationships.
  • Supply-chain and procurement scale: while not always presented as a standalone revenue line, large purchasing volumes and vendor management can improve cost competitiveness and working-capital outcomes.

Margin drivers are structural: absorption of fixed costs through utilization, engineering depth that reduces manufacturing complexity, disciplined program transition management, and the ability to manage component price volatility and logistics constraints. Contract structure also matters—programs with clearer scope, stable demand assumptions, and manageable ramp risk generally support stronger earnings durability.

🧠 Competitive Advantages & Market Positioning

FLEX’s competitive edge is less about a single “product moat” and more about an operational and qualification moat in complex electronics programs. Key advantages include:

  • High switching costs (program qualification + design-to-manufacture integration): manufacturing processes, test fixtures, and quality approvals are tied to specific product programs; replacing a qualified partner can require re-certification, re-tooling, and supply requalification.
  • Cost advantages (scale procurement + manufacturing learning curves): EMS peers compete on unit cost, yield, and throughput efficiency, all of which improve with volume and operational discipline.
  • Customer “systems” positioning (engineering + supply-chain execution): FLEX’s engineering services and production execution can shorten customer development-to-volume timelines, a practical differentiator in electronics where product cycles and component constraints change frequently.

Competitive benchmarking:

  • Jabil: similarly positioned in high-mix manufacturing and supply-chain services, often competing on operational excellence and program depth.
  • Sanmina: focuses on integrated electronics manufacturing and higher-complexity solutions, competing on engineering content and vertical integration.
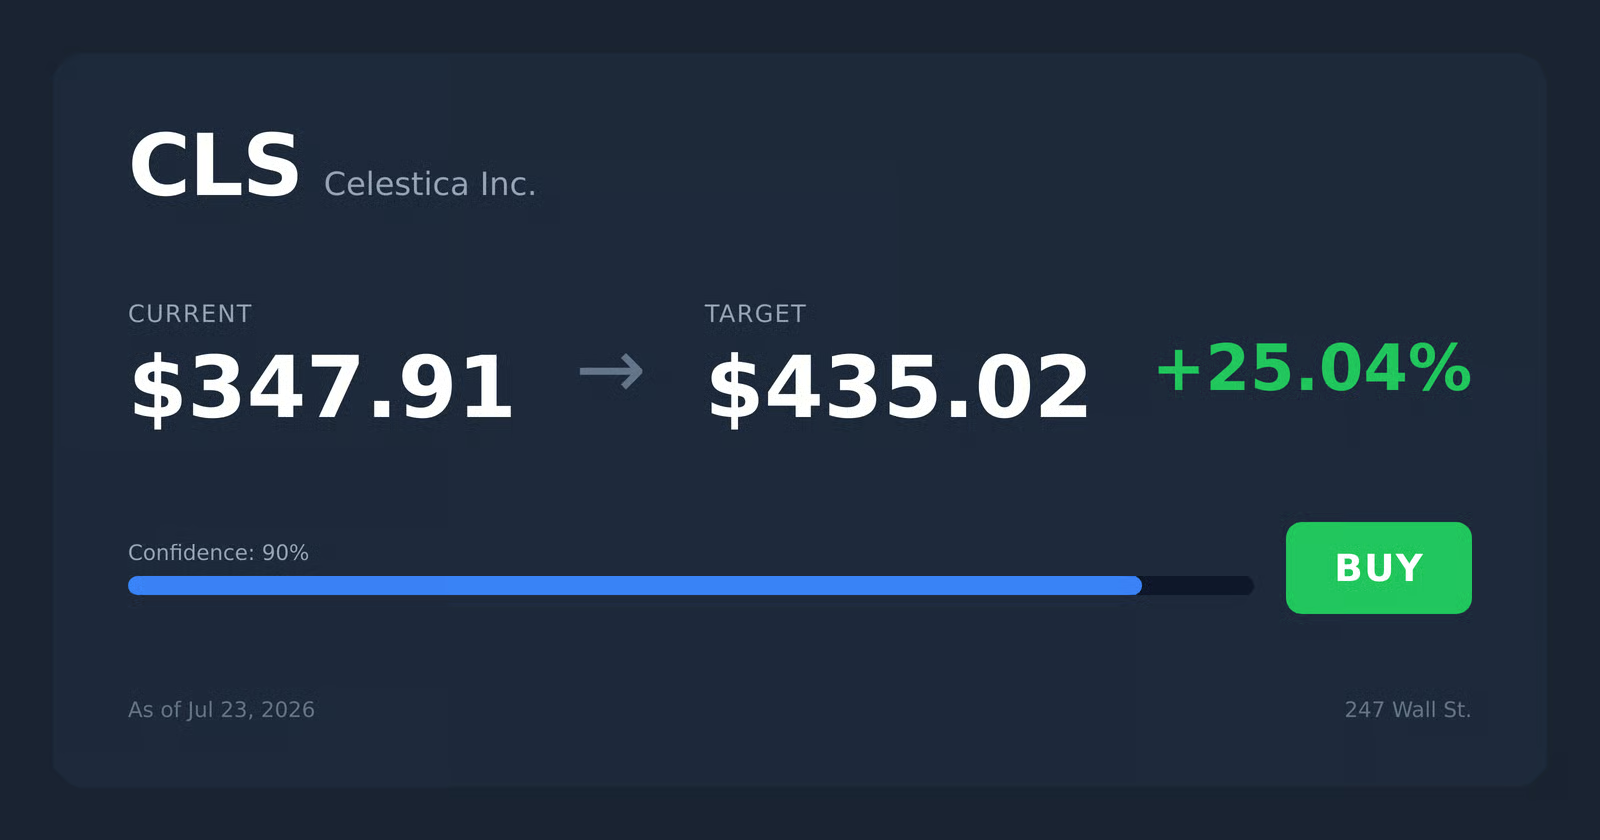
  • Celestica: competes in complex electronics manufacturing, emphasizing engineering-led execution in select end markets.

Compared with these peers, FLEX’s industry focus emphasizes serving a broad set of end markets (including communications, industrial/enterprise platforms, and mobility/other electronics categories) with a global execution footprint. The differentiating element is the breadth of customer categories paired with engineering-backed production capability, which helps sustain program flow across cycles—provided execution discipline is maintained.

🚀 Multi-Year Growth Drivers

Over a 5–10 year horizon, FLEX’s opportunity is tied to structural electronics demand plus supply-chain reconfiguration:

  • Electrification and compute expansion: growth in data connectivity, cloud/edge infrastructure, industrial automation, and vehicle electronics increases the content of manufactured electronics per system.
  • Resilient supply chains and diversification: customers continue shifting toward vendor networks that can manage geography, component availability, and logistics risk—supporting EMS demand for capable global partners.
  • Engineering-led content: as products integrate more functions and require tighter test/quality regimes, customers increasingly seek manufacturing partners with strong design-for-manufacturing and process engineering capabilities.
  • Lifecycle and service work: longer product lifecycles in industrial and some defense/aerospace-adjacent programs can support recurring service demand (maintenance, repairs, and ongoing production variants).

TAM expansion is ultimately expressed through customer program wins and share in complex, high-mix builds. The most investable growth is typically “earned” via engineering credibility and reliable execution during ramp-ups, when qualification risk is highest.

⚠ Risk Factors to Monitor

  • End-market cyclicality and demand forecasting risk: EMS revenue can swing with customer build plans, driving volatility in utilization and working capital.
  • Margin pressure from program mix and ramp execution: adverse mix shifts, under-quoted programs, or production ramps can compress gross margins and increase cost of quality.
  • Customer concentration and contract terms: reliance on key customers and the ability to negotiate favorable scope, pricing mechanisms, and change-order dynamics materially affect earnings resilience.
  • Supply-chain and technology transition constraints: component availability, obsolescence risk, and rapid technology shifts can create higher costs or require accelerated reconfiguration.
  • Trade and regulatory exposure: tariffs, export controls, and localization requirements can affect cost structures and capacity allocation decisions.

📊 Valuation & Market View

The market typically values EMS businesses on EV/EBITDA and similar cash-flow-based metrics, with emphasis on margin quality and earnings durability. Drivers that tend to move valuation include:

  • Sustainable operating margins supported by utilization, yield, and engineering/content mix.
  • Conversion of earnings to free cash flow through disciplined working-capital management.
  • Program win momentum and the ability to execute ramps without persistent cost overruns.
  • Resilience across cycles demonstrated by stable customer relationships and manageable customer concentration.

For investors, the key is not “growth at any price,” but rather the balance between contract structure, manufacturing discipline, and cash generation.

🔍 Investment Takeaway

FLEX is best viewed as an operational compounding story in complex electronics: switching costs rise as programs pass through qualification and engineering-to-manufacturing integration; scale and process capability create cost advantages; and global execution supports customer diversification needs. The long-term thesis depends on maintaining disciplined ramp execution, protecting margin quality through mix management, and sustaining engineering-led customer relationships that translate into durable program inflows.


⚠ AI-generated — informational only. Validate using filings before investing.

📰 Market News & Coverage

15 Stories Available

Real-time institutional reporting and market updates for FLEX.

investopedia.com2026-06-06

Marvell Gets Another Shout-Out: It (And Flex) Are Joining the S&P 500

It might be a while before Marvell Technology becomes as valuable as Jensen Huang foresees. But some news late Friday gives it another boost.

prnewswire.com2026-06-05

Marvell Technology and Flex Set to Join S&P 500; Others to Join S&P MidCap 400 and S&P SmallCap 600

NEW YORK, June 5, 2026 /PRNewswire/ -- S&P Dow Jones Indices will make the following changes to the S&P 500, S&P MidCap 400, and S&P SmallCap 600 indices effective prior to the open of trading on Monday, June 22, 2026, to coincide with the quarterly rebalance. The changes ensure that each index is more representative of its market capitalization range.

investors.com2026-06-05

Marvell Technology, Flex To Join S&P 500 Index In Quarterly Rebalance

Marvell Technology and Flex will join the S&P 500 before the open on June 22. Roku is among new entrants to the Midcap 400.

cnbc.com2026-06-05

Marvell Technology and Flex to join S&P 500 index, replacing Pool and Campbell's

Marvell Technology, which makes parts and products needed for the AI infrastructure boom, is joining the S&P 500 It is the latest semiconductor company to be added to the benchmark.

zacks.com2026-06-04

3 Electronics Stocks Set to Benefit From a Prospering Industry

Electronics stocks like KLAC, TER and FLEX are expected to benefit from investments in infrastructure and expanded capacity despite macroeconomic headwinds.

zacks.com2026-06-04

Flex (FLEX) Up 20.2% Since Last Earnings Report: Can It Continue?

Flex (FLEX) reported earnings 30 days ago. What's next for the stock?

zacks.com2026-06-04

Flex Fuels Growth via SpinCo Separation & Electrical Power Acquisition

FLEX is separating its Power and Cloud portfolio, acquiring Electrical Power and expanding capabilities tied to AI data centers, grid modernization and electrification.

seekingalpha.com2026-06-04

FLEX LNG: Short-Term Noise, Long-Term Opportunity

FLEX LNG Ltd. remains a Buy, supported by a modern fleet, robust balance sheet with no near-term maturity, and a 9.9% dividend yield. Guidance was raised by ~10% on revenue and ~11% on Adj. EBITDA, reflecting higher spot rates from geopolitical disruptions. FLNG's limited near-term spot exposure and high time charters warrant a long-term investment view despite current spot market strength.

prnewswire.com2026-06-03

TextNow Adds iHeartRadio to the Free Flex Plan -- Stream Music and Radio Without Paying for Data

iHeartRadio joins the growing roster of select apps included in TextNow's free data ecosystem WATERLOO, ON, June 3, 2026 /PRNewswire/ -- TextNow, the original app-based mobile phone service redefining how people stay connected, announced today that iHeartRadio will become a select app included in its Free Flex Plan, giving customers included 5G data access to stream music and live radio while on the go. The partnership marks TextNow's first major content integration and reflects the company's broader push to build a free content ecosystem into its wireless offering, giving customers a more flexible experience that aligns with how people actually use their phones today.

gurufocus.com2026-06-03

FLEX DCF Analysis: Intrinsic Value $67 vs Price $159

On June 03, 2026, we delve into the DCF analysis for Flex Ltd (FLEX), a company that has seen remarkable price performance over the past year. With a current pr

seekingalpha.com2026-06-03

Flex Ltd. (FLEX) Presents at Bank of America 2026 Global Technology Conference Transcript

Flex Ltd. (FLEX) Presents at Bank of America 2026 Global Technology Conference Transcript

zacks.com2026-06-02

Flex Upgrades AI Portfolio: Can it Capitalize on the Data Center Boom?

Flex unveiled AI data center power solutions at COMPUTEX 2026, including a 110 kW shelf for NVIDIA Vera Rubin systems and new power-management tech.

zacks.com2026-06-01

Flex (FLEX) Stock Jumps 4.1%: Will It Continue to Soar?

Flex (FLEX) saw its shares surge in the last session with trading volume being higher than average. The latest trend in earnings estimate revisions could translate into further price increase in the near term.

gurufocus.com2026-05-29

Flex Ltd (FLEX) Stock Up 4.2% but GF Value Says Overvalued -- GF Score: 82/100

On May 29, 2026, Flex Ltd (FLEX) shares rose 4.2% today, closing at $151.00. The stock has seen significant price movements recently, with a 52-week high of $15

fool.com2026-05-27

Small-Cap Value ETFs: SLYV Tops VBR in One Year Growth, VBR Offers Lower Fees

Expense ratios, diversification, and long-term returns set these two small-cap value ETFs apart-see how their strategies stack up for investors.

📊 AI Financial Analysis

Powered by StockMarketInfo
Earnings Data: Q Ending 2026-03-31

"FLEX reported Q4’26 (ended 2026-03-31) revenue of $7.48B and net income of $250M, translating to EPS of $0.67. Revenue rose to $7.48B from $7.06B in the prior quarter (QoQ +6.0%), and from $6.40B a year ago (YoY +16.9%). Net income increased modestly QoQ from $239M (QoQ +4.6%) and more strongly YoY from $222M (YoY +12.6%). Profitability improved: gross margin ticked up to 9.39% (from 9.71% in Q3 and 8.80% in Q4’25), while operating income increased to $499M and operating margin improved versus Q4’25 (6.67% vs 4.77%) but slipped versus Q3’26 (6.67% vs 5.67%—net effect positive over the year). Cash generation remained solid—operating cash flow was $413M and free cash flow $211M in the quarter. Free cash flow covered buybacks (repurchases of $200M) with no dividends paid. Balance sheet resilience is supported by $2.39B cash and cash equivalents and negative net debt (netDebt: -$1.82B). Total assets grew to $22.06B from $20.82B prior quarter. Shareholder returns: marketPerformance data is unavailable (price=0 and 1y_change undefined), so total shareholder return cannot be quantified from inputs. Valuation context relies on provided valuation multiples (P/E ~24.5), with consensus price target above current implied fair value (targetConsensus $145.17)."

Revenue Growth

Strong

Revenue increased QoQ from $7.06B to $7.48B (+6.0%) and YoY from $6.40B to $7.48B (+16.9%), indicating a strengthening top line.

Profitability

Positive

Net margin was broadly stable YoY (3.34% vs 3.47%) and improved operating income versus Q4’25 (operating margin 6.67% vs 4.77%), though gross margin was slightly lower QoQ.

Cash Flow Quality

Good

Operating cash flow of $413M and free cash flow of $211M in the quarter supported ongoing buybacks ($200M) with no dividends, suggesting good self-funding capacity.

Leverage & Balance Sheet

Good

Net debt is negative (netDebt: -$1.82B) with total assets rising to $22.06B; equity remains stable at ~$5.14B, indicating strong balance-sheet resilience.

Shareholder Returns

Caution

Buybacks continued (-$200M), but total shareholder return cannot be scored using price performance because marketPerformance inputs show price=0 and 1y_change is undefined; dividend yield is 0.

Analyst Sentiment & Valuation

Fair

Provided valuation multiples show P/E ~24.5 and P/S ~3.27; consensus target ($145.17) is above the provided price fair value estimate, but sentiment/price momentum cannot be confirmed from missing marketPerformance data.

Disclaimer:This analysis is AI-generated for informational purposes only. Accuracy is not guaranteed and this does not constitute financial advice.

Fundamentals Overview

Loading fundamentals overview...

Flex delivered record profitability in Q4 and a strong FY 2026 despite consumer weakness, highlighted by +50 bps Q4 gross and operating margin and +27% EPS growth. The key strategic move is a planned spin of Cloud and Power Infrastructure (CPI), expected to complete in calendar Q1 2027, aimed at capturing AI-driven power/thermal/compute integration demand. Management tied growth to multiyear hyperscaler/utility program wins, explicitly including Google, and reinforced this with the EP2 acquisition expanding utility-grade power capability. Numerically, CPI is guided to grow 65%–75% in FY 2027 and >80% in FY 2028, while Flex post-spin targets low to mid-single-digit growth. Margin volatility is acknowledged: CPI FY 2026 was down 100 bps from infrastructure and cloud ramp costs, but management expects full recoup in FY 2027 plus additional expansion in FY 2028. Overall tone is confident and execution-focused, with margin and CapEx normalization as the linchpins.

AI IconGrowth Catalysts

  • Targeted CPI revenue growth of 65% to 75% in FY 2027 and 80%+ in FY 2028, driven by AI data center architecture buildout and power/thermal/compute integration
  • Securement and scaling of foundational power + cooling infrastructure tied to multiyear hyperscaler and utility program wins (including Google), with bookings/backlog cited as capacity-constraining for the next couple of years
  • CPI power outpacing cloud (power growth exceeding cloud’s) as critical power architecture ramps
  • RMS upside from industrial and health care strength; automotive described as stabilizing

Business Development

  • Closed acquisition of EP2 (Electrical Power Products) to expand utility-grade, specification-driven power portfolio for grid modernization and electrification
  • Multiyear contract with Google; management also referenced additional hyperscalers plus neoclouds/colos/utility customers as part of the same CPI opportunity set

AI IconFinancial Highlights

  • Q4 revenue: $7.5B, up 17% YoY
  • Q4 adjusted gross margin: 9.9%, record level, +50 bps YoY
  • Q4 adjusted operating margin: 6.7%, +50 bps YoY; adjusted operating profit $500M
  • Q4 adjusted EPS: $0.93, up 27% YoY
  • FY 2026 revenue: $27.9B, up 8% YoY; consumer-related end markets described as persistently soft
  • FY 2026 adjusted gross margin: 9.5%, +70 bps YoY; adjusted operating margin: 6.3%, +70 bps YoY
  • FY 2026 CPI adjusted operating margin: 9.2%, -100 bps YoY due to incremental critical power infrastructure investments and cloud ramp costs; management expects recoupment of the full 100 bps in FY 2027 and +50 to +100 bps in FY 2028 as investments are grown into
  • CPI mix commentary: Q4 favorable power mix driver; cloud described as ramp cost drag
  • Guidance for FY 2027: adjusted operating margin 7.0% to 7.1% (+~80 bps), adjusted tax rate ~21%, adjusted EPS $4.21 to $4.51 (+32% at midpoint), and revenue $32.3B to $33.8B (+18% at midpoint)
  • Q1 guidance FY 2027: total Flex revenue up 14% at midpoint (RMS high single digits to low double digits; ITS high single digits to low double digits; CPI up 20% to 30%)

AI IconCapital Funding

  • Q4 repurchased $200M of stock (~3M shares)
  • Full-year repurchases: $944M (~19M shares)
  • FY 2026 free cash flow: ~$1.1B; Q4 free cash flow: $212M
  • FY 2026 net CapEx: $625M (~2.2% of revenue); Q4 net CapEx $201M
  • FY 2027 CapEx guidance: $1.4B to $1.6B; free cash flow conversion ~60% excluding spin transaction costs
  • FY 2027 CapEx normalization expectation: CapEx returns to historical levels in FY 2028; CPI CapEx ~2.5% to 3% of revenue and ITS/RMS below 2%

AI IconStrategy & Ops

  • Spin decision: Intent to spin Cloud and Power Infrastructure (SpinCo / CPI) into a new publicly traded company; expected completion in first quarter of calendar 2027 (management also referenced stand-alone financials to be provided until close)
  • Post-spin plan: Flex (RemainCo) targets low to mid-single-digit revenue growth; allocates capital to health care, robotics, warehouse automation, and networking tied to data center infrastructure growth
  • New reporting segmentation effective this quarter: Regulated Manufacturing Solutions (RMS), Integrated Technology Solutions (ITS), and Cloud and Power Infrastructure (CPI)
  • Technology/program emphasis: 400-volt DC and 800-volt DC power architecture; shift to unified power + thermal system engineering (grid to chip) rather than bolted-on subsystems
  • Operational efficiency theme: improved operational efficiency and product mix drove record operating margin in Q4

AI IconMarket Outlook

  • SpinCo (CPI) growth target: FY 2027 revenue growth 65% to 75%; FY 2028 further acceleration >80%
  • RemainCo (post-spin Flex) growth: low to mid-single-digit revenue growth in FY 2027 to FY 2028 window
  • CPI investment normalization: CPI CapEx approximately 2.5% to 3% of revenue in FY 2028; ITS and RMS below 2%
  • Backlog/capacity: management stated booked out in terms of capacity and backlog for the next couple of years to support CPI growth assumptions

AI IconRisks & Headwinds

  • CPI margin pressure in FY 2026: -100 bps due to incremental infrastructure investments and cloud ramp costs; risk that ramp/recoupment timing could shift (though management guided to recoup the full 100 bps in FY 2027)
  • Persistent softness in consumer-related end markets partially offset growth (FY 2026 revenue +8% despite consumer softness)
  • Second-half setup risk: Q1 and annual comparisons include strong comps in the second half; management characterized second-half outlook as relatively measured

Q&A: Analyst Interest

  • SpinCo rationale & risk balance: Management argued the AI data center power-architecture shift is a “one-time change” and cited Flex’s end-to-end portfolio (rack/pod integration, power/thermal architecture, utility/substation capability). They emphasized diversified customer sets (hyperscalers, colos/neoclouds, and utility customers), making stand-alone execution “no-brainer.”
  • Google-driven CPI growth attribution & diversification: Management said CPI acceleration is tied to Google and multiple hyperscalers plus neoclouds/colos; growth is “across all three end markets” (power, cooling, compute integration) and “well distributed” between power and cloud. They also cited capacity and backlog coverage for the next couple of years.
  • CPI margin structure and RemainCo margin progression: Management confirmed power margins remain higher than cloud in CPI, with FY 2027 ramp costs in cloud expected to digest through FY 2028. For Flex margins, Michael discussed continued margin room via productivity/AI-enabled cost improvements, noting early-year strength and lapping a very strong second-half comparable.

Sentiment: POSITIVE

Note: This summary was synthesized by AI from the FLEX Q4 2026 earnings transcript. Financial data is complex; please verify all metrics against official SEC filings before making investment decisions.

📋 Official Regulatory 10-K / 10-Q SEC Filings

Direct authenticated documentation links to audited SEC database reports for FLEX.

SEC EDGAR Live Feed
Loading financial data and tables...
📁

SEC Filings (FLEX)

© 2026 Stock Market Info — Flex Ltd. (FLEX) Financial Profile