📘 HONEYWELL INTERNATIONAL INC (HON) — Investment Overview
🧩 Business Model Overview
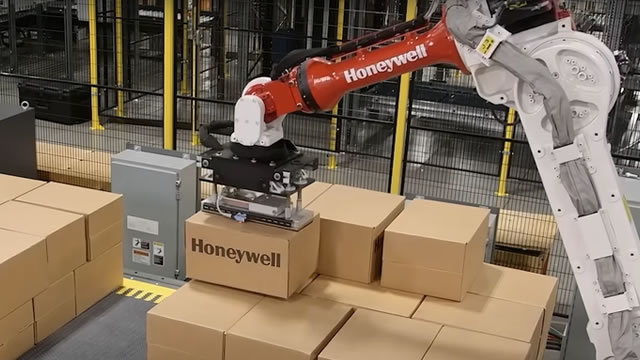
Honeywell is an industrial technology company that monetizes engineered products and mission-critical software/controls across three broad end-markets: Aerospace, Building Technologies, and Safety & Productivity Solutions. The value chain typically starts with design and qualification of components or control systems, followed by large-scale installation on aircraft fleets, commercial buildings, industrial sites, and operator platforms. Monetisation then shifts toward long-duration maintenance, upgrades, and productivity services tied to Honeywell’s installed base.
A defining feature of the model is “systems + lifecycle.” Revenue is generated not only from original equipment, but also from aftermarket service and recurring support that follow the equipment’s lifecycle—creating customer stickiness because operational disruption and certification/qualification requirements make replacements costly and slow.
💰 Revenue Streams & Monetisation Model
Honeywell’s revenue mix combines (1) engineered hardware and system sales with (2) aftermarket services and (3) recurring software/solutions revenues embedded in installed systems. The monetisation model is supported by:
- Aftermarket and service intensity: Repair, overhaul, and maintenance activities tend to be steadier than new-build cycles, as fleets and installed systems require ongoing compliance, refurbishment, and performance optimization.
- Recurring software/controls embedded in assets: Building and industrial solutions often scale via deployment of control platforms, analytics, and ongoing support rather than one-time hardware transactions.
- Margin structure driven by mix and services: Gross margin and operating margin typically benefit when the revenue mix tilts toward services, software, and higher-value upgrades versus purely transactional equipment sales.
Overall, Honeywell’s monetisation is less “pure component manufacturing” and more “lifecycle monetisation of installed systems,” which tends to support more resilient cash flow through varying end-market conditions.
🧠 Competitive Advantages & Market Positioning
Honeywell’s moat is primarily rooted in switching costs (qualification, interoperability, downtime risk), installed-base economics (service attached to previously delivered systems), and intangible barriers (engineering know-how, regulatory/standards compliance, and customer-specific integrations).
- Switching costs & lifecycle lock-in (Aerospace & Industrial): Once Honeywell components and control systems are integrated and validated, changing vendors can require re-certification, downtime, and redesign—favoring long-term relationships and service continuity.
- Installed base and services (recurring aftermarket): Revenue is supported by the installed base needing maintenance, spares, and upgrades, creating a structural tailwind when customer fleets/assets remain in service for long cycles.
- Engineering and qualification intensity: Many of Honeywell’s offerings must meet stringent safety, reliability, and performance standards, raising barriers to entry and slowing competitor substitution.
COMPETITIVE BENCHMARKING (selected peers)
- RTX (Raytheon Technologies) / Pratt & Whitney / Collins Aerospace vs. Honeywell in Aerospace: Both compete in aircraft systems and aftermarket capabilities. Honeywell’s positioning emphasizes integrated avionics/accessories, control solutions, and lifecycle service exposure, competing directly on reliability and installed-base support.
- Siemens vs. Honeywell in Building Technologies: Siemens is a major provider of building automation and industrial software/controls. Honeywell competes through control platforms, integration capabilities, and service partnerships that increase customer switching costs once systems are deployed.
- Johnson Controls vs. Honeywell in Building Technologies: Johnson Controls competes on building automation and energy management solutions. Honeywell’s edge typically depends on the depth of integration and the ability to monetize the installed base through upgrades and service rather than relying solely on new system installations.
In contrast to peers that may be more concentrated in single-product portfolios, Honeywell’s industry focus spans multiple “mission-critical layers” (controls, safety, lifecycle service), which supports cross-selling opportunities and reinforces retention.
🚀 Multi-Year Growth Drivers
- Aerospace aftermarket durability: Sustained demand for fleet maintenance, spares, and performance upgrades supports lifecycle monetisation as aircraft fleets remain in service and face continuing regulatory and safety requirements.
- Energy efficiency and grid/building modernization: Building automation, sensing, and controls remain a structural demand driver as owners target efficiency, comfort, and compliance with evolving building standards.
- Industrial safety and productivity: Demand for safety systems, monitoring, and operational optimization rises as industrial operators manage workforce safety, regulatory compliance, and productivity imperatives.
- Data-driven control and software enablement: Over a multi-year horizon, the transition from hardware-centric deployments to software-enabled control optimization increases the value of the installed base and can expand the share of recurring revenue.
Across the horizon, Honeywell’s TAM expansion is less about replacing entire installed systems and more about expanding the “serviceable installed base,” upgrading capabilities, and increasing software/solutions attachment rates.
⚠ Risk Factors to Monitor
- Cycle and mix risk: Industrial and aerospace new-build activity can be cyclical; while services help smooth volatility, prolonged weakness in new equipment can pressure order-driven revenue and near-term mix.
- Program concentration and customer spending timing: Aerospace and large industrial programs can lead to uneven demand patterns depending on airline, OEM, and capital allocation decisions.
- Technological substitution within controls: Competitors and platform shifts could alter integration requirements. Honeywell’s moat depends on maintaining qualification and interoperability advantages as platforms evolve.
- Execution and cost discipline: Large engineered systems can be exposed to supply chain complexity, manufacturing costs, and project execution risk—affecting margins if not managed consistently.
- Regulatory and safety compliance standards: While compliance requirements strengthen barriers, changing standards can raise costs and require redesign or certification activities.
📊 Valuation & Market View
Markets often value high-quality industrial technology franchises using a framework that blends earnings durability (especially services/aftermarket), free cash flow generation, and mid-cycle margin profile rather than relying exclusively on transaction-driven growth. Depending on the analyst’s emphasis, the valuation lens commonly includes EV/EBITDA and EV/FCF-style approaches, with supplementary focus on:
- Quality of revenue mix (services and recurring software/solutions typically support a higher multiple versus purely cyclical hardware exposure).
- Reinvestment needs (capex and working capital intensity influence free cash flow sustainability).
- End-market cycle assumptions for aerospace and construction/building modernization.
The key variables that tend to move valuation expectations are the sustainability of installed-base service growth, the pace of software/solutions attachment, and confidence in long-term margin discipline through product and service mix.
🔍 Investment Takeaway
Honeywell’s long-term investment appeal rests on a structural competitive position built around installed-base switching costs, lifecycle monetisation, and qualification-driven barriers across aerospace systems and building/industrial controls. The company is positioned to compound value by converting long-lived equipment fleets and assets into recurring service and software-linked revenue streams, while maintaining resilience through a mix that is less dependent on purely cyclical new-build demand.
⚠ AI-generated — informational only. Validate using filings before investing.