Ingersoll Rand Inc.

Ingersoll Rand Inc. (IR) Market Cap

Ingersoll Rand Inc. has a market capitalization of $28.27B.

Price: $72.25

0.24 (0.33%)

Market Cap: 28.27B

NYSE · time unavailable

CEO: Vicente Reynal

Sector: Industrials

Industry: Industrial - Machinery

IPO Date: 2017-05-12

Website: https://www.irco.com

Ingersoll Rand Inc. (IR) - Company Information

Market Cap: 28.27B|Sector: Industrials

Company Profile

Ingersoll Rand Inc. provides various mission-critical air, fluid, energy, specialty vehicle and medical technologies in the United States, Europe, the Middle East, Africa, and the Asia Pacific. It operates through two segments, Industrial Technologies and Services, and Precision and Science Technologies. The Industrial Technologies and Services segment designs, manufactures, markets, and services various air and gas compression, vacuum, and blower products; fluid transfer equipment and loading systems; and power tools and lifting equipment, including associated aftermarket parts, consumables, air treatment equipment, controls, other accessories, and services. The Precision and Science Technologies segment designs, manufactures, and markets a range of specialized positive displacement pumps, fluid management systems, accessories and aftermarket parts for liquid and gas dosing, transfer, dispensing, compression, sampling, pressure management and flow control in specialized or critical applications. The company's products are used in medical, laboratory, industrial manufacturing, water and wastewater, chemical processing, precision irrigation, energy, food and beverage, agriculture, and vacuum and automated liquid handling end-markets, as well as various manufacturing and industrial facilities applications. It sells through an integrated network of direct sales representatives and independent distributors under the Ingersoll Rand, Gardner Denver, Club Car, CompAir, Nash, Elmo Rietschle, Robuschi, Thomas, Milton Roy, Seepex, ARO, Emco Wheaton, Runtech Systems, Air Dimensions, Albin, Dosatron, Haskel, LMI, Maximus, MP, Oberdorfer, Welch, Williams, Zinnser Analytic, and YZ brands. The company was formerly known as Gardner Denver Holdings, Inc. and changed its name to Ingersoll Rand Inc. in March 2020. Ingersoll Rand Inc. was founded in 1859 and is headquartered in Davidson, North Carolina.

Analyst Sentiment

81%
Strong Buy

From 16 Active Polls

1Y Forecast: $93.67

▲ +29.6% Potential Upside

Consensus Target Metrics

Low Bound

$80

Median

$93

High Bound

$110

Average

$94

Price & Moving Averages

Loading chart...

🎯 Wall Street Analyst Intelligence Report

1-Year structural target targets, chart projections, and sentiment maps.

Average 1Y Target
$93.67
▲ +29.65% Upside
Low Target
$80.00
11% Risk
Median Target
$92.50
28% Mid
High Target
$110.00
52% Max
Consensus
Buy
8 / 15 Buys

Consensus Trend Projection

Trailing closures vs. 12-month metrics map.

Analyst Vote Distribution

Aggregate institutional coverage sentiment weights.

📊 Historical Valuation Multiples

Real-time Trailing Twelve Month (TTM) momentum side-by-side with discrete quarterly metrics.

Fiscal QuarterTTMQ1 2026Q4 2025Q3 2025Q2 2025Q1 2025Q4 2024Q3 2024Q2 2024
Period EndingTrailing 12MMar 31, 2026Dec 31, 2025Sep 30, 2025Jun 30, 2025Mar 31, 2025Dec 31, 2024Sep 30, 2024Jun 30, 2024
Market Cap ($M)28,27431,41031,13333,08933,31432,28436,49639,60836,129
Enterprise Value ($M)27,00130,13734,66936,76536,85035,50639,93443,07139,869
Price to Earnings Ratio (P/E)48.2540.8829.2533.89-72.2343.2839.7044.6848.82
Price/Earnings-to-Growth Ratio (PEG)4.209.53-7.2519.6514.486.03
Price to Sales Ratio (P/S)3.6317.0014.8916.9317.6518.8019.2221.2820.01
Price to Book Ratio (P/B)2.783.093.093.273.303.083.593.863.63
Price to Free Cash Flow Ratio (P/FCF)24.36192.2367.46101.66158.33144.9774.3591.32127.62
Enterprise Value to Sales (EV/Sales)16.3216.5818.8119.5220.6821.0323.1422.08
Enterprise Value to EBITDA (EV/EBITDA)16.3175.8764.4572.23174.4081.7578.2387.8898.74
Debt to Equity Ratio-0.770.000.470.480.480.460.490.470.48

IR Growth Runway Model

Standard long term linear growth fade

Multi-Stage Discounted Cash Flow Sandbox

Market Price$72.25
Intrinsic Value$74.95
Market Alignment
Undervalued by 3.7%relative to calculated intrinsic value
9.00%
Exp: 2%2%
i

Growth runway slowdown

This value provides a time window for the growth rate to decline beyond Stage 1 toward the terminal rate. Longer windows are most useful for companies with high growth starting conditions or strong competitive advantages. This option stretches out the growth rate slowdown across 5, 10, or 15-year steps. A high-growth starting condition (exceeding a 25% initial growth rate) automatically applies a curve decay to simulate realistic, rapid market saturation.
i

Terminal growth rate

With long-term inflation between 3-5%, revenue must grow by that baseline to maintain flat real-world market share. This value sets the permanent terminal growth rate to factor into the valuation beyond the growth slowdown runway toward maturity.

3-Stage Financial Runway Horizon

🧠 Perpetuity Horizon Engine (Stage 3: Post-2035)

Terminal FCF Base$2.30B
Perpetuity TV Value$43.22B
Discounted TV (PV)$18.26B
TV Weighting %58.5%
⚠️
Financial Model Disclaimer & Risk Disclosure: This interactive scenario simulator is an educational sandbox provided strictly for informational and analytical research purposes. Core historical financial statements and consensus estimates are sourced directly via Financial Modeling Prep (FMP). All downstream outputs are entirely deterministic, hypothetical projections generated by combining automated mathematical formulas (including linear interpolation and Gaussian bell-curve decay models) with user-selected variables and third-party financial data inputs. Users assume all liability for trading decisions executed based on these sandbox calculations.

📘 Full Research Report

ℹ️

AI-Generated Research: This report is for informational purposes only.

📘 INGERSOLL RAND INC (IR) — Investment Overview

🧩 Business Model Overview

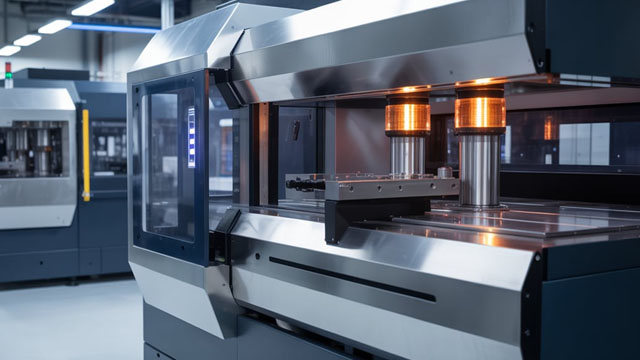
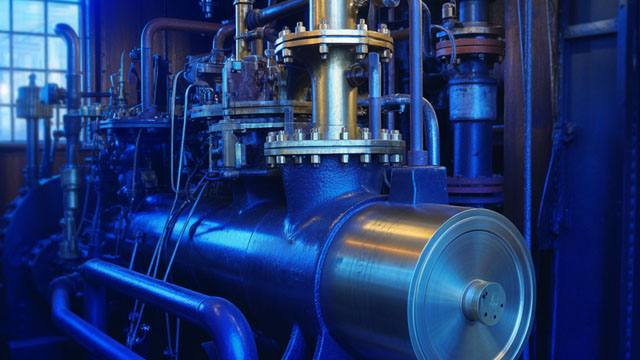
Ingersoll Rand operates in industrial equipment and mission-critical airflow/vacuum technologies—primarily compressed air, vacuum, and related industrial systems—alongside solutions for material handling and industrial tools. The economic “engine” is an installed base: equipment is sold into customer production environments, then supported over time through a dense aftermarket network of service, parts, and performance optimization.

Value creation flows through three steps: (1) engineering and selling core systems (compressors, vacuum equipment, and associated controls), (2) building long-lived customer relationships through installation and lifecycle support, and (3) monetizing ongoing demand for maintenance, repairs, upgrades, and optimized operating performance—typically at higher recurring margins than new equipment.

💰 Revenue Streams & Monetisation Model

Revenue is driven by a mix of equipment/contract sales and aftermarket (service and parts). The monetisation model is structured to convert an installed base into repeatable cash flows:

  • Aftermarket services and parts (recurring, higher visibility): maintenance cycles, wear components, overhaul services, and replacement parts tied to operating hours and production schedules.
  • Upgrades and system optimization: retrofit demand supported by efficiency standards, control upgrades, and productivity initiatives.
  • New equipment and system deliveries (more cyclical): driven by industrial capex, capacity expansion, and replacement of aging fleets.

Margin structure typically improves when the mix shifts toward services/parts and when customers select higher-value systems with integrated controls and lifecycle offerings. The key financial lever is maintaining service reach and parts availability while protecting margins through resilient supply chain and manufacturing discipline.

🧠 Competitive Advantages & Market Positioning

The primary moat is customer stickiness from installed-base switching costs plus aftermarket economics. Once compressed air or vacuum systems are installed, customers face meaningful friction in switching OEMs due to:

  • System integration and know-how: engineered layouts, controls, and site-specific operating parameters.
  • Parts compatibility and service tooling: established parts catalogs and service processes.
  • Lifecycle performance dependence: uptime and energy efficiency targets create incentives to remain with proven service partners.
  • Contractual and operational routines: service agreements and scheduled maintenance embedded in operations.

In compressed air/vacuum, these dynamics are durable even as end-markets fluctuate, because the aftermarket supports a baseline of demand.

Competitive benchmarking (primary competitors):

  • Atlas Copco — strong global position in compressors and compressed air solutions with broad service coverage. IR competes on diversification across industrial technologies and on service-led lifecycle monetisation.
  • Kaeser Kompressoren — reputational strength in compressed air systems with a focus on energy-efficient design. IR’s differentiation tends to show through broader application coverage (including vacuum and complementary industrial solutions) and service network breadth.
  • Gardner Denver / Doosan (process and industrial compressors) — competitive in compressor systems for industrial/process applications. IR’s positioning emphasizes tighter linkage between equipment, controls, and aftermarket services across multiple industrial segments.

Compared with these rivals, IR’s positioning is anchored in a diversified end-market footprint and a service-first strategy that leverages customer-installed base economics—reducing reliance on the most cyclical equipment segments alone.

🚀 Multi-Year Growth Drivers

Over a 5–10 year horizon, IR’s addressable demand is supported by multiple secular trends:

  • Industrial energy efficiency: compressed air and vacuum systems consume material electrical power. Customers pursue efficiency upgrades, leakage reduction, control optimization, and modernized equipment to cut total cost of ownership.
  • Electrification and reliability requirements: higher uptime expectations and tighter operating standards support ongoing service demand, spare parts consumption, and lifecycle maintenance.
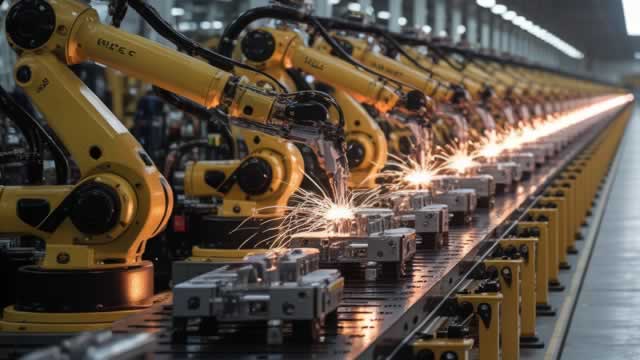
  • Process intensification in manufacturing: growth in end-markets such as chemicals, food & beverage, automotive supply chains, and general industrial production drives incremental equipment and system modernization.
  • Vacuum and advanced manufacturing demand: vacuum systems benefit from broader penetration of semiconductor-adjacent manufacturing and precision processes where equipment reliability is critical.
  • Aftermarket share expansion: as installed bases age and as customers increasingly value performance guarantees, service and parts tend to capture a larger portion of lifecycle spending.

The total opportunity compounds because aftermarket demand scales with the number of operating assets in the field, while efficiency retrofits and upgrades can generate incremental revenue even when new-build capex is subdued.

⚠ Risk Factors to Monitor

  • Industrial cycle exposure: equipment sales and project deliveries are sensitive to industrial capex cycles, particularly in construction, mining, and discretionary manufacturing investments.
  • Competitive intensity and pricing pressure: competitors can bid aggressively in equipment tenders, which may compress margins if service mix does not offset.
  • Execution risk in service delivery: service quality, parts availability, and field execution affect retention and aftermarket growth; operational disruption can harm customer loyalty.
  • Technological disruption: alternative architectures (e.g., different compressor technologies, control paradigms, and automation approaches) could shift specification preferences, impacting replacement cycles.
  • Input costs and supply chain constraints: industrial supply chains can affect lead times and cost structure for key components, influencing profitability.

📊 Valuation & Market View

Markets typically value industrial equipment and aftermarket-heavy models using EV/EBITDA and earnings power frameworks, with attention to:

  • Aftermarket margin durability: higher service mix generally supports more stable cash flows and a premium multiple relative to purely cyclical peers.
  • Free cash flow conversion: disciplined working capital and capex intensity can affect the equity’s perceived quality.
  • End-market visibility and order momentum: the balance between equipment volatility and service steadiness influences valuation stability.
  • Share repurchase capacity: leverage-neutral capital return policies can support earnings per share growth perceptions without relying solely on top-line expansion.

Multiple expansion tends to occur when service penetration rises, margins remain resilient through cycles, and cash conversion strengthens—while de-rating usually follows sustained weakness in equipment demand or deterioration in service economics.

🔍 Investment Takeaway

Ingersoll Rand presents a long-term investment profile built around installed-base switching costs and aftermarket monetisation in compressed air, vacuum, and related industrial technologies. The moat is operational and economic rather than purely branding-based: customers remain due to integration complexity, lifecycle performance dependence, and the economics of parts and service. Sustainable demand drivers—especially industrial efficiency and reliability—support multi-year growth even through equipment cycles, provided service execution and margins hold while competitive pricing remains controlled.


⚠ AI-generated — informational only. Validate using filings before investing.

📰 Market News & Coverage

15 Stories Available

Real-time institutional reporting and market updates for IR.

prismmediawire.com2026-05-29

PRISM MediaWire Ecosystem – Beyond the Wire. Into the Future

PRISM MediaWire modernizes corporate communication by combining Tier 1 disclosure, multimedia releases, social amplification, AI indexing, real-time notifications, and RSS syndication to help brands improve visibility, authority, and stakeholder reach across search, social, and conversational AI The Strategic Shift in Digital Distribution New York, May 29, 2026 – PRISM MediaWire (“PMW”) (Press Release Service –

businesswire.com2026-05-28

Ingersoll Rand to Participate in Upcoming Investor Conference

DAVIDSON, N.C.--(BUSINESS WIRE)--Ingersoll Rand Inc. (NYSE: IR), a global provider of mission-critical flow creation and life science and industrial solutions, announced that Vik Kini, chief financial officer, will participate in a fireside chat at the Wells Fargo 16th Annual Industrials & Materials Conference on Wednesday, June 10, at 3:15 p.m. ET. A real-time audio webcast of the fireside chat can be accessed via the Events and Presentations section of the Ingersoll Rand Investor Relation.

globenewswire.com2026-05-12

Ingersoll Rand and Garrett Motion Announce Strategic Partnership to Introduce a New Era for Oil Free Industrial Innovation

Ingersoll Rand and Garrett Motion enter a multiyear strategic partnership to advance next generation oil-free compressor technology for industrial air compression systems across key verticals, including food and beverage and life sciences Collaboration with Garrett Motion on advanced oil-free centrifugal compressor modules strengthens Ingersoll Rand's system-level compression leadership and capabilities, supporting the development of differentiated solutions that improve efficiency, reliability, and sustainability for customers Reinforces companies' commitment to sustainability and customer value creation through technologies designed to reduce energy consumption and improve operational efficiency across industrial processes DAVIDSON, N.C. and PLYMOUTH, Mich.

businesswire.com2026-05-12

Ingersoll Rand and Garrett Motion Announce Strategic Partnership to Introduce a New Era for Oil‑Free Industrial Innovation

DAVIDSON, N.C. & PLYMOUTH, Mich. & ROLLE, Switzerland--(BUSINESS WIRE)--Ingersoll Rand Inc. (NYSE: IR), a global provider of mission‑critical flow creation and industrial and life science solutions and Garrett Motion (Nasdaq: GTX), a global leader in differentiated turbocharging and electrification technologies for mobility and industrial applications, today announced a multiyear strategic partnership to develop next generation oil-free air technologies designed to deliver greater energy effici.

seekingalpha.com2026-05-07

Ingersoll Rand's Dip Doesn't Mean To Pile In

Ingersoll Rand (IR) remains a 'hold' as valuation remains elevated despite ongoing revenue and profit growth. 2026 guidance calls for 2.5%-4.5% revenue growth, with EBITDA expected between $2.13B and $2.19B. Acquisitions are a key growth lever, with recent deals and a robust acquisition pipeline set to add 4%-5% to annualized revenue.

businesswire.com2026-05-04

Ingersoll Rand Acquires Fox s.r.l., Expanding Metering and Dosing Capabilities

DAVIDSON, N.C.--(BUSINESS WIRE)--Ingersoll Rand Inc., (NYSE: IR) a global provider of mission-critical flow creation and life science and industrial solutions, has acquired Fox s.r.l. and XF s.r.l. (“Fox”), expanding the company's metering and dosing technologies portfolio. Based in Milan, Italy, Fox manufactures hydropneumatic accumulators, pulsation dampeners, calibration pots, and instrumentation to stabilize flow and pressure in dosing systems, protecting downstream equipment and improving.

zacks.com2026-04-30

TNC vs. IR: Which Stock Is the Better Value Option?

Investors interested in stocks from the Manufacturing - General Industrial sector have probably already heard of Tennant (TNC) and Ingersoll Rand (IR). But which of these two stocks is more attractive to value investors?

zacks.com2026-04-29

Ingersoll Rand's Q1 Earnings & Revenues Top Estimates, Up Y/Y

IR beats Q1 estimates on revenues and earnings, but organic sales and orders slip while margins contract despite segment growth.

seekingalpha.com2026-04-29

Ingersoll Rand Inc. (IR) Q1 2026 Earnings Call Transcript

Ingersoll Rand Inc. (IR) Q1 2026 Earnings Call Transcript

zacks.com2026-04-28

Ingersoll (IR) Q1 Earnings: How Key Metrics Compare to Wall Street Estimates

The headline numbers for Ingersoll (IR) give insight into how the company performed in the quarter ended March 2026, but it may be worthwhile to compare some of its key metrics to Wall Street estimates and the year-ago actuals.

zacks.com2026-04-28

Ingersoll Rand (IR) Surpasses Q1 Earnings and Revenue Estimates

Ingersoll Rand (IR) came out with quarterly earnings of $0.77 per share, beating the Zacks Consensus Estimate of $0.74 per share. This compares to earnings of $0.72 per share a year ago.

businesswire.com2026-04-28

Ingersoll Rand Reports First Quarter 2026 Results

DAVIDSON, N.C.--(BUSINESS WIRE)--Ingersoll Rand Inc. (NYSE: IR), a global provider of mission-critical flow creation and life science and industrial solutions, reported its results for the first quarter 2026. “We began 2026 with solid momentum, delivering high single-digit Adjusted EPS1 growth and meeting our expectations for revenue and Adjusted EBITDA1,” said Vicente Reynal, chairman and chief executive officer of Ingersoll Rand. “With a robust M&A pipeline, we remain confident in reachin.

zacks.com2026-04-27

Ingersoll Rand Gears Up to Report Q1 Earnings: What's in the Offing?

IR heads into Q1 results with modest growth expected, supported by acquisitions and segment strength, but rising costs and FX headwinds may pressure margins.

businesswire.com2026-04-23

Ingersoll Rand Declares Regular Quarterly Cash Dividend

DAVIDSON, N.C.--(BUSINESS WIRE)--The Board of Directors of Ingersoll Rand Inc. (NYSE: IR), a global provider of mission-critical flow creation and life science and industrial solutions, declared today a regular quarterly cash dividend of $0.02 (two cents) per share of common stock payable on June 4, 2026, to stockholders of record on May 14, 2026. About Ingersoll Rand Inc. Ingersoll Rand Inc. (NYSE:IR), driven by an entrepreneurial spirit and ownership mindset, is dedicated to Making Life Bette.

zacks.com2026-04-21

Ingersoll Rand (IR) Earnings Expected to Grow: Should You Buy?

Ingersoll (IR) doesn't possess the right combination of the two key ingredients for a likely earnings beat in its upcoming report. Get prepared with the key expectations.

📊 AI Financial Analysis

Powered by StockMarketInfo
Earnings Data: Q Ending 2026-03-31

"Headline (2026-03-31, Q1): Revenue $1.85B, Net Income $192.1M, EPS $0.49. QoQ: Revenue rose to $1.85B from $2.09B in Q4 (down -11.7% QoQ). Net Income declined to $192.1M from $266.1M (down -27.8% QoQ). Profitability also softened: net margin eased to 10.4% from 12.7% in Q4, while operating income margin fell to 15.7% from 31.7%. YoY: Revenue increased to $1.85B from $1.72B in Q1 last year (up +7.6% YoY). Net Income rose to $192.1M from $186.5M (up +2.9% YoY). Despite revenue growth, earnings growth lagged, implying cost/other-income headwinds and margin normalization versus the prior year quarter (net margin 10.4% vs 10.9% YoY). Cash flow: Operating cash flow was $199.7M in Q1 and free cash flow was $163.4M, supporting continued shareholder distributions; dividends paid were $7.8M and buybacks were $89.5M (FCF coverage appears reasonable on a quarterly basis). Balance sheet: Net debt is strongly negative (net cash) at about -$1.27B, with total assets ~$18.2B and equity ~$10.2B, indicating resilience and balance-sheet flexibility. Total shareholder returns: With a 1y price change of +20.24%, capital appreciation is strong; dividend yield is minimal (~0.03%), and buybacks contribute meaningfully. Valuation/targets: Consensus price target of ~$106.5 vs $85.8 current implies upside, supporting sentiment."

Revenue Growth

Positive

Revenue was up +7.6% YoY ($1.72B to $1.85B) but down -11.7% QoQ ($2.09B to $1.85B), suggesting seasonality/near-term deceleration.

Profitability

Neutral

Net income rose only +2.9% YoY ($186.5M to $192.1M), while net margin slipped to 10.4% vs 10.9% YoY and fell sharply QoQ (12.7% in Q4 to 10.4% in Q1).

Cash Flow Quality

Positive

Q1 operating cash flow was $199.7M and free cash flow $163.4M, supporting dividends ($7.8M) and buybacks ($89.5M). Cash generation remains positive despite earnings volatility.

Leverage & Balance Sheet

Good

Balance sheet is very strong for a non-bank: net debt is about -$1.27B (net cash). Equity is stable at ~$10.2B and total assets are steady around ~$18.2B.

Shareholder Returns

Good

1y price gain of +20.24% provides strong capital appreciation (>20% momentum). Dividend yield is small (~0.03%), but buybacks are active (Q1 repurchases $89.5M).

Analyst Sentiment & Valuation

Positive

Consensus target ~$106.5 vs $85.8 current suggests upside. With strong balance-sheet capacity, valuation is supported, though near-term margin softness tempers optimism.

Disclaimer:This analysis is AI-generated for informational purposes only. Accuracy is not guaranteed and this does not constitute financial advice.

Fundamentals Overview

Loading fundamentals overview...

IR started 2026 with Q1 orders +5% YoY and adjusted EPS $0.77 (+7%), but margins compressed: adjusted EBITDA margin 25.4% (tariff dilution, organic volume flow-through, and strategic investment). A ~$40M long-cycle order delay tied to Middle East conflict was framed as transitory; management expects recovery through 2026 with ~1/3 already booked in April and no current cancellation risk to full-year revenue/EBITDA. The main setup is demand stabilization in short-cycle activity: U.S. compressor activity stabilized, core tool business grows mid-single digits, and PST margins improved sharply (+120 bps YoY). Management reaffirmed full-year guidance (revenue +2.5% to +4.5%; adjusted EPS $3.45–$3.57; EBITDA $2.13B–$2.19B) and reiterated no net tariff/inflation impact. In Q&A, key focus was (1) transitory timing vs durable demand, (2) tariff component net neutrality, and (3) ITS margin bridge back-weighted into the second half.

AI IconGrowth Catalysts

  • Carbon capture win: selected to provide a combined vacuum and blower application for innovative gas separation technology (early-stage but showing positive integration outcomes).
  • Life Science orders up double digits in Q1; Precision Technology short-cycle book/ship organically grew, supporting second-half setup.
  • Blower and banking business continues to perform well (up year-over-year).

Business Development

  • Fox s.r.l. acquisition signed; expected close end of April 2026. Adds hydropneumatic accumulators and position dampners to absorb pressure pulses, reducing downtime/maintenance for customers.
  • Carbon capture customer selection (innovative gas separation process) involving combined vacuum + blower application.
  • Life Science win: integrated bulk powder system solutions with ILC Dover and IR Elmorishli vacuum pumps for a leading pharmaceutical manufacturer.

AI IconFinancial Highlights

  • Orders +5% YoY; book-to-bill 1.07x (consistent with normal seasonality). Delay ~ $40M orders tied to long-cycle projects; driven primarily by Middle East conflict; management expects recovery in 2H 2026 with ~1/3 recovered in April.
  • Total revenue +8% YoY; adjusted EBITDA $469M; adjusted EBITDA margin 25.4% (year-over-year margin pressure from organic volume declines flow-through, tariff dilution, and strategic investments).
  • Q1 adjusted tax rate 19.8%; adjusted EPS $0.77, up 7% YoY.
  • Q1 free cash flow $163M (in line with expectations; normal working capital seasonality).
  • PST segment: adjusted EBITDA $122M, up 15% YoY; margins +120 bps YoY.
  • ITS segment: adjusted EBITDA margin 26.7% (down YoY; flow-through on organic volume declines, tariff dilution, continued commercial investment).
  • Full-year guidance reaffirmed: revenue +2.5% to +4.5%; total adjusted EBITDA $2.13B to $2.19B; adjusted EPS $3.45 to $3.57 (midpoint ~5% growth); adjusted tax rate ~23%; FCF conversion to adjusted net income ~95%.
  • Guidance includes “no net tariff and inflation impact” expected to full-year results, despite ongoing tariff monitoring (including Section 232 changes).

AI IconCapital Funding

  • Liquidity: nearly $4B total liquidity.
  • Leverage well below 2x, maintaining flexibility for capital deployment through 2026.
  • No specific buyback dollar amount disclosed in transcript; capital allocation prioritizes M&A alongside share repurchases and quarterly dividends.

AI IconStrategy & Ops

  • M&A pipeline robust: >200 companies in funnel; 10 LOI-stage deals; >90% of opportunities internally sourced.
  • Expected 400 to 500 bps of annualized inorganic revenue to be acquired in 2026 (plus additional deals expected to close later in 2026).
  • IRX positioned as differentiator enabling agile operational execution, disciplined pricing, and capital allocation.
  • Tariff mitigation actions active; management indicates mitigation rate currently net neutral versus full-year effects.

AI IconMarket Outlook

  • Organic revenue: full-year organic growth expected ~1% at midpoint; second-half implied low single-digit organic growth (cadence unchanged from original guidance).
  • Q2 expectations: sequential margin improvement from Q1 to Q2, but Q2 margins still expected down YoY by ~50 to 100 bps (primarily ITS).
  • Q2 revenue: organic flattish to slightly up YoY; overall phasing assumptions unchanged: first half EBITDA 45.5% to 46% range; second half the balance.
  • Order recovery: Middle East long-cycle order delays expected to be recovered through 2026; ~1/3 already booked in April; no expected cancellation impacts on full-year revenue or adjusted EBITDA.

AI IconRisks & Headwinds

  • Tariff and inflation dynamics: year-over-year margin pressure from tariff dilution and strategic investments; management expects mitigation to be net neutral for full-year (but continued uncertainty remains).
  • Long-cycle order timing elongation: customers (ITCs) taking longer to finalize decisions; delayed orders ~ $40M linked to long-cycle projects.
  • Middle East conflict: delayed long-cycle projects (transitory, mainly contained regionally); requires successful recovery to avoid backlog slippage.
  • ITS margin pressure history: margins down for multiple quarters YoY; sensitivity to tariff/pricing flow-through timing and volume recovery.

Q&A: Analyst Interest

  • Topic: Short-cycle vs long-cycle demand and guidance cadence—Management explained U.S. short-cycle stabilization (U.S. compressor activity stabilized) and mid-single-digit core tool organic growth, while long-cycle funnel remained stable but elongated decision-making. They reaffirmed full-year organic cadence unchanged: ~1% organic at midpoint with second-half low single-digit growth and recovery of Middle East delays without full-year impact.
  • Topic: Tariff mechanics clarity (Section 232 vs “AIFA”) and net impact—Management stated they have worked through new tariff components and that moving factors (tariff changes, disinflation, proactive mitigation) net to relatively neutral full-year effects. They acknowledged ongoing monitoring and uncertainty for the remainder of the year based on evolving announced changes.
  • Topic: ITS margin bridge into Q2 and back half (pricing, flow-through, restructuring, materials)—Management guided Q2 margins down YoY by ~50–100 bps from ITS, but expected sequential improvement Q1→Q2. Drivers cited: improved organic volumes in 2H (with better flow-through), tariff-related pricing mostly taken through 2025 with incremental 2026 in-year actions ahead, restructuring benefits emerging more in 2H, and seasonally stronger back-half material procurement benefits.

Sentiment: MIXED

Note: This summary was synthesized by AI from the IR Q1 2026 earnings transcript. Financial data is complex; please verify all metrics against official SEC filings before making investment decisions.

📋 Official Regulatory 10-K / 10-Q SEC Filings

Direct authenticated documentation links to audited SEC database reports for IR.

SEC EDGAR Live Feed
Loading financial data and tables...
📁

SEC Filings (IR)

© 2026 Stock Market Info — Ingersoll Rand Inc. (IR) Financial Profile