JBT Marel Corporation

JBT Marel Corporation (JBTM) Market Cap

JBT Marel Corporation has a market capitalization of $6.46B.

Price: $124.00

-1.21 (-0.97%)

Market Cap: 6.46B

NYSE · time unavailable

CEO: Brian A. Deck

Sector: Industrials

Industry: Industrial - Machinery

IPO Date: 2008-07-22

Website: https://www.jbtc.com

JBT Marel Corporation (JBTM) - Company Information

Market Cap: 6.46B|Sector: Industrials

Company Profile

JBT Marel Corporation provides technology solutions to food and beverage industry in North America, Europe, the Middle East, Africa, the Asia Pacific, and Latin America. It offers value-added processing that includes chilling, mixing/grinding, injecting, blending, marinating, tumbling, flattening, forming, portioning, coating, cooking, frying, freezing, extracting, pasteurizing, sterilizing, concentrating, high pressure processing, weighing, inspecting, filling, closing, sealing, end of line material handling, and packaging solutions to the food, beverage, and health market. In addition, it offers automated guided vehicle systems for material movement in the manufacturing, warehouse, and medical facilities. It serves baby food, bakery and confectionery, citrus processing, fruits and nuts, juices, non-food, pet food, pharmaceutical, plant- based beverages and protein, poultry, meat, and seafood, ready meals, oils, soups, sauces, seasoning and dressings, automotive, building material, tissue, paper, and packaging, hospitals, pharma and life sciences, fast moving consumer goods, manufacturing, warehousing, and other industries. The company markets and sells its products and solutions through direct sales force, independent distributors, sales representatives, and technical service teams. The company was formerly known as John Bean Technologies Corporation and changed its name to JBT Marel Corporation in January 2025. JBT Marel Corporation was incorporated in 1994 and is headquartered in Chicago, Illinois.

Analyst Sentiment

82%
Strong Buy

From 6 Active Polls

1Y Forecast: $173.33

▲ +39.8% Potential Upside

Consensus Target Metrics

Low Bound

$165

Median

$175

High Bound

$180

Average

$173

Price & Moving Averages

Loading chart...

🎯 Wall Street Analyst Intelligence Report

1-Year structural target targets, chart projections, and sentiment maps.

Average 1Y Target
$173.33
▲ +39.78% Upside
Low Target
$165.00
33% Risk
Median Target
$175.00
41% Mid
High Target
$180.00
45% Max
Consensus
Buy
2 / 2 Buys

Consensus Trend Projection

Trailing closures vs. 12-month metrics map.

Analyst Vote Distribution

Aggregate institutional coverage sentiment weights.

📊 Historical Valuation Multiples

Real-time Trailing Twelve Month (TTM) momentum side-by-side with discrete quarterly metrics.

Fiscal QuarterTTMQ1 2026Q4 2025Q3 2025Q2 2025Q1 2025Q4 2024Q3 2024Q2 2024
Period EndingTrailing 12MMar 31, 2026Dec 31, 2025Sep 30, 2025Jun 30, 2025Mar 31, 2025Dec 31, 2024Sep 30, 2024Jun 30, 2024
Market Cap ($M)6,4566,6757,8357,2426,2666,3184,0673,1522,892
Enterprise Value ($M)8,0698,2889,5309,0348,0758,2044,0913,2663,065
Price to Earnings Ratio (P/E)38.6437.0836.8927.43460.70-9.13-145.2620.2623.55
Price/Earnings-to-Growth Ratio (PEG)55.133.8648.76-0.11-47.771.589.24
Price to Sales Ratio (P/S)1.667.137.777.236.707.408.706.957.19
Price to Book Ratio (P/B)1.441.491.761.641.431.542.631.991.90
Price to Free Cash Flow Ratio (P/FCF)20.3971.7793.83128.1874.86438.7334.2149.96258.17
Enterprise Value to Sales (EV/Sales)8.859.459.028.649.618.757.207.62
Enterprise Value to EBITDA (EV/EBITDA)14.5660.9472.4256.2564.14-70.60197.6344.2057.07
Debt to Equity Ratio2.910.410.420.430.440.480.810.410.43

JBTM Growth Runway Model

🟢 Initial high growth rate - forecast is based on a long term bell curve % growth rate

Multi-Stage Discounted Cash Flow Sandbox

Market Price$124.00
Intrinsic Value$139.58
Market Alignment
Undervalued by 12.6%relative to calculated intrinsic value
9.00%
Exp: 30%30%
i

Growth runway slowdown

This value provides a time window for the growth rate to decline beyond Stage 1 toward the terminal rate. Longer windows are most useful for companies with high growth starting conditions or strong competitive advantages. This option stretches out the growth rate slowdown across 5, 10, or 15-year steps. A high-growth starting condition (exceeding a 25% initial growth rate) automatically applies a curve decay to simulate realistic, rapid market saturation.
i

Terminal growth rate

With long-term inflation between 3-5%, revenue must grow by that baseline to maintain flat real-world market share. This value sets the permanent terminal growth rate to factor into the valuation beyond the growth slowdown runway toward maturity.

3-Stage Financial Runway Horizon

🧠 Perpetuity Horizon Engine (Stage 3: Post-2035)

Terminal FCF Base$0.79B
Perpetuity TV Value$14.95B
Discounted TV (PV)$6.31B
TV Weighting %69.4%
⚠️
Financial Model Disclaimer & Risk Disclosure: This interactive scenario simulator is an educational sandbox provided strictly for informational and analytical research purposes. Core historical financial statements and consensus estimates are sourced directly via Financial Modeling Prep (FMP). All downstream outputs are entirely deterministic, hypothetical projections generated by combining automated mathematical formulas (including linear interpolation and Gaussian bell-curve decay models) with user-selected variables and third-party financial data inputs. Users assume all liability for trading decisions executed based on these sandbox calculations.

📘 Full Research Report

ℹ️

AI-Generated Research: This report is for informational purposes only.

📘 JBT MAREL CORP (JBTM) — Investment Overview

🧩 Business Model Overview

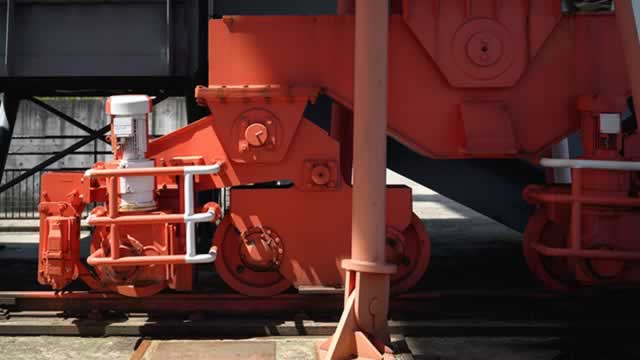
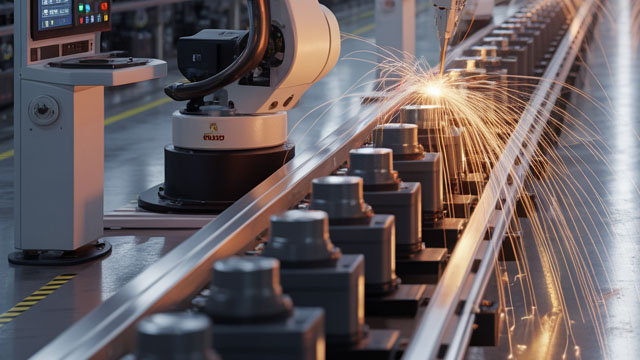
JBT MAREL CORP builds automated, integrated equipment and digital solutions for food producers, spanning processing, handling, and packaging/finishing lines. The business typically sells large capital projects (new lines and plant expansions) and then monetizes the installed base through a recurring aftermarket—spare parts, upgrades, service contracts, and performance support.

Operationally, customers purchase systems designed to improve throughput, consistency, food safety, and yield. Once a line is installed, the equipment becomes embedded in production workflows (conveyance, sorting, weighing, portioning, inspection, and line control), which raises customer stickiness and supports long-term service demand.

💰 Revenue Streams & Monetisation Model

Revenue is generally composed of:

  • System sales (project/transactional): equipment packages for new plants and modernization programs. These drive revenue variability but can include multi-component solutions across the processing value chain.
  • Aftermarket services (recurring): parts, maintenance, calibration, automation upgrades, and installed-base support. This segment typically stabilizes cash flows and improves predictability of earnings.
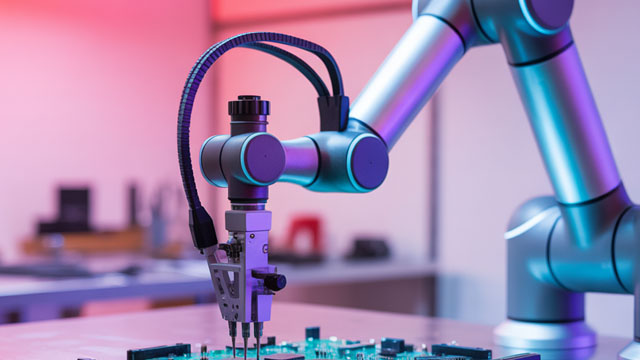
  • Digital and automation enablement (embedded/ancillary): line control software, inspection/vision-based quality tools, and production optimization capabilities that often expand over time as customers refine recipes and operating parameters.

Margin structure usually benefits from a higher proportion of service and long-duration contracts, plus the defensibility of customer-specific know-how embedded in automation workflows. Over time, the installed base increases the economics of servicing a customer’s line rather than selling new equipment each cycle.

🧠 Competitive Advantages & Market Positioning

JBT MAREL CORP’s moat is strongest in switching costs and intangible know-how, supported by process integration and a deep installed base. Competitors can often supply individual machines, but the cost and time to replace an entire production workflow (hardware interfaces, software logic, data capture, hygiene requirements, and production recipes) is high.

  • Switching costs / line integration: Systems are deployed as end-to-end production lines with defined interfaces to conveyance, sensors/inspection, and controls. Re-platforming entails engineering downtime, validation, and retraining of operating practices.
  • Installed-base lock-in: Ongoing spares, calibration, and upgrades create continuity. Customers standardize around vendors who can reliably maintain uptime and performance targets.
  • Intangible assets: Application engineering, product-specific processing expertise, and quality/inspection algorithms represent hard-to-transfer know-how.

Competitive benchmarking (primary public comparables):

  • GEA — broader industrial food processing equipment portfolio; often competes project-by-project across dairy, meat, and processing systems.
  • Tomra — strong in sensor-based sorting/inspection and resource efficiency; competes where optical/quality inspection is the dominant purchase decision.
  • Multivac — strong in packaging solutions and higher-end automation around packaging lines.

Positioning contrast: JBT MAREL CORP emphasizes integrated processing and automation workflows, combining equipment depth with installed-base service and production optimization. This differentiates the go-to-market versus vendors that are more concentrated in a single step (inspection-only, packaging-only) or require greater customer engineering integration across multiple suppliers.

🚀 Multi-Year Growth Drivers

A 5–10 year outlook is supported by structural demand for higher-efficiency, higher-compliance food production:

  • Automation and labor constraints: Growing need for throughput, reduced manual handling, and consistent operations supports continued plant modernization.
  • Food safety and quality compliance: Regulatory and customer standards drive investment in inspection, traceability, sanitation-friendly design, and validated process control.
  • Yield optimization and cost per unit: High-sensitivity weighing/sorting/portioning and quality grading reduce waste and improve product consistency, which supports adoption even when end-market demand is stable.
  • Digital production optimization: More connected lines enable performance monitoring, recipe management, and continuous improvement—expanding the value of the installed base over time.
  • Global capacity expansion: Growth in protein consumption and food processing capacity in developing regions supports TAM expansion for new lines and upgrades.

⚠ Risk Factors to Monitor

  • Customer capex cyclicality: Food processing equipment is tied to plant build-out and modernization cycles; prolonged delays can pressure system orders.
  • Integration and execution risk: Any consolidation of product portfolios and platforms depends on engineering execution, manufacturing ramp discipline, and service transition quality.
  • Technological disruption in inspection/automation: Advances in computer vision, sensing, and controls can render older architectures less competitive; ongoing R&D and software sustainment are necessary.
  • Cybersecurity and data integrity: Connected production systems increase exposure to cyber risk and operational data integrity issues.
  • Service competitiveness and supply chain resilience: Aftermarket margins depend on parts availability, service response quality, and supply chain reliability.

📊 Valuation & Market View

Equity markets typically value food automation and industrial processing companies using a blend of EV/EBITDA and earnings-based multiples, with emphasis on:

  • Aftermarket mix and durability: A higher share of services/recurring revenue supports valuation resilience through the cycle.
  • Operating leverage: Margin quality improves when service growth outpaces project variability.
  • Order visibility and backlog quality: Sustainable demand indicators matter more than short-term fluctuations.
  • Return on deployed assets: Systems that deliver measurable yield and compliance improvements tend to support sustained customer spending.

The market typically re-rates such businesses when investors gain confidence in service growth, sustained conversion of installed base to upgrades, and disciplined execution that protects margins.

🔍 Investment Takeaway

JBT MAREL CORP’s long-term investment case rests on durable switching costs from integrated processing lines, an installed-base service engine, and defensible application know-how in automation and quality assurance. The company is positioned to benefit from ongoing industrial imperatives—automation, food safety, and yield optimization—while maintaining a structure that can stabilize earnings through recurring aftermarket activity even when project cycles fluctuate.


⚠ AI-generated — informational only. Validate using filings before investing.

📰 Market News & Coverage

15 Stories Available

Real-time institutional reporting and market updates for JBTM.

businesswire.com2026-05-14

CORRECTING and REPLACING JBT Marel Corporation Declares Quarterly Dividend and Announces Share Repurchase Program

CHICAGO--(BUSINESS WIRE)--The correction relates to the effective date of the share repurchase plan, which was changed from June 1, 2026, to May 18, 2026. The updated release reads: JBT MAREL CORPORATION DECLARES QUARTERLY DIVIDEND AND ANNOUNCES SHARE REPURCHASE PROGRAM JBT Marel Corporation (NYSE and Nasdaq Iceland: JBTM) announced today that its Board of Directors declared a quarterly cash dividend of $0.10 per share of outstanding common stock. The dividend will be payable on June 9, 2026, t.

businesswire.com2026-05-14

JBT Marel Corporation Declares Quarterly Dividend and Announces Share Repurchase Program

CHICAGO--(BUSINESS WIRE)--JBT Marel Corporation (NYSE and Nasdaq Iceland: JBTM) announced today that its Board of Directors declared a quarterly cash dividend of $0.10 per share of outstanding common stock. The dividend will be payable on June 9, 2026, to stockholders of record at the close of business on May 26, 2026. The Board of Directors also authorized a new share repurchase plan of up to $200 million of the Company's common stock, effective June 1, 2026, through May 31, 2029. The manner,.

marketbeat.com2026-05-11

JBT Marel Q1 Earnings Call Highlights

JBT Marel NYSE: JBTM reported a solid start to 2026, with first-quarter orders exceeding $1 billion for the second consecutive quarter and management reaffirming its full-year earnings guidance.

zacks.com2026-05-07

3 Reasons Growth Investors Will Love JBT (JBTM)

JBT (JBTM) possesses solid growth attributes, which could help it handily outperform the market.

zacks.com2026-05-07

JBT (JBTM) Upgraded to Buy: Here's What You Should Know

JBT (JBTM) might move higher on growing optimism about its earnings prospects, which is reflected by its upgrade to a Zacks Rank #2 (Buy).

zacks.com2026-05-07

JBTM or TT: Which Is the Better Value Stock Right Now?

Investors looking for stocks in the Technology Services sector might want to consider either JBT Marel (JBTM) or Trane Technologies (TT). But which of these two stocks is more attractive to value investors?

zacks.com2026-05-07

Wall Street Analysts Think JBT (JBTM) Could Surge 31.85%: Read This Before Placing a Bet

The consensus price target hints at a 31.9% upside potential for JBT (JBTM). While empirical research shows that this sought-after metric is hardly effective, an upward trend in earnings estimate revisions could mean that the stock will witness an upside in the near term.

businesswire.com2026-05-07

JBT Marel Makes Landmark Foodservice Debut at the 2026 National Restaurant Association Show

CHICAGO--(BUSINESS WIRE)--JBT Marel, the global technology leader responsible for processing over 75% of the world's citrus juice, is making its debut at the 2026 National Restaurant Association (NRA) Show from May 16-19. The centerpiece of this landmark debut is the Fresh'n Squeeze® 1800 Citrus Juicer, a recipient of the prestigious 2026 Kitchen Innovation Awards, showcasing how industrial-grade extraction technology has been reengineered for modern foodservice operators. The company's strateg.

seekingalpha.com2026-05-07

Artisan Small Cap Fund Q1 2026 Portfolio Activity

During the quarter, we initiated new Garden positions in Onto Innovation, Baldwin Group and Freshpet. In addition to Compass, we added to our positions in Ollie's Bargain Outlet and Flowserve during the quarter. We ended our investment campaigns in Penumbra, JBT Marel and Parsons during the quarter.

seekingalpha.com2026-05-05

JBT Marel Corporation (JBTM) Q1 2026 Earnings Call Transcript

JBT Marel Corporation (JBTM) Q1 2026 Earnings Call Transcript

zacks.com2026-05-04

JBT Marel (JBTM) Q1 Earnings and Revenues Surpass Estimates

JBT Marel (JBTM) came out with quarterly earnings of $1.58 per share, beating the Zacks Consensus Estimate of $1.49 per share. This compares to earnings of $0.97 per share a year ago.

businesswire.com2026-05-04

JBT Marel Corporation Reports First Quarter 2026 Results and Reiterates Full Year 2026 Guidance

CHICAGO--(BUSINESS WIRE)--JBT Marel Corporation (NYSE and Nasdaq Iceland: JBTM), a leading global technology solutions provider to high-value segments of the food & beverage industry, today reported financial results for the first quarter of 2026. "We started 2026 on a positive note, marking the second consecutive quarter with inbound orders above $1 billion," said Brian Deck, Chief Executive Officer. "Our orders reflected strong demand across our Prepared Food and Beverage Solutions and Pr.

zacks.com2026-04-27

JBT Marel (JBTM) Earnings Expected to Grow: Should You Buy?

JBT (JBTM) possesses the right combination of the two key ingredients for a likely earnings beat in its upcoming report. Get prepared with the key expectations.

seekingalpha.com2026-04-26

JBT Marel's Growth Plans Justify An Upgrade

JBT Marel Corporation is upgraded from 'hold' to a soft 'buy' based on ambitious growth and cost-saving targets. JBTM expects organic revenue growth of 5–7% annually through 2028, targeting $4.52 billion in sales and 20% EBITDA margins. Management projects $150 million in annual cost savings by the end of next year, with additional revenue and operational synergies supporting margin expansion.

businesswire.com2026-04-21

Wenger and Extru-Tech Unite Under JBT Marel at Petfood Forum 2026

KANSAS CITY, Mo.--(BUSINESS WIRE)--Wenger and Extru-Tech, both global leaders in pet and human food extrusion processing solutions, will exhibit at Petfood Forum in Kansas City on April 27-29, 2026, at Booth #1614. This marks the first time both brands will come together in one booth for the industry's largest gathering of pet food professionals in North America. This union marks a new chapter as these trusted brands unite under JBT Marel to drive greater innovation and expand product offerings.

📊 AI Financial Analysis

Powered by StockMarketInfo
Earnings Data: Q Ending 2026-03-31

"JBTM reported Q1’26 revenue of $936M and net income of $45M (EPS $0.86). On a YoY basis, revenue declined from $854.1M in Q1’25 (-9.0%), while net income improved sharply from a net loss of -$173M (+125.9% toward profitability). QoQ, revenue fell from $1,008M in Q4’25 (-7.1%), but net income rose from $53.1M in Q4’25 to $45M (down -15.2% QoQ). Profitability improved meaningfully versus the prior year: net margin increased to 4.8% from -20.3% (Q1’25), and operating margin was 7.3% (vs -3.9% in Q1’25), supported by a higher gross margin (35.1% vs 34.2%). Cash flow quality looks solid in the latest quarter: operating cash flow was $119M and free cash flow $93M, with dividends of $5M (payout ratio ~11%). Balance sheet remains net debt heavy but stable in relative terms: total assets were $8.16B and equity $4.48B; net debt was about $200M, with short-term debt at $411M and no long-term debt reported in Q1’26. Shareholder returns are supported by strong price momentum: the stock is up 38.7% over the last year. Valuation multiples appear elevated (e.g., P/E ~37), but the stock’s rally and improved earnings power help offset near-term valuation risk."

Revenue Growth

Caution

Revenue was $936M in Q1’26 vs $1,008M in Q4’25 (-7.1% QoQ) and $854.1M in Q1’25 (-9.0% YoY), indicating a year-over-year decline despite a relatively stable gross margin profile.

Profitability

Good

Net income was $45M in Q1’26 vs -$173M in Q1’25 (large YoY improvement; shift from negative to positive margins). Net margin improved to 4.8% from -20.3%. QoQ net income declined vs $53.1M in Q4’25 (-15.2%), but operating margin remains solid at ~7.3%.

Cash Flow Quality

Good

Operating cash flow of $119M and free cash flow of $93M in Q1’26 support earnings quality. Dividends paid were $5M with an ~11% payout ratio, suggesting manageable near-term shareholder payouts relative to cash generation.

Leverage & Balance Sheet

Neutral

Assets were $8.16B and equity $4.48B in Q1’26, broadly stable vs prior quarters. Net debt remains relatively low at ~$200M, but short-term debt is $411M; liquidity ratios are tight (current ratio ~1.01), indicating some sensitivity to working-capital swings.

Shareholder Returns

Strong

Total shareholder return backdrop is strong: price is up 38.7% over the last year (>20% 1y_change threshold). Dividend yield is small (~0.07%), but capital appreciation dominates the return profile.

Analyst Sentiment & Valuation

Fair

Consensus price target is $180 (high/low/median all $180) vs current price $132.23, implying upside of ~36%. However, valuation looks demanding with P/E ~37 and P/FCF >70, increasing execution risk if margins fade.

Disclaimer:This analysis is AI-generated for informational purposes only. Accuracy is not guaranteed and this does not constitute financial advice.

Fundamentals Overview

Loading fundamentals overview...

JBTM started 2026 with strong momentum: Q1 revenue $936M (+~10% YoY) and adjusted EBITDA margin 15.2% (+210 bps), driven by Protein Solutions’ poultry volume leverage. Protein margins expanded by 500 bps+ to 21.7% as synergies and continuous improvement compounded operating efficiency. Prepared Food and Beverage was the offset: revenue was flat and segment EBITDA margin fell 170 bps to 14.7%, reflecting higher tariff costs, lower volume, and warehouse automation underperformance. Cash generation was a highlight—$100M free cash flow and 70% conversion—supporting leverage reduction to 2.6x, with a target near 2.0x by year-end. Guidance remained unchanged at the midpoint (revenue +6%, EBITDA margin +145 bps, EPS +29%), but management reiterated a ~25–50 bps net tariff headwind after mitigation. Analysts focused on inflation durability, automation/tariff-driven margin timing, and USDA line-speed rules’ multiyear impact.

AI IconGrowth Catalysts

  • Protein Solutions: higher poultry volume driven by strong 2025 backlog (segment revenue +22% YoY)
  • Further processing demand within poultry supported by line-speed automation needs and value-added processing investment
  • Cross-selling/synergy order capture after JBT+Marel integration (orders $1B+ and +17% YoY)

Business Development

  • Customer deployment of line splits in Q1 (specific customer not named)
  • USDA process for poultry line speed rules (pending final determination; input provided via comments)
  • Reference point: Tyson indicated strength in the quarter (named in the discussion, not a contract/partnership)

AI IconFinancial Highlights

  • Consolidated revenue: $936M (+~10% YoY); organic +4% and FX +6%
  • Adjusted EBITDA: $142M (+27% YoY); adjusted EBITDA margin 15.2% (+210 bps YoY)
  • Protein Solutions revenue: $460M (+22% YoY); Protein adjusted EBITDA margin 21.7% (+500 bps+ YoY)
  • Prepared Food and Beverage Solutions revenue: $476M (flat YoY); segment adjusted EBITDA margin 14.7% (-170 bps YoY) due to higher tariff costs, volume decline, and warehouse automation underperformance
  • Free cash flow: $100M; free cash flow conversion to adjusted EBITDA: 70%
  • Full-year guidance maintained: at midpoint revenue growth +6%, adjusted EBITDA margin expansion +145 bps, adjusted EPS improvement +29%
  • Tariffs: IEEPA elimination benefit is forecast to be offset by incremental Sections 122 and 232 tariff increases; no IEEPA tariff payment refunds assumed; net tariff impact remains a ~25–50 bps headwind after mitigation

AI IconCapital Funding

  • Free cash flow $100M in Q1 (70% conversion to adjusted EBITDA)
  • Leverage ratio: 2.6x at end of Q1; target ~2.0x by year-end
  • No share repurchase amount and no explicit debt/cash runway figures were provided in the transcript

AI IconStrategy & Ops

  • NextGen strategy: customer-centric service model using installed base (prescriptive maintenance, parts delivery performance, regional accountability)
  • Prepared Food and Beverage headwind concentration in warehouse automation/AGV: more affected by customer tariff-driven demand impacts; discrete projects largely behind them
  • Planned margin recovery actions: expect impacts to begin late Q2 and continue through Q3 and Q4
  • Poultry automation demand: shift toward primary/secondary further processing; line-speed capability and downstream system harmonization described as a multi-year transformation

AI IconMarket Outlook

  • Q2 guidance: revenue $975M–$1.0B; adjusted EBITDA margin 17.0%–17.5%
  • Full-year 2026 confidence maintained despite tariffs; tariff headwind after mitigation ~25–50 bps

AI IconRisks & Headwinds

  • Prepared Food and Beverage Solutions: warehouse automation/AGV underperformance tied to tariff-driven customer demand and volume decline
  • Tariff regime uncertainty: elimination of IEEPA tariffs offset by incremental Sections 122 and 232 increases; no refund assumptions
  • US poultry regulatory uncertainty: USDA final decision on line speed rules expected in the next few months; potential for productivity constraints depending on outcome
  • Middle East conflict: not impacting order book/pipeline, but increasing logistics, fertilizer, and energy inflation risk; monitoring cost pass-through ability

Q&A: Analyst Interest

  • Inflation comparison vs 2022: Management said poultry customers are in a stronger position than in 2022, citing abundant low-cost corn/soy, improved price/cost spreads, and strong balance sheets. They also noted improved diversification post-combination and competitive pricing/continuous-improvement support for passing through inflation.
  • Prepared Food & Beverage warehouse automation headwinds: Management attributed most warehouse automation weakness to a larger customer impact from tariff changes and demand disruption, plus a few discrete projects that are expected to be largely behind them. Actions to address lower volume/margins should start affecting results late in Q2 and then progress in Q3/Q4.
  • Poultry cycle sustainability and USDA line speeds: Management highlighted multi-year opportunity from line-speed transformation in North America, noting USDA’s final determination is expected in the next few months. They described systems needing harmonization to move from 140 birds/min to 175, and said line splits can unlock productivity even under current rules; a line-splits deployment occurred in Q1.

Sentiment: MIXED

Note: This summary was synthesized by AI from the JBTM Q1 2026 earnings transcript. Financial data is complex; please verify all metrics against official SEC filings before making investment decisions.

📋 Official Regulatory 10-K / 10-Q SEC Filings

Direct authenticated documentation links to audited SEC database reports for JBTM.

SEC EDGAR Live Feed
Loading financial data and tables...
📁

SEC Filings (JBTM)

© 2026 Stock Market Info — JBT Marel Corporation (JBTM) Financial Profile