AAON, Inc.

AAON, Inc. (AAON) Market Cap

AAON, Inc. has a market capitalization of $10.86B.

Price: $132.62

β–Ό -11.03 (-7.68%)

Market Cap: 10.86B

NASDAQ Β· time unavailable

CEO: Matthew J. Tobolski

Sector: Industrials

Industry: Construction

IPO Date: 1992-12-16

Website: https://www.aaon.com

AAON, Inc. (AAON) - Company Information

Market Cap: 10.86B|Sector: Industrials

Company Profile

AAON, Inc., together with its subsidiaries, engages in engineering, manufacturing, marketing, and selling air conditioning and heating equipment in the United States and Canada. The company operates through three segments: AAON Oklahoma, AAON Coil Products, and BasX. It offers rooftop units, data center cooling solutions, cleanroom systems, chillers, packaged outdoor mechanical rooms, air handling units, makeup air units, energy recovery units, condensing units, geothermal/water-source heat pumps, coils, and controls. The company markets and sells its products to retail, manufacturing, educational, lodging, supermarket, data centers, medical and pharmaceutical, and other commercial industries. It sells its products through a network of independent manufacturer representative organizations and internal sales force. The company was incorporated in 1987 and is based in Tulsa, Oklahoma.

Analyst Sentiment

72%
Buy

From 5 Active Polls

1Y Forecast: $119.00

β–Ό -10.3% Potential Upside

Consensus Target Metrics

Low Bound

$118

Median

$119

High Bound

$120

Average

$119

Price & Moving Averages

Loading chart...

🎯 Wall Street Analyst Intelligence Report

1-Year structural target targets, chart projections, and sentiment maps.

Average 1Y Target
$119.00
β–Ό -10.27% Upside
Low Target
$118.00
-11% Risk
Median Target
$119.00
-10% Mid
High Target
$120.00
-10% Max

Consensus Trend Projection

Trailing closures vs. 12-month metrics map.

Analyst Vote Distribution

Aggregate institutional coverage sentiment weights.

Sentiment volume allocation data unavailable.

Historical valuation matrix unavailable.

⚑ AAON Growth Runway Model

Standard long term linear growth fade

Multi-Stage Discounted Cash Flow Sandbox

Market Price$132.62
Intrinsic Value$46.72
Market Alignment
Overvalued by 64.8%relative to calculated intrinsic value
9.00%
Exp: 3%3%
i

Growth runway slowdown

This value provides a time window for the growth rate to decline beyond Stage 1 toward the terminal rate. Longer windows are most useful for companies with high growth starting conditions or strong competitive advantages. This option stretches out the growth rate slowdown across 5, 10, or 15-year steps. A high-growth starting condition (exceeding a 25% initial growth rate) automatically applies a curve decay to simulate realistic, rapid market saturation.
i

Terminal growth rate

With long-term inflation between 3-5%, revenue must grow by that baseline to maintain flat real-world market share. This value sets the permanent terminal growth rate to factor into the valuation beyond the growth slowdown runway toward maturity.

3-Stage Financial Runway Horizon

🧠 Perpetuity Horizon Engine (Stage 3: Post-2035)

Terminal FCF Base$0.01B
Perpetuity TV Value$0.28B
Discounted TV (PV)$0.12B
TV Weighting %65.9%
⚠️
Financial Model Disclaimer & Risk Disclosure: This interactive scenario simulator is an educational sandbox provided strictly for informational and analytical research purposes. Core historical financial statements and consensus estimates are sourced directly via Financial Modeling Prep (FMP). All downstream outputs are entirely deterministic, hypothetical projections generated by combining automated mathematical formulas (including linear interpolation and Gaussian bell-curve decay models) with user-selected variables and third-party financial data inputs. Users assume all liability for trading decisions executed based on these sandbox calculations.

πŸ“˜ Full Research Report

ℹ️

AI-Generated Research: This report is for informational purposes only.

πŸ“˜ AAON INC (AAON) β€” Investment Overview

🧩 Business Model Overview

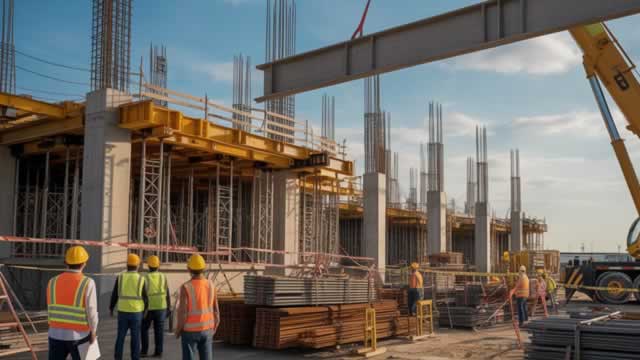
AAON designs and manufactures packaged HVAC systemsβ€”primarily custom-engineered units used in commercial and industrial settings. The value chain is centered on translating end-customer requirements (capacity, efficiency, energy source compatibility, airflow/ventilation needs, and site constraints) into manufactured equipment that can be specified by contractors and building owners through the project design process.

Sales typically flow through the commercial HVAC contracting/distribution ecosystem, where specification and lead-time reliability matter. AAON’s model is driven by unit manufacturing and fulfillment, with incremental contribution from accessories, controls, and service-oriented components that accompany installed base activity.

πŸ’° Revenue Streams & Monetisation Model

Revenue is predominantly transactional: the sale of HVAC equipment per project and per replacement/retrofit need. Monetisation is concentrated in the sale price and in configuration complexity (engineering content, efficiency level, and options).

Margin drivers include:

  • Product mix and engineering content (higher-value configurations and efficiency packages tend to support better gross margins).
  • Manufacturing throughput and absorption of fixed costs (HVAC manufacturing is capacity- and labor-utilization sensitive).
  • Component sourcing discipline (electromechanical components, compressors, and sheet-metal/structural inputs influence unit economics).
  • Pricing discipline in cyclical environments (commercial HVAC competition can compress pricing when construction activity slows).

A meaningful portion of customer interaction occurs at the time of equipment specification and ordering, making AAON less β€œsubscription-like” and more dependent on construction and replacement cycles. Incremental revenue opportunities exist through parts/accessories tied to installed projects, but the core monetisation remains equipment sales.

🧠 Competitive Advantages & Market Positioning

AAON’s positioning is best understood as a commercial HVAC engineering and manufacturing specialization with manufacturing execution strengths that translate into fewer project friction points (spec compliance, lead times, and configuration accuracy).

Moat assessment:

  • Switching Costs (moderate): HVAC equipment is specified into building designs, and replacement decisions involve system compatibility, permitting/inspection expectations, and contractor familiarity. Once a design standard is set for a facility or multi-site program, re-specification friction can increase.
  • Cost Advantage / Execution Moat: AAON’s scale within its niche manufacturing footprint, along with engineering-to-order capability, supports throughput and reduces costly rework. Competitors with less flexible production footprints can face higher project execution risk in complex configurations.
  • Intangible Asset (know-how): HVAC performance optimization (efficiency, airflow performance, energy-source configuration) is embedded in product design and manufacturing processes. This is difficult to replicate quickly at a comparable quality level.

Competitive benchmarking (industry context):

  • Trane (Ingersoll Rand) and Carrier (large-scale manufacturers with broad product portfolios) compete heavily through brand/distribution and wide spec coverage across residential and commercial end markets.
  • Lennox competes across packaged and split systems with strong distributor relationships and commercial coverage.
  • Daikin (including commercial brands) competes with a wide product ecosystem and channel penetration.

Compared with these broad-based peers, AAON’s industry focus emphasizes packaged commercial HVAC units and configuration flexibility. This contrast can matter in projects where performance requirements, site constraints, or efficiency expectations increase the value of engineering execution and manufacturing reliability.

πŸš€ Multi-Year Growth Drivers

Over a 5–10 year horizon, AAON’s opportunity set is supported by secular trends that expand the volume and value of commercial HVAC equipment:

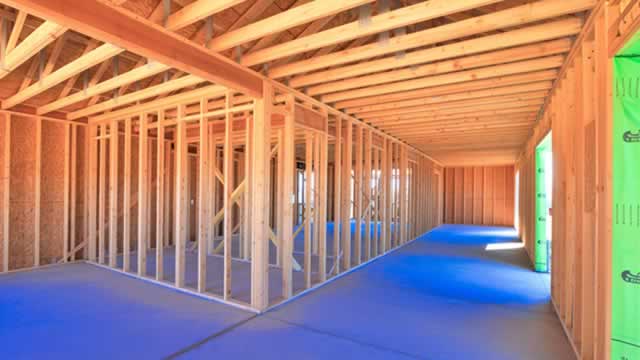
  • Building stock growth and replacement cycles: Aging commercial infrastructure drives retrofit and replacement demand for heating/cooling capacity and improved system performance.
  • Energy-efficiency and ventilation requirements: Efficiency standards, building performance goals, and ventilation/indoor air quality expectations support demand for higher-efficiency configurations.
  • Electrification alongside gas-electric diversity: Many commercial projects pursue emissions reductions and comfort optimization through system upgrades that may combine energy-source options and improved heat transfer/controls.
  • Data center and mission-critical facilities: Growth in spaces requiring disciplined thermal management supports packaged HVAC demand, with specifications favoring reliable delivery and configurable performance.
  • Project-led differentiation: As design teams emphasize detailed performance criteria, the ability to deliver correctly configured equipment supports continued specification relevance.

⚠ Risk Factors to Monitor

  • Construction-cycle sensitivity: Commercial HVAC demand is tied to non-residential construction activity and tenant/owner retrofit budgets; downturns can pressure order volumes and pricing.
  • Input cost and supply-chain volatility: Changes in availability and pricing for compressors, motors, sheet metal, and other components can impact margins and lead times.
  • Pricing competition: Market share gains by competitors through channel promotions or project bidding strategies can compress margins.
  • Execution and quality risk: Engineering-to-order systems require disciplined manufacturing controls; defects can create warranty costs and reputational damage with contractors.
  • Regulatory and efficiency standard changes: Shifts in energy-efficiency rules or testing requirements can increase R&D and compliance costs and alter product mix demand.
  • Working-capital intensity: HVAC manufacturers can face inventory and receivables dynamics tied to long project cycles, affecting free cash flow through different construction environments.

πŸ“Š Valuation & Market View

AAON and similar HVAC equipment manufacturers are typically valued as industrials with cyclical exposure, where multiples compress or expand based on normalized earnings power rather than short-cycle results. The market focus often centers on:

  • Operating margin sustainability (mix, manufacturing absorption, and pricing power vs. commodity pressure).
  • Conversion of sales into free cash flow (working capital management and capex discipline).
  • Visibility indicators such as backlog/order trends and distribution channel health (rather than point-in-time profitability).
  • Balance-sheet resilience during downturns (liquidity, debt affordability, and inventory risk).

EV/EBITDA and earnings-based valuation frameworks are common for this sector; P/S may be less informative for cyclical industrials when margins fluctuate materially across the cycle.

πŸ” Investment Takeaway

AAON presents a compelling long-term profile as a specialized commercial HVAC manufacturer where engineering-to-order capability, manufacturing execution, and moderate specification-linked switching friction support durable positioning through building-stock growth and energy-efficiency-driven upgrade demand. The principal investor challenge is managing cyclicality and input-driven margin variability, while assessing whether AAON can sustain operational discipline through varying construction environments.


⚠ AI-generated β€” informational only. Validate using filings before investing.

πŸ“Š AI Financial Analysis

Powered by StockMarketInfo
Earnings Data: Q Ending 2026-03-31

"AAON reported Q1’26 revenue of $496.9M and net income of $39.8M (EPS $0.49). Versus Q1’25, revenue rose 54.3% (from $322.1M) and net income rose 36.0% (from $29.3M), while diluted EPS increased 37.1% (from $0.35). Sequentially, revenue increased 17.2% QoQ (from $424.2M), and net income increased 24.3% QoQ (from $32.0M). Profitability improved across the quarter: gross margin was 25.1% in Q1’26 vs 25.9% in Q4’25 (slight down), but operating income margin improved to 11.5% (from 10.4% in Q4’25) and net margin increased to 8.0% (from 7.6% in Q4’25). Cash generation remains pressured by capex and working-capital timing: operating cash flow was $34.0M, but free cash flow was -$11.1M after $45.1M of capex. Dividend payments of $8.1M were consistent with prior quarters, but buybacks were negligible (none reported). Balance sheet strength is notableβ€”net debt is essentially zero (-$13K) and total equity was $934.2M, slightly up from $895.0M in Q4’25. On shareholder returns, the stock is up 16.8% over 1 year (price momentum >20% was not met), with a small dividend yield (~0.12%)."

Revenue Growth

Strong

Strong YoY revenue growth of +54.3% in Q1’26. QoQ revenue also rose +17.2% vs Q4’25, indicating sustained demand and improving scale.

Profitability

Positive

Net margin improved to 8.0% in Q1’26 (from 7.6% in Q4’25) and net income grew faster than revenue (+36.0% YoY). Gross margin was slightly lower QoQ, but operating margin strengthened.

Cash Flow Quality

Caution

Operating cash flow was positive at $34.0M, but free cash flow was -$11.1M due to $45.1M capex. Dividend coverage by cash flow appears less robust in the quarter.

Leverage & Balance Sheet

Good

Net debt is essentially zero (net debt ~ -$0.01M). Total assets increased to $1.79B and equity rose to $934.2M, supporting resilience.

Shareholder Returns

Positive

1-year price change of +16.8% and a small dividend yield (~0.12%). No buybacks were reported in Q1’26, limiting capital return beyond dividends.

Analyst Sentiment & Valuation

Fair

Price target consensus is near $119 versus price ~$94, implying upside, but valuation multiples remain elevated (P/E ~42x per latest ratio data), tempering the score.

Disclaimer:This analysis is AI-generated for informational purposes only. Accuracy is not guaranteed and this does not constitute financial advice.

Fundamentals Overview

Loading fundamentals overview...

AAON delivered a strong Q1 execution quarter with net sales up 54% to a record $496.9M and diluted EPS up 37% to $0.48. The topline surge was supported by expanding capacity and improved throughput across Memphis/Longview/Redmond, producing record Basics demand: Basics sales +72% YoY, book-to-bill over 2, and a $2.1B backlog (up 160% for Basics branded orders YoY). Despite growth, gross margin fell 170 bps to 25.1% due to temporary outsourcing, Memphis fixed-cost absorption, and tariff/inflation pressures. Management repeatedly framed these as conscious, transitory trade-offs to accelerate share gains and lead-time improvements, supported by pricing actions embedded in backlog taken in the back half of last year. Guidance raises confidence in demand with 2026 sales growth of 40% to 45% and gross margin of 27% to 28%, with Oklahoma margins expected to improve sequentially in Q2/Q3 as internal capacity ramps and reliance on outsourcing declines.

AI IconGrowth Catalysts

  • Basics branded sales up 72% YoY (data center cooling demand) with expanded production throughput from Memphis, Longview, and Redmond
  • Basics book-to-bill over 2 driving record Basics branded backlog up 160% YoY and up 24% sequentially
  • AAON brand production rate improvement supporting AAON branded sales up 42% YoY and up 11% sequentially; sequential backlog down 3% while up 26% YoY
  • Bookings acceleration tied to ramp decisions that enabled faster revenue/lead-time improvements and share gains in both transactional and national account channels
  • Alpha-class (fully electric heat pump) equipment orders increased 56% during the quarter

Business Development

    AI IconFinancial Highlights

    • Net sales +54% YoY to $496.9M (record); driven by elevated backlog conversion and capacity investments increasing production rates
    • EPS (diluted, non-GAAP) $0.48, +37% YoY
    • Gross margin 25.1%, down 170 bps vs 26.8% prior year, impacted by increased outsourcing, Memphis facility fixed-cost absorption, tariff-related pressures, and general inflation (described as temporary)
    • SG&A declined as a % of sales by 220 bps to 13.7% (SG&A up 32% to $67.9M) reflecting operating leverage/disciplined cost management
    • Non-GAAP adjusted EBITDA +44% YoY to $78M; EBITDA margin 15.7% vs 17.6% prior year
    • Oklahoma segment gross margin reported 26.3%, +120 bps YoY; adjusted/normalized excluding Memphis overhead ~30% (reported gap ~500 bps to upper-30s historical highs attributed to outsourcing, tariff surcharge/cost dynamics, and general inflation)
    • Capital expenditures $52.9M; operating cash flow +$34M (highest since Q3 2024) vs -$9.2M in prior year period

    AI IconCapital Funding

    • Debt at quarter-end: $425.2M (leverage ratio improved to 1.71x vs 1.77x at Dec 31, 2025)
    • Cash, cash equivalents, and restricted cash: $1.1M (Mar 31, 2026)
    • No buyback amount provided in transcript; capex $52.9M during the quarter

    AI IconStrategy & Ops

    • Temporary outsourcing and ramp-related inefficiencies used to support strong growth and market-share gains while internal capacity scales
    • Supply chain management and lean manufacturing investments discussed as moving from build phase to execution phase, with accelerating benefits expected as 2026 progresses
    • Operational focus on reducing lead times and improving production throughput across all three facilities; sequential reduction in Basics and AAON backlog as production normalizes
    • Pricing actions embedded in backlog taken in the back half of last year to offset tariff/price-cost dynamics; management emphasizes continued pricing discipline

    AI IconMarket Outlook

    • Full-year 2026 guidance: sales growth 40% to 45% and gross margin 27% to 28%; SG&A % of sales 14% to 15%; D&A $95M to $100M
    • Q2 expectations: sequential improvement in Oklahoma segment margins, including with/without Memphis; sequential progression expected in Q2 and Q3, with potential Q4 pullback due to normal seasonality
    • Basics guide framing: 40% to 45% total revenue growth implies roughly ~$1B of Basics revenue for 2026

    AI IconRisks & Headwinds

    • Gross margin pressure: outsourcing mix, temporary fixed-cost absorption at the Memphis facility, tariff-related pressures, and general inflation (management describes as temporary)
    • AAON branded backlog still up 26% YoY, though sequentially down 3%; management must ramp production further to work down backlog to normalized lead times
    • Market conditions soft for AAON brand; extended lead times persist (improving but not fully normalized)
    • Seasonality risk in Oklahoma: potential margin pullback in Q4 and Q1 vs summer peak months

    Q&A: Analyst Interest

    • Oklahoma gross margin bridge: analyst requested a detailed unpack of the reported ~26% vs ~30% normalized margin and the key temporary items driving the gap. Management attributed it to Memphis overhead, outsourcing decisions to support enterprise throughput, and temporary tariff/price-cost and general inflation pressures, with pricing actions embedded in backlog.
    • Q2 sequential margin trajectory: analyst asked why Q2 should improve sequentially and where margins might land. Management emphasized Oklahoma’s ramp progression into Q2 and Q3, including seasonality context (historically seasonal in Q4/Q1). They guided toward consistent improvement during peak summer months with only Q4 normalization risk.
    • Basics acceleration drivers and revenue math: analyst asked why Basics revenue beat expectations versus prior guidance and what’s embedded in the full-year Basics growth guide. Management said they accelerated productivity/production ramp to capitalize on strengthening data center demand, enabling faster bookings; the year’s guide implies ~$1B Basics revenue.

    Sentiment: POSITIVE

    Note: This summary was synthesized by AI from the AAON Q1 2026 earnings transcript. Financial data is complex; please verify all metrics against official SEC filings before making investment decisions.

    πŸ“‹ Official Regulatory 10-K / 10-Q SEC Filings

    Direct authenticated documentation links to audited SEC database reports for AAON.

    SEC EDGAR Live Feed
    Loading financial data and tables...
    πŸ“

    SEC Filings (AAON)

    Β© 2026 Stock Market Info β€” AAON, Inc. (AAON) Financial Profile