Northrop Grumman Corporation

Northrop Grumman Corporation (NOC) Market Cap

Northrop Grumman Corporation has a market capitalization of $76.81B.

Price: $540.81

-3.59 (-0.66%)

Market Cap: 76.81B

NYSE · time unavailable

CEO: Kathy J. Warden

Sector: Industrials

Industry: Aerospace & Defense

IPO Date: 1981-12-31

Website: https://www.northropgrumman.com

Northrop Grumman Corporation (NOC) - Company Information

Market Cap: 76.81B|Sector: Industrials

Company Profile

Northrop Grumman Corporation operates as an aerospace and defense company worldwide. The company's Aeronautics Systems segment designs, develops, manufactures, integrates, and sustains aircraft systems. This segment also offers unmanned autonomous aircraft systems, including high-altitude long-endurance strategic ISR systems and vertical take-off and landing tactical ISR systems; and strategic long-range strike aircraft, tactical fighter and air dominance aircraft, and airborne battle management and command and control systems. Its Defense Systems segment designs, develops, and produces weapons and mission systems. It offers products and services, such as integrated battle management systems, weapons systems and aircraft, and mission systems. This segment also provides command and control and weapons systems, including munitions and missiles; precision strike weapons; propulsion, such as air-breathing and hypersonic systems; gun systems and precision munitions; life cycle service and support for software, weapons systems, and aircraft; and logistics support, sustainment, operation, and modernization for air, sea, and ground systems. The company's Mission Systems segment offers cyber, command, control, communications and computers, intelligence, surveillance, and reconnaissance systems; radar, electro-optical/infrared and acoustic sensors; electronic warfare systems; advanced communications and network systems; cyber solutions; intelligence processing systems; navigation; and maritime power, propulsion, and payload launch systems. This segment also provides airborne multifunction sensors; maritime/land systems and sensors; navigation, targeting, and survivability solutions; and networked information solutions. Its Space Systems segment offers satellites and payloads; ground systems; missile defense systems and interceptors; launch vehicles and related propulsion systems; and strategic missiles. The company was founded in 1939 and is based in Falls Church, Virginia.

Analyst Sentiment

78%
Strong Buy

From 35 Active Polls

1Y Forecast: $728.38

▲ +34.7% Potential Upside

Consensus Target Metrics

Low Bound

$620

Median

$750

High Bound

$815

Average

$728

Price & Moving Averages

Loading chart...

🎯 Wall Street Analyst Intelligence Report

1-Year structural target targets, chart projections, and sentiment maps.

Average 1Y Target
$728.38
▲ +34.68% Upside
Low Target
$620.00
15% Risk
Median Target
$750.00
39% Mid
High Target
$815.00
51% Max
Consensus
Buy
20 / 35 Buys

Consensus Trend Projection

Trailing closures vs. 12-month metrics map.

Analyst Vote Distribution

Aggregate institutional coverage sentiment weights.

📊 Historical Valuation Multiples

Real-time Trailing Twelve Month (TTM) momentum side-by-side with discrete quarterly metrics.

Fiscal QuarterTTMQ1 2026Q4 2025Q3 2025Q2 2025Q1 2025Q4 2024Q3 2024Q2 2024
Period EndingTrailing 12MMar 31, 2026Dec 31, 2025Sep 30, 2025Jun 30, 2025Mar 31, 2025Dec 31, 2024Sep 30, 2024Jun 30, 2024
Market Cap ($M)76,81396,94681,48387,19471,84774,03768,98677,20464,163
Enterprise Value ($M)91,797111,93096,821104,52489,26990,83284,82793,79880,927
Price to Earnings Ratio (P/E)16.7927.7014.2819.8215.3038.4813.6418.8117.06
Price/Earnings-to-Growth Ratio (PEG)1.1528.491.641.9820.34
Price to Sales Ratio (P/S)1.819.816.968.376.947.826.467.726.28
Price to Book Ratio (P/B)4.495.664.895.454.644.944.515.234.49
Price to Free Cash Flow Ratio (P/FCF)23.24-53.1825.1969.42112.79-40.6639.15105.7658.07
Enterprise Value to Sales (EV/Sales)11.338.2710.038.629.597.949.387.92
Enterprise Value to EBITDA (EV/EBITDA)12.2582.2441.7256.1145.7884.8139.9255.8351.12
Debt to Equity Ratio2.001.001.181.211.251.231.321.351.40

NOC Growth Runway Model

Standard long term linear growth fade

Multi-Stage Discounted Cash Flow Sandbox

Market Price$540.81
Intrinsic Value$307.64
Market Alignment
Overvalued by 43.1%relative to calculated intrinsic value
9.00%
Exp: 2%2%
i

Growth runway slowdown

This value provides a time window for the growth rate to decline beyond Stage 1 toward the terminal rate. Longer windows are most useful for companies with high growth starting conditions or strong competitive advantages. This option stretches out the growth rate slowdown across 5, 10, or 15-year steps. A high-growth starting condition (exceeding a 25% initial growth rate) automatically applies a curve decay to simulate realistic, rapid market saturation.
i

Terminal growth rate

With long-term inflation between 3-5%, revenue must grow by that baseline to maintain flat real-world market share. This value sets the permanent terminal growth rate to factor into the valuation beyond the growth slowdown runway toward maturity.

3-Stage Financial Runway Horizon

🧠 Perpetuity Horizon Engine (Stage 3: Post-2035)

Terminal FCF Base$5.79B
Perpetuity TV Value$109.02B
Discounted TV (PV)$46.05B
TV Weighting %58.4%
⚠️
Financial Model Disclaimer & Risk Disclosure: This interactive scenario simulator is an educational sandbox provided strictly for informational and analytical research purposes. Core historical financial statements and consensus estimates are sourced directly via Financial Modeling Prep (FMP). All downstream outputs are entirely deterministic, hypothetical projections generated by combining automated mathematical formulas (including linear interpolation and Gaussian bell-curve decay models) with user-selected variables and third-party financial data inputs. Users assume all liability for trading decisions executed based on these sandbox calculations.

📘 Full Research Report

ℹ️

AI-Generated Research: This report is for informational purposes only.

📘 NORTHROP GRUMMAN CORP (NOC) — Investment Overview

🧩 Business Model Overview

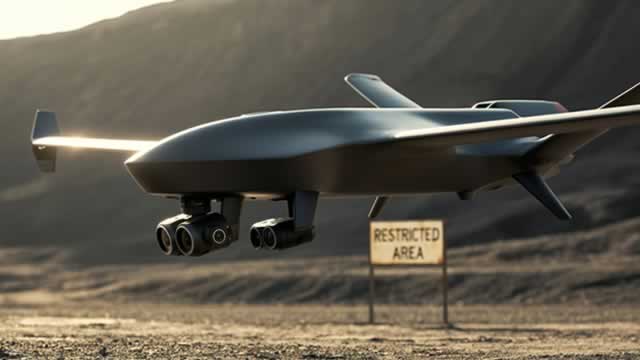
Northrop Grumman is a defense prime contractor and systems integrator spanning aerospace, mission systems, and (through program execution and partner networks) platforms that include aircraft/airframe components, unmanned and autonomous systems, radar and sensing, command-and-control, space systems, and missile defense. The business model is contract-driven: it bids for government and allied customer programs, then designs, builds, integrates, tests, and delivers complex systems that must satisfy rigorous performance, safety, security, and interoperability requirements.

A key operational feature is long program duration and deep downstream sustainment. The company earns not only production revenue but also modernization, upgrades, and life-cycle support, creating continuity across program phases and preserving customer relationships once a system is fielded.

💰 Revenue Streams & Monetisation Model

Revenue is largely tied to government procurement and allied transfer programs (including U.S. government contracting and international sales channels). Monetisation is a mix of:

  • Program execution / production revenue: tied to development and manufacturing milestones.
  • Lifecycle sustainment & modernization: recurring in the sense of ongoing spares, maintenance, software support, and upgrades over the platform’s service life.
  • Mission systems and software-enabled capabilities: often monetised through upgrades, integration work, and service arrangements that extend beyond initial procurement.

Margin structure is driven by program mix (systems vs. pure production), contract terms (cost-sharing and risk allocation), and execution discipline (schedule adherence, procurement cost management, and engineering throughput). The company’s scale in complex integration typically improves the ability to manage program complexity and supply chain execution relative to smaller primes and subcontractors.

🧠 Competitive Advantages & Market Positioning

Northrop Grumman’s moat is primarily built on high switching costs and intangible assets associated with qualifying advanced defense systems for long-lived platforms and mission environments.

  • High Switching Costs (Qualification & Integration Lock-In): Once sensors, software, networks, and command-and-control interfaces are qualified and integrated into a customer’s operating architecture, replacement is costly in engineering, testing, certification, and operational disruption. Competitors face re-qualification barriers and integration risk.
  • Intangible Assets (Systems Engineering Expertise): Complex mission systems require specialized engineering teams, vetted supply chains, and deep understanding of classified and security-sensitive requirements—capabilities that take years to replicate.
  • Program Execution Scale: Experience with multi-year development, production ramping, and sustainment can reduce execution friction versus less diversified competitors.

Competitive benchmarking:

  • Lockheed Martin — Strong position in air platforms and major integrated defense programs, with emphasis on aircraft/strike capabilities and large-scale systems.
  • General Dynamics — Particularly prominent in land systems and mission-related platforms, with competitive strengths in platform engineering and sustainment.
  • Boeing Defense, Space & Security — Competitive in certain air and space platforms, but with different portfolio composition and program execution profiles.

Against these rivals, Northrop Grumman’s positioning emphasizes mission systems, sensing, command-and-control, and space-related capabilities, where integration and qualification tend to create durable switching costs for customers seeking continuity of performance and interoperability.

🚀 Multi-Year Growth Drivers

Over a 5–10 year horizon, growth is supported less by market share tactics and more by structural defense demand drivers and technology modernization cycles:

  • Persistent demand for mission readiness: Replacement, upgrading, and sustaining defense capabilities tends to remain structurally important due to operational requirements and capability gaps.
  • Air and missile defense modernization: Expanding requirements for detection, tracking, and interception drive incremental spending across sensors, software, and system integration.
  • Space and ISR (intelligence, surveillance, reconnaissance): Ongoing needs for sensing, resilient communications, and space-enabled targeting support continued TAM breadth.
  • Software-enabled defense architectures: Increasing reliance on mission software and networked capabilities expands the addressable opportunity for modernization and sustainment.
  • Allied interoperability and capability harmonization: Procurement through allied and partner channels creates a steady pipeline for systems designed to work within coalition command structures.

The company’s ability to participate across development, production, and lifecycle phases supports longer-duration revenue visibility than purely transactional offerings.

⚠ Risk Factors to Monitor

  • Program execution and cost risk: Large, complex contracts expose the business to schedule slips, supply chain disruptions, and margin pressure if performance or costs deviate from expectations.
  • Government budget cycles and procurement priorities: Defense spending and acquisition strategies can shift, affecting contract timing, scope, and continuation risk.
  • Contract structure and risk allocation: The mix of fixed-price versus cost-based elements can materially influence profitability and cash flow volatility.
  • Technology and platform obsolescence: Rapid advances in sensors, autonomy, countermeasures, and cyber defense can compress development windows and require sustained investment.
  • Export controls and geopolitical constraints: International sales and collaboration may face regulatory and political limitations.
  • Workforce and supply chain capacity: Highly skilled engineering talent and specialized manufacturing capacity can become binding constraints during procurement surges.

📊 Valuation & Market View

The market typically values defense primes through a combination of earnings and cash generation expectations, with emphasis on:

  • Backlog quality and conversion: The durability of awarded programs and the ability to convert backlog into stable earnings and cash flow.
  • Margin sustainability: Investors focus on execution discipline and contract mix, especially for complex systems and sustainment work.
  • Free cash flow reliability: Contract payment terms, working capital dynamics, and disciplined procurement drive cash conversion and influence multiples.
  • Risk perception premium: Execution missteps or margin resets can lead to valuation compression, while demonstrated program stability tends to support re-rating.

Sector valuation commonly incorporates EV/EBITDA and earnings-based measures, but the dominant “moving parts” are backlog convertibility, execution track record, and cash flow confidence rather than short-term earnings prints.

🔍 Investment Takeaway

Northrop Grumman offers a structurally defensible position rooted in high switching costs from qualification and integration requirements, supported by durable intangible assets in systems engineering and mission integration. Its portfolio spans production and life-cycle sustainment for complex defense architectures, supporting a long-duration opportunity set tied to modernization and mission readiness. The investment case depends on maintaining disciplined program execution, managing cost and contract risk, and successfully translating advanced capabilities into sustained backlog across air, space, sensing, and missile defense.


⚠ AI-generated — informational only. Validate using filings before investing.

📰 Market News & Coverage

15 Stories Available

Real-time institutional reporting and market updates for NOC.

zacks.com2026-06-05

Northrop Grumman Secures Navy Contract for GQM-163A Target Support

NOC wins a $100M Navy contract to support GQM-163A target production and launch ops, running through May 2031.

247wallst.com2026-06-05

Top 5 Stocks That Will Profit From SpaceX's NASA Launch Monopoly After Blue Origin's Pad Collapse

Blue Origin's New Glenn pad will take a minimum of a year to rebuild after a hot fire test obliterated the company's only launch infrastructure for the vehicle, marking the first pad explosion since the Soviet N1 rocket in 1969.

seekingalpha.com2026-06-04

Northrop Grumman Is Taking A Smart Approach To The Drone Pivot

Northrop Grumman is strategically pivoting to low-cost, versatile drone and anti-drone platforms, positioning for a drone-centric defense future. NOC's valuation has improved after a price slide but remains expensive relative to implied levered FCF growth, justifying a hold rating. Key projects like Common UAS Payload, Prism AI, and Talon IQ offer platform-agnostic exposure, while NOC's missile, electronic warfare, and space defense businesses provide diversification.

gurufocus.com2026-06-04

Western Rare Earth Supply Chains Are Finally Taking Shape

Western Rare Earth Supply Chains Are Finally Taking Shape PR Newswire NEW YORK, June 4, 2026

prnewswire.com2026-06-04

Western Rare Earth Supply Chains Are Finally Taking Shape

/PRNewswire/ -- As the Pentagon's 2027 ban on Chinese-origin rare earth materials moves closer, REalloys (ALOY) is locking down exclusive control of the

fool.com2026-05-30

Could the Next Great Space Stock Come From Japan?

Japan just had a great space idea. Unfortunately for Astroscale, many American companies already had the same great idea.

fool.com2026-05-28

Lockheed Martin vs. Boeing: Which Industrials Stock Is a Better Buy in 2026?

Lockheed Martin leans on defense contracts and steady margins, while Boeing eyes a commercial rebound after a dramatic revenue surge in 2025.

seekingalpha.com2026-05-28

Northrop Grumman Corporation (NOC) Presents at Bernstein 42nd Annual Strategic Decisions Conference Transcript

Northrop Grumman Corporation (NOC) Presents at Bernstein 42nd Annual Strategic Decisions Conference Transcript

zacks.com2026-05-26

BAESY vs. NOC: Which Defense Stock Offers Better Investment Potential?

BAE Systems and Northrop Grumman ride rising defense budgets, with new milestones, facility upgrades and radar deliveries shaping momentum.

seekingalpha.com2026-05-24

3 Elite Dividend Growth Stocks That Look Too Cheap To Ignore

Northrop Grumman, Home Depot, and McCormick & Company offer attractive risk/reward after significant underperformance versus the AI-driven market. NOC benefits from defense spending tailwinds, a robust order book, and a 1.7% yield, trading at 21x earnings with high-single-digit EPS growth expected. HD trades below its historical average P/E, maintains resilient guidance, and offers a 3.1% yield, with upside potential as housing stabilizes.

zacks.com2026-05-21

Northrop Grumman (NOC) Down 6.4% Since Last Earnings Report: Can It Rebound?

Northrop Grumman (NOC) reported earnings 30 days ago. What's next for the stock?

globenewswire.com2026-05-21

Northrop Grumman to Participate in Bernstein's 42nd Annual Strategic Decisions Conference

FALLS CHURCH, Va., May 21, 2026 (GLOBE NEWSWIRE) -- Northrop Grumman Corporation (NYSE: NOC) will participate in Bernstein's 42nd Annual Strategic Decisions Conference on Thursday, May 28. Kathy Warden, chair, chief executive officer and president, will present beginning at 10:00 a.m. Eastern time. The presentation will be webcast live at http://investor.northropgrumman.com .

247wallst.com2026-05-21

One-Fifth of SpaceX Revenue Comes From Uncle Sam: The Defense Contractors That Should Worry

SpaceX's S-1 just handed legacy defense investors a number they cannot ignore.

247wallst.com2026-05-20

Why Boeing Has the Most to Lose If Tesla and SpaceX Ever Combine

Gene Munster of Deepwater Asset Management and Elon Musk biographer Walter Isaacson have floated the idea that Tesla (NASDAQ: TSLA | TSLA Price Prediction) and SpaceX could combine within the next decade.

globenewswire.com2026-05-19

Northrop Grumman Board Declares Quarterly Dividend

FALLS CHURCH, Va., May 19, 2026 (GLOBE NEWSWIRE) -- The board of directors of Northrop Grumman Corporation (NYSE: NOC) declared a quarterly dividend of $2.47 per share on Northrop Grumman common stock, payable June 17, 2026, to shareholders of record as of the close of business June 1, 2026. Northrop Grumman continues to execute a disciplined capital allocation strategy that prioritizes investments in the manufacturing capabilities and capacity needed to deliver differentiating technologies quickly for our customers.

📊 AI Financial Analysis

Powered by StockMarketInfo
Earnings Data: Q Ending 2026-03-31

"NOC reported Revenue of $9.88B and Net Income of $0.88B (EPS $6.16) in 2026-03-31. YoY, Revenue grew +4.3% versus 2025-03-31, while Net Income surged +81.9% (EPS +85.0%). However, QoQ results weakened: Revenue declined -15.7% versus 2025-12-31 and Net Income fell -38.7% (EPS -38.4%), indicating margin volatility quarter-to-quarter. Profitability improved on a YoY basis: net income margin expanded to ~8.9% from ~5.1% a year ago, but contracted from ~12.2% in the prior quarter—suggesting operating leverage is less favorable in the most recent quarter. On the balance sheet, Total Assets decreased -2.7% QoQ, while Total Equity rose +2.6%. Most notably, net debt flipped to net cash (netDebt went from ~$15.4B at 2025-12-31 to -$0.19B at 2026-03-31), strengthening balance-sheet resilience. Shareholder returns look solid. The stock is up +23.8% over 1 year (>20% momentum), dividend yield is low (~0.34%), and share count modestly declined QoQ (~-1.7% vs 2025-03-31), implying ongoing capital returns. Consensus price targets ($737.85) suggest ~11% upside from the $665.26 price."

Revenue Growth

Fair

QoQ Revenue fell -15.7% ($11.71B to $9.88B) while YoY Revenue rose +4.3% ($9.47B to $9.88B), showing uneven recent momentum.

Profitability

Positive

Net margin improved YoY to ~8.9% from ~5.1%, but compressed QoQ (from ~12.2% to ~8.9%). EPS rose +85.0% YoY yet dropped -38.4% QoQ.

Cash Flow Quality

Good

Net debt swung to net cash at 2026-03-31, supporting financial flexibility. Dividend yield is small (~0.34%) and payout ratio (0.38) appears manageable.

Leverage & Balance Sheet

Good

Total assets declined -2.7% QoQ, equity increased +2.6%, and net debt improved dramatically (from ~$15.4B to net cash), indicating stronger balance-sheet resilience.

Shareholder Returns

Strong

Total return tailwind is strong: +23.8% 1Y price momentum (>20% boost). Dividend yield is modest, but share count trends lower, suggesting buyback support.

Analyst Sentiment & Valuation

Positive

Consensus target ($737.85) is above the current price ($665.26), implying ~11% potential upside; valuation looks supportive given improving YoY earnings.

Disclaimer:This analysis is AI-generated for informational purposes only. Accuracy is not guaranteed and this does not constitute financial advice.

Fundamentals Overview

Loading fundamentals overview...

Northrop Grumman’s Q1 2026 showed solid demand and momentum: sales of $9.9B (+4% YoY), organic +5%, bookings of $9.8B, and backlog of $96B. Earnings were supported by improved operating performance in Aeronautics and Defense Systems (AS margin 9.3% driven by absence of a prior B-21 loss provision; DS margin 10.8% with MS OM rate 15.1% on favorable adjustments). Guidance was reaffirmed: 2026 sales $43.5B-$44.0B, Q2 high-single-digit sequential growth, and segment operating margin low-to-mid 11%. The key upside driver is throughput expansion: a 25% annual B-21 production rate increase (with incremental 2026 CapEx of $200M; most investment 2027–2029) and an accelerated Sentinel pathway (Milestone B later this year; first flight 2027; IOC early 2030s). The main risk is timing/economics execution: supplier scaling and converting international demand into contracts remain the critical bottlenecks, potentially limiting movement from mid-single-digit growth toward double-digit outcomes until later in the decade.

AI IconGrowth Catalysts

  • Sentinel ramp: program acceleration targeting Milestone B later in 2026, first flight in 2027, initial operating capability early 2030s; Q1 already delivering double-digit growth
  • B-21 throughput acceleration: Air Force agreement to increase annual B-21 production rate by 25%, with revenue/production profile tied to facility completion (major 2027-2029 work)
  • Weapons/munitions scaling: tactical SRM production capacity already doubled; further expansion completing by 2027; weapons business nearing ~10% of total company sales
  • Missile defense expansion: missile defense nearly ~10% of company sales; Glide Phase Interceptor (GPI) award total contract value increased to $1.3B (post-quarter award to accelerate development)
  • Triad modernization demand: continued growth driven by modernization work and restricted programs; Airborne ISR/C2 and integrated battle command growth in Defense Systems

Business Development

  • Air Force agreement: increase B-21 annual production rate by 25%; includes customer funding in prior year reconciliation and agreement to sell an aircraft to accelerate revenue into Q1 without changing LRIP aircraft count
  • Air Force partnership on Sentinel: acceleration plan for Milestone B later this year; prototype missile launch silo tube started in Q1 to increase design fidelity
  • Air Force and supplier/industrial coordination: becoming a second source supplier of solid rocket motors on several programs; qualifying for additional systems including PAC-3
  • Artemis II: Northrop Grumman-built solid rocket motors provided 7.2 million pounds thrust (over 75% of SLS total thrust) for SLS mission (a demonstrated space capability / branding catalyst)
  • International contracting/work: relationship announced with a Hungarian company for Space Systems; expanding pipeline with expectation of international contribution becoming key over 5-10 years

AI IconFinancial Highlights

  • Q1 sales: $9.9B, up 4% YoY; organic sales +5%
  • Bookings: $9.8B in Q1; backlog ended at $96B (sales coverage over ~two years; near record per Q&A context)
  • EPS: diluted EPS $6.14 (up substantially vs prior year; no explicit consensus delta provided in transcript)
  • Segment margins: Aeronautics Systems operating margin improved to 9.3% (driven by absence of B-21 loss provision booked in 2025); overall DS margins improved to 10.8% (segment operating income >$1B)
  • Defense Systems (DS): Q1 operating margins at 9.7% with organic sales +10% (Sentinel ramp; tactical solid rocket motors; integrated battle command), partially offset by lower F/A-18 volume and offsets across mission programs
  • Mission Systems (MS): Q1 operating income +20%; OM rate 15.1% (driven by higher net favorable earnings adjustments)
  • Space headwinds: year-over-year sales/OP income down due to NGI contract closeout ($98M recognized last year) and unfavorable $71M earnings adjustment on GEM 63XL
  • 2026 guidance reaffirmed: full-year sales $43.5B-$44.0B; full-year segment operating income margin low-to-mid 11%; Q2 expects high-single-digit sequential sales growth
  • Capital/cash: CapEx guidance increased/confirmed at $1.85B for 2026 (reflects additional $200M for B-21 capacity); free cash flow guidance retained at $3.1B-$3.5B

AI IconCapital Funding

  • Repurchased? (no buyback amounts provided in transcript)
  • Debt: repaid $527M of fixed-rate debt in Q1; ending cash balance over $2B
  • CapEx: incremental $200M investment in 2026 tied to increased B-21 production capacity; total 2026 CapEx now expected $1.85B
  • Cash flow: Q1 cash use ~$1.8B; expects ramp through year with most significant cash generation in Q4; free cash flow guidance $3.1B-$3.5B despite higher CapEx

AI IconStrategy & Ops

  • Manufacturing scaling: opened >20 new facilities and added >2 million square feet of manufacturing space across the U.S. over last two years
  • B-21 execution economics: LRIP EAC unchanged materially; increased production costs on earlier lots offset by improved profitability on remainder; management expects margin expansion with maturing production/manufacturing capability
  • Weapons production flexibility: modular, adaptable SRM/munitions lines to flex across multiple products as demand shifts
  • Supply chain bottleneck mitigation: management described identifying bottlenecks and helping suppliers resource scaling/capacity (explicitly tied to ability to increase growth rate beyond mid-single digits)
  • International demand execution: emphasis on export approval acceleration and aggregating international demand; management expects most timing impact beyond 2026

AI IconMarket Outlook

  • 2026 sales: $43.5B-$44.0B (reaffirmed)
  • Q2 2026 sales: high-single-digit sequential growth expected
  • 2026 margins: low-to-mid 11% margin rate guided for segment operating income; margin expansion expected over year via performance, production timing, and mix
  • Sentinel timing (program milestones): Milestone B later in 2026; first flight 2027; initial operating capability early 2030s
  • B-21 facility/capacity: majority of capital execution expected 2027-2029; production facility completion drives revenue profile

AI IconRisks & Headwinds

  • Bottleneck risk: to reach double-digit growth, management cited need for suppliers to scale with the company; explicit work to remove supply-chain bottlenecks indicates execution risk
  • International conversion risk: longer cycle for international demand to become contracts; export approval/process maturation expected to impact beyond 2026
  • European buyer sensitivity: potential sensitivity to timelines for U.S. delivery amid growing demand; uncertainty could affect contracting cadence even with robust demand
  • Program competition: F/A-XX downselect risk discussed; need to deliver capacity on schedule (competitor cited by CNO as lacking capacity)
  • Space portfolio volatility: earnings adjustments (NGI closeout timing; GEM 63XL unfavorable adjustment) created year-over-year headwinds in Space segment
  • Cash flow pressure: higher 2026 CapEx for B-21 (additional $200M) offsets with working within maintained free cash flow guidance

Q&A: Analyst Interest

  • B-21 25% ramp mechanics: Management detailed that ~2026 CapEx is about $200M, while most spend lands in 2027–2029 with completion largely this decade. Revenue profile is tied to facility completion, and protections vs curtailment are framed as committed quantities plus potential program-of-record expansion by the Air Force.
  • Sentinel schedule acceleration: Analysts asked about IOC timing and progress. Management confirmed Milestone B later this year, enabling first flight in 2027 and initial operating capability early 2030s. They cited a series of design-maturation actions with the Air Force, including a prototype of the missile launch silo started in the quarter.
  • Path to double-digit growth: Analysts pressed on bottlenecks and what must occur beyond mid-single-digit sales growth. Management stated higher growth would require competitive wins, converting the missile-component demand into contracted production, scaling suppliers, and accelerating international demand conversion; timing is the primary uncertainty, especially given international conversion and supply-chain constraints.

Sentiment: MIXED

Note: This summary was synthesized by AI from the NOC Q1 2026 earnings transcript. Financial data is complex; please verify all metrics against official SEC filings before making investment decisions.

📋 Official Regulatory 10-K / 10-Q SEC Filings

Direct authenticated documentation links to audited SEC database reports for NOC.

SEC EDGAR Live Feed
Loading financial data and tables...
📁

SEC Filings (NOC)

© 2026 Stock Market Info — Northrop Grumman Corporation (NOC) Financial Profile