📘 NVR INC (NVR) — Investment Overview
🧩 Business Model Overview
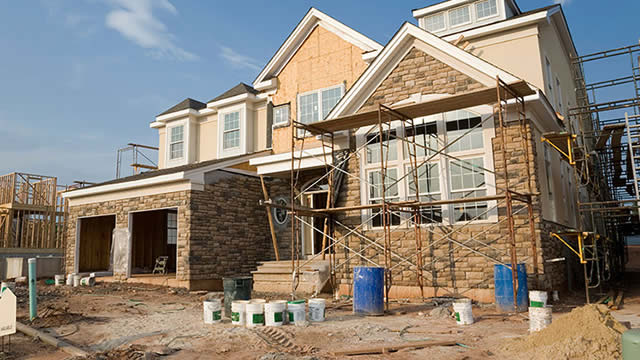
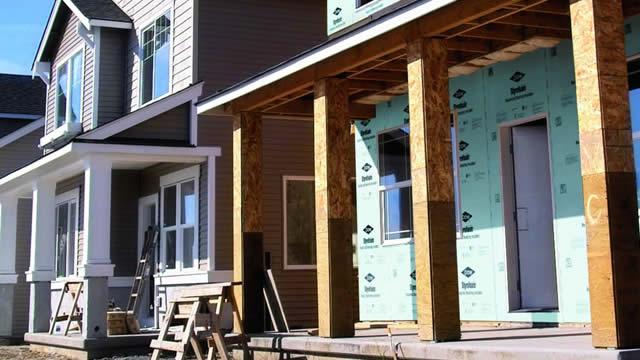
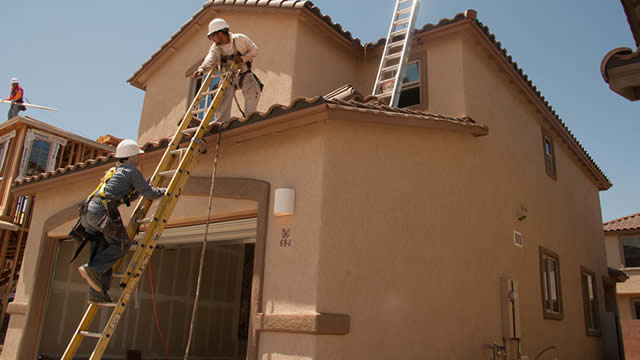
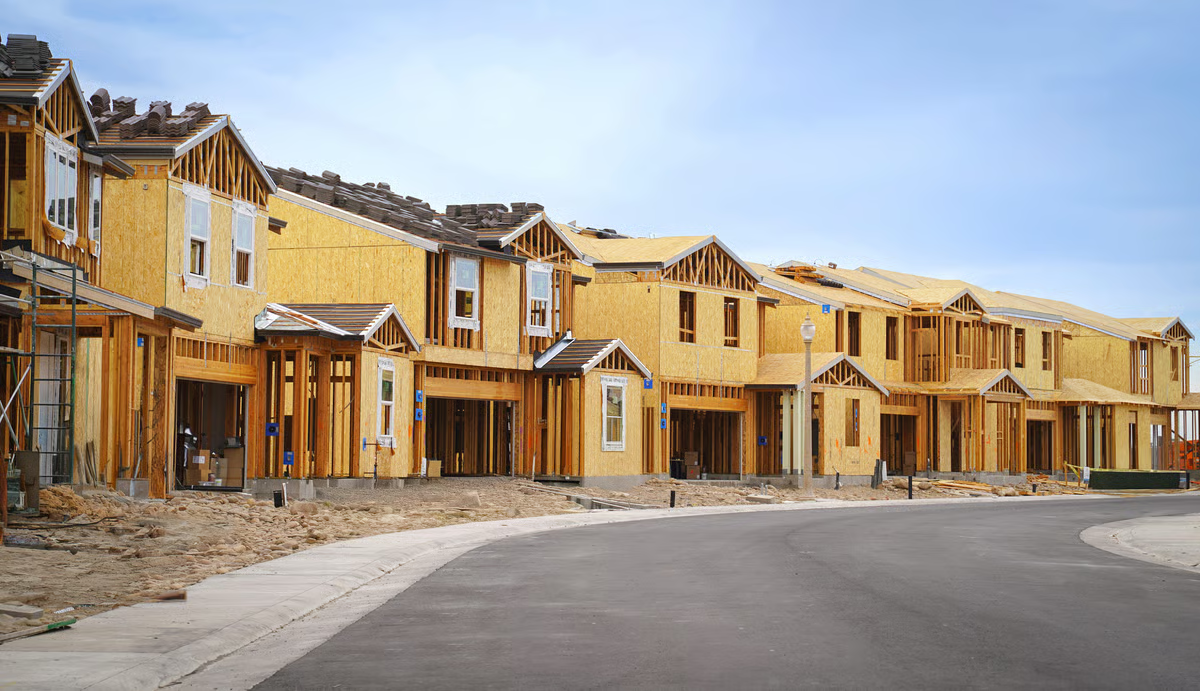
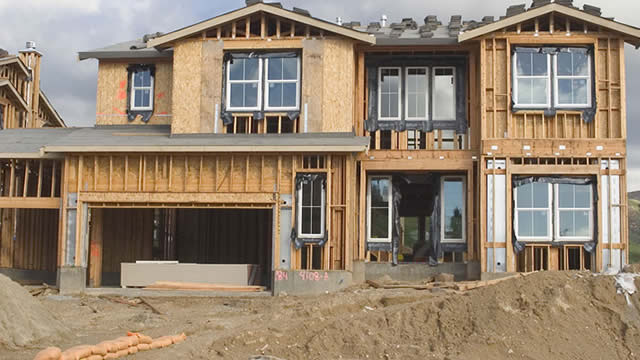
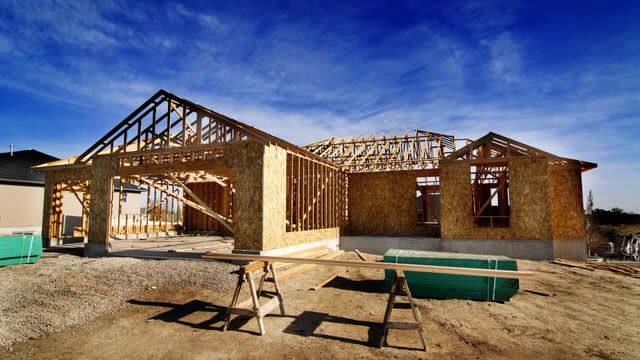
NVR is a U.S. homebuilder that converts land and entitled development opportunities into new, move-in-ready homes for retail buyers. The value chain is built around (1) sourcing and acquiring land in targeted geographies, (2) managing entitlement and development to control the timing and cost of “finished lots,” (3) producing homes through a repeatable construction process using established trade partners, and (4) selling homes largely on a build-to-order basis with controlled spec inventory. This operating model reduces exposure to long-duration unsold finished inventory while preserving the ability to respond to buyer demand through lot and plan selection, standardization of materials, and disciplined project execution.
💰 Revenue Streams & Monetisation Model
NVR’s monetisation is primarily transactional: revenue is recognized upon home deliveries/sales as buyers take possession. Margin is driven by the relationship between (1) achieved home selling prices, (2) construction and land carrying costs, and (3) operating efficiency (labor productivity, construction cycle time, and overhead discipline). Key profit levers include:
- Land cost basis and lot readiness: Acquisition terms and development execution influence the cost of “finished lots,” which can persist through multiple construction cycles.
- Construction cost control: Procurement scale, trade partner depth, and process consistency affect material and labor efficiency.
- Pricing discipline and mix: Home price realization depends on community positioning, product mix, and buyer demand elasticity.
While homebuilding is not a recurring-revenue model, NVR’s back-to-work and build pipeline dynamics create a degree of visibility through its backlog and land strategy, which helps smooth earnings relative to peers that carry heavier finished-inventory risk.
🧠 Competitive Advantages & Market Positioning
NVR’s moat is best described as a combination of geographic execution advantages and cost discipline, supported by operational know-how and capital allocation discipline.
- Geographic concentration & execution depth (cost advantage): Focused footprint allows repeatable development pipelines, stronger subcontractor relationships, and more consistent permitting and construction execution. This can reduce cycle-time friction and improve the effective cost of building.
- Land sourcing and lot economics (capital allocation advantage): Competitors can acquire land, but consistently translating land opportunities into finished lots at attractive basis and timing requires execution, network depth, and risk management.
- Process standardization (operating moat): Building practices, supplier relationships, and plan/material standardization can improve labor productivity and reduce rework, supporting more resilient margins through cost swings.
Competitive benchmarking:
- D.R. Horton and Lennar: broader national footprints. Their scale supports purchasing power and diversification, but execution economics may be less concentrated and can dilute the depth of local development relationships.
- PulteGroup: sizable scale with multi-market exposure and different community/product strategies.
Compared with these larger, wider-footprint builders, NVR’s positioning emphasizes concentrated market execution—where localized execution quality and land-to-production efficiency can be more defensible over cycles.
🚀 Multi-Year Growth Drivers
Over a 5–10 year horizon, NVR’s demand base is tied to housing needs, supply constraints, and household formation rather than technology or product obsolescence. Structural drivers include:
- Demographic housing demand: Household growth and ongoing replacement demand from aging housing stock sustain long-term demand for new housing.
- Housing supply undersupply in many submarkets: Planning, permitting, and development constraints often slow incremental housing supply, supporting favorable long-run pricing for well-located communities.
- Migration and regional economic pull: Target geographies that retain population draw can benefit from sustained demand for new homes.
- Operational compounding through disciplined land strategy: Successful conversion of land opportunities into profitable communities can compound through repeatable processes and improved return on invested capital.
These factors do not eliminate cyclicality, but they influence the balance between long-run demand and supply responsiveness, which is central to homebuilder profitability.
⚠ Risk Factors to Monitor
- Interest-rate and affordability sensitivity: Mortgage rate movements can alter buyer affordability and change the timing/volume of demand.
- Construction input volatility: Labor availability, material cost swings, and logistics constraints can pressure margins without guaranteed pricing offsets.
- Land and development timing risk: Entitlement delays, higher-than-expected carrying costs, or changing local demand can reduce land investment returns.
- Concentration risk: A more focused geographic footprint can increase exposure to local economic shocks or slower housing turnover in specific regions.
- Execution risk: Construction productivity, warranty exposure, and project delays can impair profitability and reputation with trade partners and buyers.
📊 Valuation & Market View
The market typically values homebuilders as cyclical operators, with valuation levels driven more by earnings power through the cycle than by stable, long-duration cash flows. Common frameworks include valuation multiples tied to earnings or enterprise value, but the primary drivers that move investor decisions are:
- Margin trajectory sensitivity: Gross margins and operating leverage respond to pricing realizations, cost inflation, and labor productivity.
- Balance-sheet and liquidity profile: Homebuilders’ access to capital, working capital needs, and land pipeline funding shape downside resilience.
- Land pipeline quality: The future profitability of deliverable communities depends on land basis, development progress, and expected selling price ranges.
In institutional practice, the most durable valuation work focuses on the sustainability of returns on capital and the ability to defend margins during cost and pricing swings.
🔍 Investment Takeaway
NVR’s long-term investment case rests on operational and geographic execution advantages that translate land opportunities into profitable communities. The moat is primarily cost discipline and localized know-how—supported by process standardization and a developed trade ecosystem—rather than a financial or software-like switching-cost mechanism. For investors, the key is underwriting the cycle: demand stability supported by supply constraints, disciplined land conversion, and margin durability through construction input volatility.
⚠ AI-generated — informational only. Validate using filings before investing.