O-I Glass, Inc.

O-I Glass, Inc. (OI) Market Cap

O-I Glass, Inc. has a market capitalization of $1.10B.

Price: $7.15

-0.20 (-2.72%)

Market Cap: 1.10B

NYSE · time unavailable

CEO: Gordon J. Hardie

Sector: Consumer Cyclical

Industry: Packaging & Containers

IPO Date: 1991-12-11

Website: https://www.o-i.com

O-I Glass, Inc. (OI) - Company Information

Market Cap: 1.10B|Sector: Consumer Cyclical

Company Profile

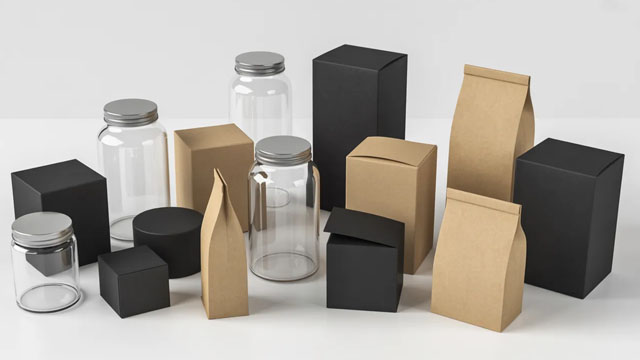
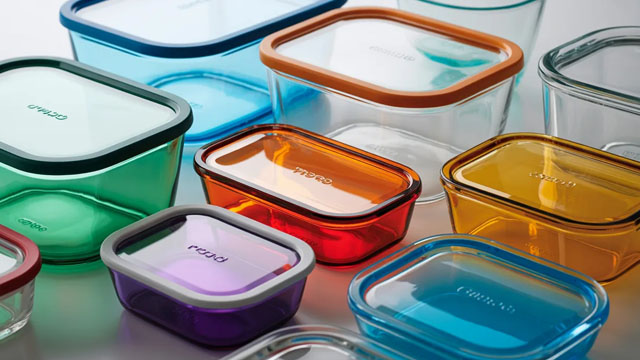
O-I Glass, Inc., through its various subsidiaries, is dedicated to the manufacturing and global distribution of glass packaging. The company primarily furnishes glass containers to businesses in the food and beverage industries across the Americas, Europe, and the Asia Pacific regions. Their product offerings encompass glass bottles and jars specifically designed for alcoholic beverages, such as beer, spirits, wine, and flavored malt beverages. Additionally, they provide glass packaging solutions for a range of other products, including various food items, soft drinks, teas, juices, and pharmaceutical goods. O-I Glass ensures a comprehensive selection of glass containers, available in diverse sizes, unique shapes, and a wide spectrum of colors to meet client specifications. The company facilitates sales directly to its customers, often secured through multi-year supply contracts, and also leverages a network of distributors. Founded in 1903, O-I Glass, Inc. maintains its corporate headquarters in Perrysburg, Ohio.

Analyst Sentiment

82%
Strong Buy

From 10 Active Polls

1Y Forecast: $13.08

▲ +82.9% Potential Upside

Consensus Target Metrics

Low Bound

$9

Median

$13

High Bound

$21

Average

$13

Price & Moving Averages

Loading chart...

🎯 Wall Street Analyst Intelligence Report

1-Year structural target targets, chart projections, and sentiment maps.

Average 1Y Target
$13.08
▲ +82.94% Upside
Low Target
$8.50
19% Risk
Median Target
$12.50
75% Mid
High Target
$21.00
194% Max
Consensus
Hold
9 / 23 Buys

Consensus Trend Projection

Trailing closures vs. 12-month metrics map.

Analyst Vote Distribution

Aggregate institutional coverage sentiment weights.

📊 Historical Valuation Multiples

Real-time Trailing Twelve Month (TTM) momentum side-by-side with discrete quarterly metrics.

Fiscal QuarterTTMQ2 2026Q1 2026Q4 2025Q3 2025Q2 2025Q1 2025Q4 2024Q3 2024
Period EndingTrailing 12MJun 30, 2026Mar 31, 2026Dec 31, 2025Sep 30, 2025Jun 30, 2025Mar 31, 2025Dec 31, 2024Sep 30, 2024
Market Cap ($M)1,0961,4741,6052,2572,0482,2701,7631,6702,029
Enterprise Value ($M)5,7436,1216,2486,4976,6086,9176,3515,9056,520
Price to Earnings Ratio (P/E)-0.95-0.38-5.47-4.1017.07-122.83-28.68-2.71-6.31
Price/Earnings-to-Growth Ratio (PEG)-0.05-2.05-13.85-11.54
Price to Sales Ratio (P/S)0.170.881.041.501.241.331.131.091.21
Price to Book Ratio (P/B)2.863.851.261.741.541.841.581.551.50
Price to Free Cash Flow Ratio (P/FCF)-78.29-1474.29-3.687.3117.9644.51-5.767.9536.88
Enterprise Value to Sales (EV/Sales)3.674.064.334.004.054.053.863.88
Enterprise Value to EBITDA (EV/EBITDA)7.6524.2943.0982.2524.0332.6329.2788.1341.53
Debt to Equity Ratio6.1913.023.893.863.864.154.504.613.89

📘 Full Research Report

ℹ️

AI-Generated Research: This report is for informational purposes only.

📘 O I GLASS INC (OI) — Investment Overview

🧩 Business Model Overview

O-I Glass manufactures glass packaging—primarily bottles and jars—for beverage, food, and specialty end markets. The value chain is driven by energy-intensive batch melting, followed by high-throughput forming, decorating, and finishing. Production is organized around a geographically distributed footprint, enabling O-I to serve large customers with shorter freight distances and more reliable supply.

Customer stickiness is reinforced through product qualification processes (bottle/jar specifications, tolerances, and line compatibility), tooling and engineering know-how, and recurring ordering patterns tied to brand and SKU stability. While glass packaging is a “manufactured commodity,” O-I competes on the ability to deliver consistent quality at competitive delivered cost, often supported by long-term customer relationships and regional capacity planning.

💰 Revenue Streams & Monetisation Model

Revenue is predominantly transactional: glass containers sold to packaging buyers and intermediaries, typically under negotiated pricing structures that reflect commodity inputs and freight, along with service-level requirements. Monetisation is driven by:

  • Price realization versus input costs: spreads from managing natural gas/electricity intensity, cullet availability, and batch chemistry costs.
  • Production efficiency and utilization: furnace throughput and yield improvements that convert fixed costs into higher contribution margin.
  • Mix and value-added capabilities: decorated, higher-spec containers and specialty glass formats can support better margins than plain commodity shapes.

Although revenue is not recurring in a SaaS sense, customer programs and repeated SKU demand can behave like “sticky” volume, with pricing and service contracts often serving as a stabilizer during normal demand cycles.

🧠 Competitive Advantages & Market Positioning

O-I’s moat is best described as a combination of cost and operational scale advantages plus practical switching costs from packaging qualification and line integration.

  • Switching Costs / Qualification Barriers: Once a container is qualified for a customer’s filling lines and brand standards, changing formats typically requires re-engineering, line trials, and procurement transitions, discouraging short-cycle switching.
  • Cost Advantages via Scale and Efficiency: Glass is capital- and energy-intensive. Large, efficiently run furnace systems and optimized logistics spread fixed costs and reduce per-unit energy and labor intensity.
  • Geographic Cost and Logistics Advantage: A plant network close to major customers reduces freight and helps manage service reliability—an important factor when production disruptions are costly.
  • Material Economics from Recycling (Cullet): Competitive access to cullet and the ability to run cullet-rich recipes can lower batch costs and support sustainability-driven customer requirements.

Competitive benchmarking (primary rivals):

  • Verallia — strong presence in glass packaging, competing through regional cost positions and customer service.
  • Vitro — notable in glass container manufacturing, with emphasis on efficient production and customer relationships in its served geographies.
  • Saint-Gobain (containers/packaging businesses in relevant areas) — competes across packaging applications and can overlap on certain container segments depending on region.

Compared with these peers, O-I’s positioning emphasizes a broad, multi-region manufacturing network and the operational discipline required to run furnaces efficiently—key to cost leadership in an energy-intensive product category. The competitive landscape is less about brand premium and more about delivered cost, reliability, and qualification-driven supply continuity.

🚀 Multi-Year Growth Drivers

Over a 5–10 year horizon, growth and value creation depend more on market structure and margin durability than on one-off product cycles:

  • Sustainability and recycled content mandates: Regulatory and customer requirements for recyclability and recycled material content favor glass’s recyclability profile and the ability to use cullet.
  • Lightweighting and process improvements: Engineering advances that maintain strength while reducing material usage can improve cost-per-unit and support competitive bids.
  • Geographic demand growth: Population and consumption growth in emerging markets expand the addressable base for beverage and food packaging, where regional manufacturing footprint matters.
  • Share shifts within packaging: In certain applications, glass can gain share versus alternative materials due to taste quality perceptions, recyclability outcomes, and specific end-market preferences.
  • Customer-driven service requirements: Large brands increasingly value supply reliability and quality consistency, supporting incumbents that can manage capacity and furnace uptime.

⚠ Risk Factors to Monitor

  • Energy and utility cost volatility: Glass production depends heavily on energy; margins can compress if energy prices rise faster than container pricing.
  • Furnace downtime and operational execution: Maintenance cycles, defects, and unplanned outages can reduce utilization and increase costs.
  • Demand cyclicality: End markets (beverages, food, alcohol) can soften, lowering volumes and pressuring fixed-cost absorption.
  • Commodity input swings: Costs and availability of soda ash, silica inputs, and cullet logistics can move container economics.
  • Capital intensity and competitive capacity: New capacity or aggressive expansions in the industry can intensify price competition.
  • Regulatory and carbon-transition requirements: Emissions regulations and permitting constraints may increase capex or operating costs.

📊 Valuation & Market View

Glass packaging is typically valued on an asset- and cycle-aware basis, with the market focusing on cash generation capacity rather than growth-rate narratives. Common reference metrics include EV/EBITDA and enterprise value relative to normalized earnings, reflecting the industry’s capital intensity.

Key valuation drivers include: furnace utilization and yield, energy efficiency improvements, pricing discipline (spreads between container prices and input costs), and the sustainability of free cash flow after maintenance and strategic capital expenditures.

🔍 Investment Takeaway

O-I Glass offers an institutional-grade thesis centered on operational scale, furnace efficiency, and geographic logistics that translate into durable cost advantages, reinforced by practical switching costs from packaging qualification and SKU stability. The investment case is strongest when the industry environment supports pricing discipline and utilization, while the longer-term outlook is supported by sustainability tailwinds and the ongoing role of reliable, local manufacturing in glass packaging.


⚠ AI-generated — informational only. Validate using filings before investing.

📰 Market News & Coverage

15 Stories Available

Real-time institutional reporting and market updates for OI.

zacks.com2026-07-31

2 Glass Products Stocks to Watch in a Promising Industry

Solid end-market demand and focus on unveiling innovative products will aid the Zacks Glass Products industry's growth. This bodes well for stocks like OI and APOG.

prnewswire.com2026-07-31

OI SHAREHOLDER INVESTIGATION: SueWallSt Notifies Investors of Potential Securities Claims Involving O-I Glass

/PRNewswire/ -- Two numbers now sit side by side for O-I Glass (NYSE: OI) shareholders: $1.00 to $1.50, the full-year adjusted EPS range management put in

prnewswire.com2026-07-30

O-I Glass Investigation Notice: Levi & Korsinsky Notifies Investors of Pending Investigation Into O-I Glass (OI)

O-I Glass guided FY 2026 adjusted EBITDA of $1.25 billion to $1.30 billion in February. Shares fell roughly 15% on July 29, 2026 after the Company cut full-year guidance for the second consecutive quarter.

marketbeat.com2026-07-30

O-I Glass Q2 Earnings Call Highlights

O-I Glass NYSE: OI reported second-quarter results that fell below its expectations, as strong performance in the Americas was more than offset by a steep decline in Europe. The company said it is maintaining its strategic direction but has reduced its 2026 outlook and recalibrated its 2027 targets to reflect a slower improvement path in its European operations.

defenseworld.net2026-07-30

O-I Glass (NYSE:OI) Sets New 1-Year Low After Earnings Miss

O-I Glass, Inc. (NYSE: OI - Get Free Report) shares reached a new 52-week low during mid-day trading on Wednesday following a weaker than expected earnings announcement. The company traded as low as $7.67 and last traded at $7.6930, with a volume of 99249 shares changing hands. The stock had previously closed at $9.06. The industrial

seekingalpha.com2026-07-29

O-I Glass, Inc. (OI) Q2 2026 Earnings Call Transcript

O-I Glass, Inc. (OI) Q2 2026 Earnings Call Transcript

fool.com2026-07-29

Why O-I Glass Stock Was Falling Today

Problems in Europe weighed on profits.

zacks.com2026-07-28

O-I Glass (OI) Q2 Earnings: Taking a Look at Key Metrics Versus Estimates

The headline numbers for O-I Glass (OI) give insight into how the company performed in the quarter ended June 2026, but it may be worthwhile to compare some of its key metrics to Wall Street estimates and the year-ago actuals.

zacks.com2026-07-28

O-I Glass (OI) Q2 Earnings Lag Estimates

O-I Glass (OI) came out with quarterly earnings of $0.09 per share, missing the Zacks Consensus Estimate of $0.22 per share. This compares to earnings of $0.53 per share a year ago.

globenewswire.com2026-07-28

O-I Glass Reports Second Quarter 2026 Results

PERRYSBURG, Ohio, July 28, 2026 (GLOBE NEWSWIRE) -- O-I Glass, Inc. (NYSE: OI) today announced its financial results for the second quarter ended June 30, 2026. Please follow the links below to view our second quarter 2026 earnings documents. O-I Glass Second Quarter 2026 Earnings Release and Financial TablesO-I Glass Second Quarter 2026 Earnings Presentation O-I CEO Gordon Hardie and CFO John Haudrich will conduct a conference call to discuss the company's latest results on Wednesday, July 29, 2026, at 8:00 a.

globenewswire.com2026-07-28

O-I Glass Reports Second Quarter 2026 Results

PERRYSBURG, Ohio, July 28, 2026 (GLOBE NEWSWIRE) -- O-I Glass, Inc. (NYSE: OI) today announced its financial results for the second quarter ended June 30, 2026.

zacks.com2026-07-21

Earnings Preview: O-I Glass (OI) Q2 Earnings Expected to Decline

O-I Glass (OI) doesn't possess the right combination of the two key ingredients for a likely earnings beat in its upcoming report. Get prepared with the key expectations.

globenewswire.com2026-07-09

O-I Glass Announces Second Quarter 2026 Earnings Conference Call and Webcast

PERRYSBURG, Ohio, July 09, 2026 (GLOBE NEWSWIRE) -- O-I Glass, Inc. (NYSE: OI) has scheduled its second quarter 2026 conference call and webcast for Wednesday, July 29, 2026, at 8 a.m. EDT. The Company's news release for the second quarter 2026 earnings will be issued after the market closes on Tuesday, July 28.

globenewswire.com2026-07-09

O-I Glass Announces Second Quarter 2026 Earnings Conference Call and Webcast

PERRYSBURG, Ohio, July 09, 2026 (GLOBE NEWSWIRE) -- O-I Glass, Inc. (NYSE: OI) has scheduled its second quarter 2026 conference call and webcast for Wednesday, July 29, 2026, at 8 a. m. EDT. The Company's news release for the second quarter 2026 earnings will be issued after the market closes on Tuesday, July 28.

gurufocus.com2026-07-06

Intercontinental Exchange Reports June and Second Quarter 2026 Statistics

Intercontinental Exchange, Inc. (NYSE: ICE), one of the world's leading providers of financial market technology and data powering global capital markets, today

📊 AI Financial Analysis

Powered by StockMarketInfo
Earnings Data: Q Ending 2026-06-30

"OI reported Q2’26 Revenue of $1.667B, down -0.4% QoQ ($1.540B in Q1’26) but down -2.3% YoY (vs. $1.706B in Q2’25). Net income was -$651M in Q2’26 versus -$73M in Q1’26 (margin deterioration) and versus -$0.005M in Q2’25 (a sharp YoY decline). EPS fell to -$4.25 from -$0.48 QoQ and -$0.03 YoY. Profitability is deteriorating across the board: gross margin slipped to 12.8% from 13.0% QoQ and far below 17.5% in Q2’25; operating margin rose to 7.8% QoQ (from 5.9%) but remains structurally weaker than earlier quarters, while net margin is deeply negative (-39.1%), reflecting large below-the-line losses. Cash flow performance improved materially on a quarterly basis: operating cash flow was $94M in Q2’26 (vs. -$294M in Q1’26) and free cash flow also $94M. However, balance sheet stress appears elevated—total assets were $8.09B and net debt remains high at about $4.65B, while equity is $1.35B. Shareholder returns are mixed given price weakness (only +0.65% over 1Y, with negative YTD and 6M), and with no dividends indicated and no buybacks reported in the quarter, total shareholder return is likely constrained."

Revenue Growth

Caution

Revenue declined -0.4% QoQ and -2.3% YoY, indicating mild contraction and no clear top-line momentum.

Profitability

Neutral

Net income deteriorated to -$651M in Q2’26 from -$73M QoQ and -$0.005M YoY; net margin is -39.1% versus -4.7% QoQ and -0.3% YoY. Gross margin also compressed vs Q2’25 (12.8% vs 17.5%).

Cash Flow Quality

Fair

Operating cash flow improved to +$94M in Q2’26 from -$294M QoQ; free cash flow was +$94M. However, earnings remain heavily negative and cash conversion is not yet consistent.

Leverage & Balance Sheet

Caution

Assets were $8.09B with equity at $1.35B; net debt remains high (~$4.65B). Current liquidity is adequate (current ratio ~1.26) but leverage looks elevated.

Shareholder Returns

Caution

No dividend activity is shown and no buybacks reported in Q2’26. Price momentum is not strong (+0.65% 1Y), with negative YTD (-28.17%), limiting total shareholder return.

Analyst Sentiment & Valuation

Neutral

Consensus target ($15.4) is above the current price ($10.89), but valuation metrics are distorted by losses (negative EPS). Without price momentum, upside confidence is tempered.

Disclaimer:This analysis is AI-generated for informational purposes only. Accuracy is not guaranteed and this does not constitute financial advice.

Fundamentals Overview

Loading fundamentals overview...

O-I’s Q1 2026 results were weak versus expectations despite flat net sales. Adjusted EPS was $0.05 (down from $0.40 in Q1’25) as Europe absorbed the brunt of commercial pressure: breakeven segment profit, a ~$68m YoY decline, and a $76m net price reduction from competition plus expired favorable energy contracts. Management highlighted Fit to Win progress as the main counterweight ($50m gross / $35m net benefits in Q1) and reaffirmed at least $275m benefits in 2026, with $750m cumulative through 2027 already on track. The company updated full-year guidance to $1.00–$1.50/share, mainly due to energy inflation risk totaling $75m–$100m and incremental up to $25m Europe risk-adjustment. However, volume trends improved by March (down 2% vs prior year) and new go-to-market wins are expected to add ~1.5% annualized volume starting in 2H. Turnaround confidence centers on sequential recovery in Europe and operational restructuring completion by mid-2026, supported by ~75%–80% gas protection.

AI IconGrowth Catalysts

  • Fit to Win embedded disciplines driving $50m gross / $35m net benefits in Q1 and accelerating procurement/energy savings in Phase B
  • Sequential volume improvement in Q1: March volumes down only 2% vs prior year and improving as exited Q1
  • New go-to-market approach driving 15 confirmed incremental account wins contributing ~1.5% of new sales volume starting in 2H26
  • Americas moving into “profitable growth horizon” as customers return and capacity/demand tighten; evaluation of bringing dormant capacity back online

Business Development

  • 15 confirmed incremental volume wins across categories (announced as 70%–75% Americas / 25%–30% Europe for the annualized 1.5% volume contribution)
  • RTD market entry in North America enabled by last year’s regulation change; first-time inroads referenced
  • Brazil outperformance across beer (mid-single digits), NAB (mid-single digits), food & spirits (low teens); Andean delivers mid-single-digit growth and advanced execution
  • Europe new wins most advanced in North Central Europe (Nordics/Germany/Poland), supporting food and NAB growth and competitiveness

AI IconFinancial Highlights

  • Q1 adjusted EPS $0.05, below original expectations; management cited commercial headwinds including unfavorable net price and lower volumes
  • Q1 net sales $1.54B essentially flat Y/Y; favorable FX offset lower ASPs and a high-single-digit volume decline; shipments improved meaningfully through the quarter
  • Adjusted earnings declined materially vs prior year: $0.05 vs $0.40, driven by commercial pressures; operating costs comparable due to Fit to Win offsetting disruptions
  • Europe profitability compression: Europe segment operating profit breakeven vs ~$68m lower vs prior year; $76m reduction in net price (price competition + expired favorable energy contracts)
  • Fit to Win partially offset Europe: absorbed $5m higher-than-expected temporary plant closure expenses yet still cited cost benefit contribution
  • Tax: Q1 reflected unusually high effective tax rate on low pretax earnings; full-year tax rate guidance ~35%–40% with potential to move lower in 2027+
  • Energy macro sensitivity and protection: guidance updated for energy inflation from Middle East conflicts totaling $75m–$100m (macro-driven cost impact)
  • Energy hedging/coverage: ~75%–80% of gas requirements protected at favorable prices; balance sheet described as “significant liquidity” and “low” secured ratio

AI IconCapital Funding

  • Liquidity: $1.5B liquidity cited
  • Secured debt covenants: management stated “very, very low on our secured ratio” and “not anywhere near at risk”; no specific buyback or net debt amounts disclosed in transcript

AI IconStrategy & Ops

  • Fit to Win: halfway point to $750m cumulative benefits through 2027; ahead of schedule; Q1 gross Fit to Win ~$50m, net $35m
  • Phase A (SG&A streamlining and initial network optimization): $32m net benefits in Q1 despite Europe transition costs; organizational actions/capacity closures largely completed by mid-2026
  • Phase B (end-to-end value chain transformation): “slightly up” after absorbing Americas disruption costs; launched third wave of total organization effectiveness; accelerating procurement and energy initiatives
  • Europe network restructuring: temporary transition costs tied to closure of three plants in Europe; disruption-related plant closure expenses +$5m in Europe quarter
  • Capacity rationalization: European excess capacity reduced from ~13%–14% historically to low single digits by early 2026; continuing completion in coming months

AI IconMarket Outlook

  • Full-year 2026 adjusted earnings guidance updated to $1.00–$1.50 per share
  • Volume outlook: full-year sales volumes expected about flat Y/Y; shipments stable in 2Q and low-to-mid single-digit growth in 2H26
  • Europe risk-adjustment: updated outlook includes up to $25m reduction given elevated competitive pressures, net of additional cost actions/restructuring
  • Energy inflation assumption range: $75m–$100m for 2026
  • Energy sensitivity for European natural gas assumption (EUR/MWh): assumed EUR 45–55; $0.05 EPS per EUR 5 MWh change within range (~$12m EBITDA); above EUR 55 protection ~ $0.02–$0.03 EPS (~$5m risk)

AI IconRisks & Headwinds

  • Europe: elevated competitive pressure and lower capacity utilization resulting in price compression; noted especially wine in Southern Europe and overcapacity
  • Energy inflation macro risk from Middle East conflicts: total $75m–$100m potential 2026 cost drag (partially protected via hedging)
  • Unusually high effective tax rate on low pretax earnings in Q1; full-year normalized ~35%–40% but creates quarter volatility
  • Customer inventory adjustments in spirits impacting North America/Mexico shipments
  • Specific disruption-related costs in Americas: $10m (extreme weather, civil unrest in Mexico, natural gas pipeline failure in Peru), partially offset by Fit to Win

Q&A: Analyst Interest

  • Fit to Win timing vs contribution gap: Management stated Q1 was in-line with expectations and recognized “once-off” external winter disruptions and Europe closure/reconfiguration costs. They emphasized weekly tracking/accountability, claimed Phase B is on plan, and reiterated confidence in at least $275m benefits in 2026, potentially higher via waste-stripping.
  • Energy sensitivity and earnings protection/secured covenant risk: Management assumed 75%–80% gas coverage with EUR 45–55/MWh. They quantified: each EUR 5 drop adds ~ $0.05 EPS (~$12m EBITDA); above EUR 55 only ~$0.02–$0.03 (~$5m) risk. They also said liquidity is $1.5B and secured ratio is “very favorable,” not near covenant risk.
  • 2Q volume trajectory and what’s driving the turnaround: Management described Europe as the slowest hemisphere but expecting sequential improvement: Europe forecast “up low single digits” in Q2, then low-to-mid single digits in 2H. They cited regional winners (UK spirits mid-single digits; Nordics/Germany/Poland food/NAB above mid-single digits) and persistent weakness in Southwest/Southeast wine.

Sentiment: CAUTIOUS

Note: This summary was synthesized by AI from the OI Q1 2026 earnings transcript. Financial data is complex; please verify all metrics against official SEC filings before making investment decisions.

📋 Official Regulatory 10-K / 10-Q SEC Filings

Direct authenticated documentation links to audited SEC database reports for OI.

SEC EDGAR Live Feed
Loading financial data and tables...
📁

SEC Filings (OI)

© 2026 Stock Market Info — O-I Glass, Inc. (OI) Financial Profile