OneWater Marine Inc.

OneWater Marine Inc. (ONEW) Market Cap

OneWater Marine Inc. has a market capitalization of $203.6M.

Price: $12.25

-0.15 (-1.21%)

Market Cap: 203.56M

NASDAQ · time unavailable

CEO: Anthony K. Aisquith

Sector: Consumer Cyclical

Industry: Specialty Retail

IPO Date: 2020-02-07

Website: https://www.onewatermarine.com

OneWater Marine Inc. (ONEW) - Company Information

Market Cap: 203.56M|Sector: Consumer Cyclical

Company Profile

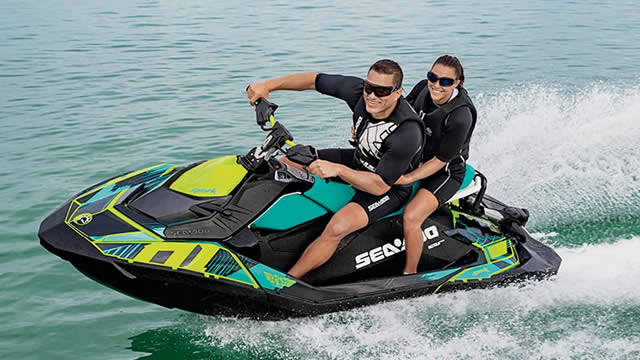
OneWater Marine Inc. is a prominent retailer specializing in recreational boats and marine lifestyle products across the United States. Its extensive inventory includes both brand-new and pre-owned recreational boats and luxury yachts, complemented by a comprehensive range of marine parts and accessories. Beyond sales, the company offers essential boat repair and maintenance services. Customers can also access support for boat financing and insurance arrangements. Furthermore, OneWater Marine provides a suite of ancillary offerings such as indoor and outdoor storage solutions, marina services, and rentals of boats and personal watercraft. As of September 30, 2021, the company's operational footprint spanned 70 retail locations situated across 11 U.S. states, including key markets like Texas, Florida, Alabama, North Carolina, South Carolina, Georgia, Ohio, and New Jersey. Founded in 2014, OneWater Marine Inc. maintains its corporate headquarters in Buford, Georgia.

Analyst Sentiment

67%
Buy

From 6 Active Polls

1Y Forecast: $13.33

▲ +8.8% Potential Upside

Consensus Target Metrics

Low Bound

$13

Median

$13

High Bound

$14

Average

$13

Price & Moving Averages

Loading chart...

🎯 Wall Street Analyst Intelligence Report

1-Year structural target targets, chart projections, and sentiment maps.

Average 1Y Target
$13.33
▲ +8.82% Upside
Low Target
$13.00
6% Risk
Median Target
$13.00
6% Mid
High Target
$14.00
14% Max
Consensus
Buy
6 / 9 Buys

Consensus Trend Projection

Trailing closures vs. 12-month metrics map.

Analyst Vote Distribution

Aggregate institutional coverage sentiment weights.

📊 Historical Valuation Multiples

Real-time Trailing Twelve Month (TTM) momentum side-by-side with discrete quarterly metrics.

Fiscal QuarterTTMQ2 2026Q1 2026Q4 2025Q3 2025Q2 2025Q1 2025Q4 2024Q3 2024
Period EndingTrailing 12MJun 30, 2026Mar 31, 2026Dec 31, 2025Sep 30, 2025Jun 30, 2025Mar 31, 2025Dec 31, 2024Sep 30, 2024
Market Cap ($M)204187157179259218258258349
Enterprise Value ($M)6856681,0401,2751,1591,1381,2661,2931,340
Price to Earnings Ratio (P/E)-1.644.03-3.03-5.76-0.575.07-175.87-5.36-9.49
Price/Earnings-to-Growth Ratio (PEG)0.20-0.190.35-6.14
Price to Sales Ratio (P/S)0.110.350.350.470.560.400.530.690.92
Price to Book Ratio (P/B)0.710.650.580.640.910.560.680.730.97
Price to Free Cash Flow Ratio (P/FCF)3.192.213.14-2.2835.962.4610.86-6.3815.15
Enterprise Value to Sales (EV/Sales)1.262.353.352.522.062.623.443.55
Enterprise Value to EBITDA (EV/EBITDA)-7.5620.3796.732932.01-8.6130.7255.89211.23118.56
Debt to Equity Ratio-5.311.923.534.073.382.522.822.982.79

📘 Full Research Report

ℹ️

AI-Generated Research: This report is for informational purposes only.

📘 ONEWATER MARINE CLASS A INC (ONEW) — Investment Overview

🧩 Business Model Overview

ONEW is a marine retail and services operator built around a dealer-style value chain. The company sources inventory (boats, engines, and related equipment), sells to end customers through its dealership footprint and supporting digital channels, and monetizes post-sale usage through service, parts, and accessories. The economics are supported by the repeat nature of maintenance/repair work and the customer’s ongoing need for OEM parts, accessories, and periodic upgrades tied to boat ownership.

Operationally, the model depends on (i) access to inventory from manufacturer partners, (ii) execution in showroom sales and service operations, and (iii) effective parts/service throughput that stabilizes cash flows relative to purely transactional retail.

💰 Revenue Streams & Monetisation Model

Revenue is typically composed of a mix of:

  • Retail sales of boats and engines (primarily transactional; more cyclical with consumer discretionary demand and financing conditions).
  • Service and maintenance (more recurring than new-unit sales; supported by installation and routine upkeep demands).
  • Parts and accessories (often higher-frequency purchases; benefits from installed base and OEM part compatibility).
  • Financing/ancillary income associated with customer transactions (where applicable through dealership ecosystems).

Margin drivers usually include service/parts mix (tends to be structurally steadier), gross margin on unit sales, labor utilization in service, and operational discipline in inventory handling. Because boat/engine sales are subject to inventory levels and customer financing availability, parts and service profitability are important for overall earnings durability.

🧠 Competitive Advantages & Market Positioning

ONEW’s moat is best characterized as scale-enabled distribution of OEM products plus customer stickiness created by installed-base service needs. While switching costs are not “software-like,” boat ownership creates practical friction:

  • Installed-base pull (service and parts): customers returning for maintenance/repairs and OEM-compatible parts are less likely to switch providers after equipment is placed and serviced.
  • Operational scale: multi-location purchasing, centralized sourcing practices, and service capacity allow better utilization and cost absorption than isolated dealers.
  • Relationship-driven access to brands: consistent execution can support manufacturer confidence, product allocation, and dealership standing (a meaningful barrier for new entrants).

Competitive benchmarking:

  • MarineMax (HZO): a larger, multi-market marine retailer with similar exposure to boat sales and services. The competitive difference is often dealership footprint, service capacity, and brand/product allocation outcomes by market.
  • West Marine (WMG): focused more on parts/accessories and marine supplies than on full dealership franchise models. ONEW’s positioning emphasizes dealer ecosystem economics (sales plus service) rather than retail specialty distribution alone.
  • Independent regional marine dealerships: fragmented and locally focused competitors. ONEW’s advantage tends to come from operational scale and consistency of service infrastructure across markets, which supports better parts/service throughput and sourcing discipline.

🚀 Multi-Year Growth Drivers

Over a 5–10 year horizon, growth should be supported by both market expansion and share capture mechanics:

  • Secular demand for leisure boating: long-term replacement cycles of boats and engines support a recurring replenishment channel, particularly as existing fleets age.
  • Installed-base monetization: service and parts demand grow with the size and age of the maintained fleet, supporting durable revenue beyond new-unit sales.
  • Dealer consolidation: the marine retail sector is fragmented, and scale operators can acquire dealerships, modernize service processes, and achieve cost and inventory management improvements.
  • Customer lifecycle upgrades: selling accessories, electronics, rigging, maintenance packages, and incremental product upgrades increases lifetime value of customers and raises the proportion of service/parts revenue.

⚠ Risk Factors to Monitor

  • Consumer discretionary cyclicality: demand for boats and engines remains sensitive to household confidence and the broader interest-rate environment due to financing dependence.
  • Inventory and floorplan/working-capital risk: dealers carry substantial working capital tied to units on hand; misalignment between demand and inventory can pressure margins and cash conversion.
  • Manufacturer concentration and product allocation: dealership economics can be influenced by OEM priorities, incentive programs, and availability of in-demand models.
  • Service execution and labor availability: service quality and throughput depend on skilled technicians, parts logistics, and operational controls; execution lapses can raise warranty and cost-to-serve.
  • Regulatory and environmental compliance: permitting, emissions-related engine changes, and environmental requirements can affect parts availability, engine transitions, and operating costs.

📊 Valuation & Market View

Markets typically value marine retail/service businesses using EV/EBITDA and earnings multiples, with equity re-rating often tied to operating leverage and earnings quality. Key valuation drivers include:

  • Mix shift toward service and parts (improves earnings stability and reduces unit-sales cyclicality).
  • Gross margin discipline on unit sales and improved service labor efficiency.
  • Working capital efficiency (inventory turns and cash conversion).
  • Same-store performance and acquisition integration: maintaining returns on acquired operations and avoiding margin dilution.

Because unit sales are more cyclical, valuation sensitivity typically increases when investors believe service/parts profitability will be sustained through downcycles.

🔍 Investment Takeaway

ONEW’s long-term thesis rests on a dealer ecosystem that monetizes an owned installed base through recurring service and parts, while using scale to improve sourcing, cost absorption, and execution quality. The primary investment question is whether the company can consistently defend margins and manage working capital through boating demand cycles, while continuing to convert fragmented dealership opportunities into disciplined, service-led earnings.


⚠ AI-generated — informational only. Validate using filings before investing.

📰 Market News & Coverage

15 Stories Available

Real-time institutional reporting and market updates for ONEW.

marketbeat.com2026-07-30

OneWater Marine Q3 Earnings Call Highlights

OneWater Marine NASDAQ: ONEW reported fiscal third-quarter revenue of $531 million, down 4% from the prior-year period, while gross margin expanded and adjusted EBITDA increased as the dealership operator continued to manage inventory, costs and debt during a challenging retail environment.

seekingalpha.com2026-07-30

OneWater Marine Inc. (ONEW) Q3 2026 Earnings Call Transcript

OneWater Marine Inc. (ONEW) Q3 2026 Earnings Call Transcript

zacks.com2026-07-30

OneWater Marine (ONEW) Misses Q3 Earnings and Revenue Estimates

OneWater Marine (ONEW) came out with quarterly earnings of $0.73 per share, missing the Zacks Consensus Estimate of $0.94 per share. This compares to earnings of $0.79 per share a year ago.

gurufocus.com2026-07-30

OneWater Marine Inc. Announces Fiscal Third Quarter 2026 Results

OneWater Marine Inc. (NASDAQ: ONEW) (“OneWater” or the “Company”) today announced results for its fiscal third quarter ended June 30, 2026.“Solid thir

businesswire.com2026-07-30

OneWater Marine Inc. Announces Fiscal Third Quarter 2026 Results

BUFORD, Ga.--(BUSINESS WIRE)--OneWater Marine Inc. (NASDAQ: ONEW) (“OneWater” or the “Company”) today announced results for its fiscal third quarter ended June 30, 2026. “Solid third quarter results reflected the benefits of the actions we have taken over the past year to strengthen the business," said Austin Singleton, Executive Chairman of OneWater. "Despite a measured retail environment, we expanded margins, reduced leverage, and continued to maintain disciplined inventory levels. Importantl.

businesswire.com2026-07-16

OneWater Marine Inc. Announces Fiscal Third Quarter 2026 Earnings Release Date and Conference Call Information

BUFORD, Ga.--(BUSINESS WIRE)--OneWater Marine Inc. (NASDAQ: ONEW) (the “Company” or “OneWater”) announced today that it will release its third quarter 2026 financial results on Thursday, July 30th, 2026, before the market opens. Following the release, the Company's management team will host a conference call to discuss the results at 8:30 a.m. Eastern Time that day. OneWater Marine will offer a live webcast of the conference call, accessible from the Investor Relations section of the company's.

zacks.com2026-06-19

OneWater Marine (ONEW) Surges 5.0%: Is This an Indication of Further Gains?

OneWater Marine (ONEW) was a big mover last session on higher-than-average trading volume. The latest trend in earnings estimate revisions might not help the stock continue moving higher in the near term.

seekingalpha.com2026-05-23

OneWater Marine: Riding The K-Shaped Yacht Economy

OneWater Marine remains a 'Hold' as it shifts from serial acquisition to deleveraging and slow premiumization, improving its balance sheet and margins. ONEW's Q1 revenue from new boats fell 12%, but higher-priced yacht sales and improved used boat margins lifted gross margin to 23.8%, a two-year high. The $50 million Ocean Bio-Chem sale and disciplined FCF deployment reduced net LT debt/EBITDA to ~4.1x, below the 4.5x target.

seekingalpha.com2026-04-30

OneWater Marine Inc. (ONEW) Q2 2026 Earnings Call Transcript

OneWater Marine Inc. (ONEW) Q2 2026 Earnings Call Transcript

zacks.com2026-04-30

OneWater Marine (ONEW) Reports Q2 Loss, Misses Revenue Estimates

OneWater Marine (ONEW) came out with a quarterly loss of $0.34 per share versus the Zacks Consensus Estimate of $0.09. This compares to earnings of $0.13 per share a year ago.

businesswire.com2026-04-30

OneWater Marine Inc. Announces Fiscal Second Quarter 2026 Results

BUFORD, Ga.--(BUSINESS WIRE)--OneWater Marine Inc. (NASDAQ: ONEW) (“OneWater” or the “Company”) today announced results for its fiscal second quarter ended March 31, 2026. “Our second quarter was highlighted by continued improvement in boat margins and a significant reduction in leverage,” said Austin Singleton, Executive Chairman of OneWater. “Margin expansion reflects the benefits of a more focused portfolio and the deliberate actions taken to reduce complexity, optimize inventory, and manage.

zacks.com2026-04-20

OneWater Marine (ONEW) Soars 14.5%: Is Further Upside Left in the Stock?

OneWater Marine (ONEW) saw its shares surge in the last session with trading volume being higher than average. The latest trend in earnings estimate revisions may not translate into further price increase in the near term.

businesswire.com2026-04-16

OneWater Marine Inc. Announces Fiscal Second Quarter 2026 Earnings Release Date and Conference Call Information

BUFORD, Ga.--(BUSINESS WIRE)--OneWater Marine Inc. (NASDAQ: ONEW) (the “Company” or “OneWater”) announced today that it will release its second quarter 2026 financial results on Thursday, April 30th, 2026, before the market opens. Following the release, the Company's management team will host a conference call to discuss the results at 8:30 a.m. Eastern Time that day. OneWater Marine will offer a live webcast of the conference call, accessible from the Investor Relations section of the company'.

defenseworld.net2026-04-14

OneWater Marine Inc. (NASDAQ:ONEW) Receives Consensus Rating of “Hold” from Brokerages

OneWater Marine Inc. (NASDAQ: ONEW - Get Free Report) has been given an average recommendation of "Hold" by the six brokerages that are currently covering the stock, MarketBeat.com reports. One investment analyst has rated the stock with a sell rating, three have given a hold rating and two have assigned a buy rating to the company.

defenseworld.net2026-03-27

Analyzing Topgolf Callaway Brands (NYSE:CALY) & OneWater Marine (NASDAQ:ONEW)

OneWater Marine (NASDAQ: ONEW - Get Free Report) and Topgolf Callaway Brands (NYSE: CALY - Get Free Report) are both consumer discretionary companies, but which is the better investment? We will contrast the two businesses based on the strength of their valuation, profitability, risk, analyst recommendations, institutional ownership, dividends and earnings. Profitability This table compares OneWater Marine

📊 AI Financial Analysis

Powered by StockMarketInfo
Earnings Data: Q Ending 2026-06-30

"ONEW reported Q3’26 (ended 2026-06-30) revenue of $530.7M and net income of $11.7M, or EPS of $0.70 (diluted $0.69). On a YoY basis versus Q3’25 (revenue $552.9M, net income $10.7M), revenue fell -3.9% while net income rose +8.9%. QoQ versus Q2’26 (revenue $442.3M, net income -$12.9M), revenue grew +20.0% and net income turned sharply positive (from a loss to +$11.7M). Profitability improved meaningfully: gross margin expanded slightly (24.0% vs 22.9% QoQ), and net margin improved from -2.9% in Q2’26 to +2.2% in Q3’26. The company also shows a clear operating rebound—operating income improved to $35.6M. Cash flow quality strengthened: operating cash flow was $80.4M and free cash flow was $84.9M in Q3’26, compared with $52.4M operating cash flow and $50.0M free cash flow in Q2’26. Balance sheet leverage remains elevated for the quarter: total assets were $1.30B, equity was $286.1M, and net debt was ~$481.0M, improved from Q2’26 (~$883.3M) indicating some de-leveraging or cash/liability mix shifts. From a shareholder returns standpoint, price momentum is negative (1y_change -13.16%), and there is no dividend. Total returns therefore rely on fundamentals improving rather than market tailwinds. Analysts’ consensus target (~$13.33) is above the current $11.15, implying modest upside."

Revenue Growth

Neutral

QoQ revenue accelerated to $530.7M (+20.0% vs $442.3M). YoY revenue declined -3.9% (vs $552.9M). Trajectory is volatile but improving sequentially.

Profitability

Positive

Net income surged to $11.7M from -$12.9M QoQ, with net margin flipping from -2.9% to +2.2%. YoY net income improved +8.9% while revenue declined slightly. Margins expanded across gross and operating measures.

Cash Flow Quality

Positive

Operating cash flow rose to $80.4M and free cash flow to $84.9M in Q3’26 (up from $52.4M and $50.0M in Q2’26). No dividends paid; buybacks were not evident.

Leverage & Balance Sheet

Fair

Total assets declined to $1.30B from $1.38B QoQ. Equity decreased slightly to $286.1M (from $269.4M prior quarter). Net debt improved materially to ~$481M from ~$883M QoQ, but leverage remains substantial (short-term debt still large).

Shareholder Returns

Caution

Market performance is weak: 1y_change -13.16% and no dividend (yield 0). With limited evidence of buybacks, shareholder returns are not yet supported by price momentum.

Analyst Sentiment & Valuation

Positive

Consensus target ($13.33) is above the current price ($11.15), suggesting upside. Valuation multiples appear modest relative to earnings given the recent rebound, but sentiment is likely constrained by prior losses.

Disclaimer:This analysis is AI-generated for informational purposes only. Accuracy is not guaranteed and this does not constitute financial advice.

Fundamentals Overview

Loading fundamentals overview...

OneWater’s Q2 2026 shows a downturn in top-line volume but clear profitability improvement. Revenue fell 9% to $442M with same-store sales down 8%, driven mainly by new-boat unit weakness and the Palm Beach Boat Show timing shift into June (management cited ~$16M–$17M of sales moving). Despite the demand softness, gross margin expanded 110 bps to 23.9% from favorable mix and portfolio optimization. Pre-owned remained resilient (+5%) on improved availability. Reported results were pressured by the Ocean Bio-Chem exit, including $6M of noncash trade name impairment and tax impacts, which also drove service/parts comparability lower (underlying businesses improved ex-OBCI). On costs, management guided ~$6M annualized SG&A savings with half in the back half of the year. Balance sheet actions were a highlight: $57M debt repaid, net leverage improved to 4.1x, and the company remains on track to get below 4x. Guidance stayed unchanged.

AI IconGrowth Catalysts

  • 110 bps gross margin expansion to 23.9% from favorable mix shift and brand portfolio optimization
  • Pre-owned business revenue +5% with improved availability (higher unit sales and average price)
  • Book/seasonality tailwind from Palm Beach International Boat Show timing shift into June quarter, supporting early April activity and deal flow

Business Development

  • Completed sale of Ocean Bio-Chem (OBCI) as part of portfolio optimization (exited brands/asset divestiture)

AI IconFinancial Highlights

  • Revenue: $442 million, down 9% YoY; same-store sales down 8%
  • New boat revenue -12% driven by Palm Beach show timing shift and lower unit volumes; offset by higher average unit price
  • Service/Parts/Other revenue -11% due to prior-year Ocean Bio-Chem contribution; excluding that impact, parts/service increased YoY
  • Gross profit $106 million vs $110 million prior year; gross margin expanded to 23.9%, +110 bps YoY
  • Net loss $13 million vs net loss $0.375 million prior year; increase driven by $6 million noncash trade name impairment and tax impacts from OBCI disposition
  • Adjusted EBITDA $16 million
  • SG&A down $2 million to $86 million; SG&A as % of revenue rose due to lower revenue base; annualized savings ~ $6 million expected from end-March/early-April actions
  • Balance sheet: cash $68 million; total liquidity ~ $73 million
  • Inventory $551 million vs $602 million prior year (down from disciplined inventory management and OBCI sale); dealer inventory down 3% YoY and down 19% over 2 years
  • Debt: repaid $57 million during quarter; long-term debt $354 million; net debt-to-EBITDA improved to 4.1x; on track to reduce leverage below 4x by fiscal year-end
  • Outlook unchanged vs February: total revenue $1.78B to $1.88B (includes lost revenue from exiting brands and OBCI divestiture); adjusted EBITDA $60M to $80M; adjusted diluted EPS $0.20 to $0.70

AI IconCapital Funding

  • Debt reduction: repaid $57 million in Q2 using proceeds from Ocean Bio-Chem sale and strong operating cash flow
  • Cash and liquidity: $68 million cash; ~$73 million total liquidity
  • Leverage plan: target leverage below 4.0x by end of fiscal year; current net debt-to-EBITDA 4.1x

AI IconStrategy & Ops

  • Portfolio optimization: completed sale of Ocean Bio-Chem; management highlighted challenging Y/Y comparisons for remainder of year due to absence of revenues
  • Cost alignment: additional SG&A actions focused on personnel, administrative functions, and reorganizations; expected annualized savings ~$6 million with about half captured in back half of year
  • Inventory optimization: dealer inventory reduced materially and maintained healthier mix/aging profile; management emphasized disciplined production from OEM partners supporting inventory quality
  • Operational focus through core selling season: selling boats, managing costs, maintaining margin expansion and leverage reduction

AI IconMarket Outlook

  • Industry assumption: industry flat to down low single digits YoY
  • Dealer same-store sales guidance: expected to be flat YoY after incorporating lost revenue from exiting brands and OBCI divestiture
  • Macro monitoring: management cited ongoing uncertainty (TV/news, consumer confidence) over next 60-120 days and near-term planning through next ~6 weeks (prime 6 weeks leading into summer)

AI IconRisks & Headwinds

  • Retail demand pressured; SSI data indicates double-digit declines in categories competed (management described as softer with uncertain consumer confidence)
  • Event timing distortion: Palm Beach show timing shifted meaningful new boat sales into June quarter, creating difficult Y/Y comps
  • Y/Y comparability risk: absence of Ocean Bio-Chem revenues through remainder of year after sale; underlying service/parts growth requires normalization
  • Near-term macro noise risk: management explicitly flagged potential negative swings (e.g., gas price cited as could reach $47/gallon) impacting consumer confidence
  • Unit volume downside risk: units down mid-to-upper single digits; inventory order decisions constrained by lead times and current industry inventory levels

Q&A: Analyst Interest

  • Topic: Same-store sales bridge (units vs price) and contribution from exiting brands: Management said price led most of the same-store decline, while units were down mid- to upper single digits. They quantified Palm Beach show timing as roughly half the decline, with exiting brands contributing about a quarter of the impact.
  • Topic: Palm Beach Boat Show sales shift magnitude and timing into June: Management confirmed the majority will move into the next quarter (June) and that the Palm Beach show was “fantastic,” with high-teens unit and dollar growth for that show. They corrected the analyst’s $19M estimate to ~$16M–$17M and noted some larger-item lag possible.
  • Topic: April trends excluding boat show and fuel-price sensitivity by customer segment: Management said April continued the improving trend—door swings, internet leads, and deals flowing through—and maintained higher gross margin. On fuel prices, they suggested higher-end customers are not seeing the same impact yet, though it may affect everyone eventually.

Sentiment: MIXED

Note: This summary was synthesized by AI from the ONEW Q2 2026 earnings transcript. Financial data is complex; please verify all metrics against official SEC filings before making investment decisions.

📋 Official Regulatory 10-K / 10-Q SEC Filings

Direct authenticated documentation links to audited SEC database reports for ONEW.

SEC EDGAR Live Feed
Loading financial data and tables...
📁

SEC Filings (ONEW)

© 2026 Stock Market Info — OneWater Marine Inc. (ONEW) Financial Profile