Peloton Interactive, Inc.

Peloton Interactive, Inc. (PTON) Market Cap

Peloton Interactive, Inc. has a market capitalization of $2.67B.

Price: $6.39

0.01 (0.16%)

Market Cap: 2.67B

NASDAQ · time unavailable

CEO: Peter C. Stern

Sector: Consumer Cyclical

Industry: Leisure

IPO Date: 2019-09-26

Website: https://www.onepeloton.com

Peloton Interactive, Inc. (PTON) - Company Information

Market Cap: 2.67B|Sector: Consumer Cyclical

Company Profile

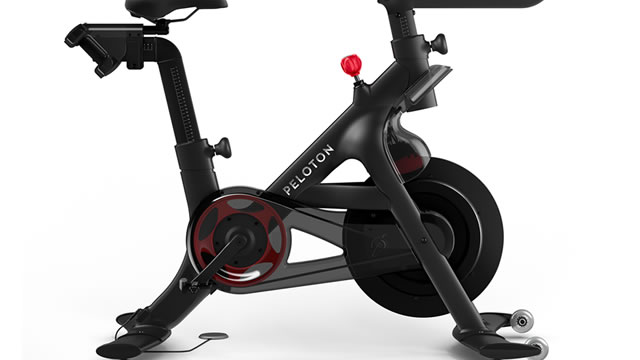
Peloton Interactive, Inc. operates globally, providing interactive fitness equipment and services. The company's main offerings include internet-connected exercise machines like the Peloton Bike, Bike+, Tread, and Tread+, which feature integrated touchscreens for streaming live and on-demand workout classes. Additionally, Peloton offers subscription packages for households, granting access to a wide array of live and archived fitness content, also available through its Peloton Digital application. As of June 30, 2021, Peloton served approximately 5.9 million members. Its innovative fitness products are sold directly to consumers via its retail showrooms and through its website, onepeloton.com. Founded in 2012, Peloton Interactive, Inc. is headquartered in New York, New York.

Analyst Sentiment

62%
Buy

From 21 Active Polls

1Y Forecast: $6.75

▲ +5.6% Potential Upside

Consensus Target Metrics

Low Bound

$6

Median

$6

High Bound

$9

Average

$7

Price & Moving Averages

Loading chart...

🎯 Wall Street Analyst Intelligence Report

1-Year structural target targets, chart projections, and sentiment maps.

Average 1Y Target
$6.75
▲ +5.63% Upside
Low Target
$6.00
-6% Risk
Median Target
$6.00
-6% Mid
High Target
$9.00
41% Max
Consensus
Buy
20 / 40 Buys

Consensus Trend Projection

Trailing closures vs. 12-month metrics map.

Analyst Vote Distribution

Aggregate institutional coverage sentiment weights.

📊 Historical Valuation Multiples

Real-time Trailing Twelve Month (TTM) momentum side-by-side with discrete quarterly metrics.

Fiscal QuarterTTMQ1 2026Q4 2025Q3 2025Q2 2025Q1 2025Q4 2024Q3 2024Q2 2024
Period EndingTrailing 12MMar 31, 2026Dec 31, 2025Sep 30, 2025Jun 30, 2025Mar 31, 2025Dec 31, 2024Sep 30, 2024Jun 30, 2024
Market Cap ($M)2,6661,8062,5703,7182,7922,4903,3551,7731,214
Enterprise Value ($M)2,6561,7973,7184,5773,7293,5684,5523,1052,595
Price to Earnings Ratio (P/E)112.5017.41-16.7266.9632.31-13.17-9.06-487.50-9.94
Price/Earnings-to-Growth Ratio (PEG)-0.87-0.60
Price to Sales Ratio (P/S)1.092.863.916.754.603.994.983.031.89
Price to Book Ratio (P/B)-6.50-4.37-7.87-10.71-6.75-5.07-6.75-3.69-2.34
Price to Free Cash Flow Ratio (P/FCF)6.6411.9936.2055.1624.8426.3231.65165.6846.69
Enterprise Value to Sales (EV/Sales)2.855.668.316.155.726.755.304.03
Enterprise Value to EBITDA (EV/EBITDA)12.2125.48470.6571.8549.46164.41-134.6845.26-67.41
Debt to Equity Ratio-0.05-2.49-7.12-5.65-4.78-4.05-4.08-4.28-4.00

📘 Full Research Report

ℹ️

AI-Generated Research: This report is for informational purposes only.

📘 PELOTON INTERACTIVE CLASS A INC (PTON) — Investment Overview

🧩 Business Model Overview

Peloton operates a vertically integrated, direct-to-consumer “device + subscription” model. Customers acquire connected fitness hardware (e.g., bikes, treadmills, accessories) that is designed to run Peloton’s software experience. The software then delivers live and on-demand coaching, structured programming, and workout analytics, which are monetized through an ongoing membership. Peloton also monetizes through content-related add-ons and related services, creating a repeat revenue stream anchored to an installed base rather than one-time hardware sales.

This structure creates a customer journey with compounding behavior: the device establishes a routine (frequency and habit formation), while the membership deepens engagement through curated programs and personalized progression. Over time, the customer’s profile data, preferences, workout history, and the operational familiarity with Peloton’s interfaces increase friction to switch.

💰 Revenue Streams & Monetisation Model

  • Subscription revenue (recurring): The primary recurring component, driven by membership penetration across the active installed base. Subscription monetization benefits from software scale, with margins typically less dependent on hardware input costs.
  • Hardware revenue (transactional): Driven by new customer acquisition and upgrades/expansions of the device ecosystem. Hardware margins are more exposed to component costs, logistics, warranty provisions, and promotional intensity.
  • Accessory and service revenues (hybrid): Accessories and services contribute incremental monetization tied to device usage patterns.

Margin structure is shaped by the mix between recurring subscription economics (which tend to improve as engagement and retention stabilize) and the lower-margin volatility of hardware cycles. The key operational levers generally include membership retention, the cost-to-serve of the software platform, customer acquisition efficiency, and device gross margin discipline.

🧠 Competitive Advantages & Market Positioning

Peloton’s moat is best characterized by switching costs and an ecosystem/data layer rather than pure brand alone. Once a household invests in a Peloton device, the integration of hardware controls, software UX, workout library, and the customer’s performance history creates “data gravity.” The practical cost of switching is not only the purchase price of a competing device, but also the loss of continuity in coaching style, saved progress, and the established habit embedded in the platform.

In addition, Peloton benefits from community and network effects that are behavioral rather than strictly social-media driven: live classes, structured challenges, and leaderboards encourage repeat participation and reduce churn by making workouts feel less like a standalone activity.

  • Primary competitors:
    • ICON / NordicTrack / ProForm (iFIT): A major connected fitness rival offering a subscription-led digital training experience paired with hardware.
    • Technogym (MyWellness ecosystem): A connected fitness platform with greater emphasis on commercial/club and hospitality ecosystems, while expanding in consumer segments.
    • Lululemon’s connected content ecosystem (e.g., Mirror platform history): Competes for at-home participation through content, though with different hardware and ecosystem mechanics.

Industry focus contrast: Peloton’s differentiation centers on a tightly integrated, direct-to-consumer hardware-and-software bundle with a broad content library designed for consistent long-term engagement. ICON’s model often competes on bundling hardware variety with a subscription app, where the experience can be less “single-platform” and more dependent on specific device classes. Technogym’s strengths often reflect its ecosystem presence in gyms and institutions, while Peloton’s competitive arena is more concentrated in the household installed base and consumer subscription retention. Content-led rivals typically compete for participation and engagement, but may face different economics around installed-base monetization and retention depth.

🚀 Multi-Year Growth Drivers

  • Installed-base monetization: Sustained subscription growth can compound when Peloton maintains retention and increases membership penetration over the active installed base.
  • Category shift to connected fitness: Structural consumer preference for guided, measurable training and at-home convenience supports continued TAM expansion for connected workout experiences.
  • Software engagement as a lifecycle asset: A robust content slate and program design can extend customer lifespan on-platform, supporting higher lifetime value and improving payback on hardware acquisition costs.
  • International expansion: Market development in geographies with favorable broadband and consumer willingness to pay for guided at-home training can enlarge the addressable subscriber base.
  • Product and program adjacency: Accessories, peripherals, and program-driven seasonal demand can diversify monetization and reduce reliance on any single device SKU.

⚠ Risk Factors to Monitor

  • Hardware demand cyclicality: Hardware purchase timing can be sensitive to consumer spending and housing-related mobility, pressuring revenue volatility.
  • Competitive intensity and pricing pressure: Connected fitness rivals may increase promotional intensity or improve software capabilities, compressing hardware margins and raising subscriber acquisition costs.
  • Content and platform cost structure: Live and on-demand content, coaching, and technology maintenance require ongoing investment; impairment of subscriber economics could flow through to profitability.
  • Technology and user-experience parity: If competitors match Peloton’s training quality and product experience, the ecosystem switching friction could weaken over time.
  • Supply chain and warranty exposure: Component availability, logistics execution, and warranty rates can materially affect gross margin and cash flow.
  • Data privacy and regulatory compliance: Workout analytics and user data handling introduce compliance risk across jurisdictions.

📊 Valuation & Market View

Connected fitness companies are typically valued through a blend of growth and retention expectations, often reflected in price-to-sales-type frameworks for the revenue layer and EV/EBITDA-type approaches once profitability stabilizes. Key valuation drivers generally include:

  • Active subscriber trajectory: Growth in paid members and membership penetration of the installed base.
  • Retention quality: Churn dynamics and the durability of engagement, which govern long-term revenue visibility.
  • Contribution margins: Hardware margin discipline, software/platform cost control, and marketing efficiency.
  • Cash conversion: The ability to translate reported profitability into operating cash flow given working-capital and inventory dynamics.

A credible market view hinges on whether Peloton sustains a path toward improving unit economics while maintaining differentiation in the installed base experience.

🔍 Investment Takeaway

Peloton’s long-term investment case rests on an ecosystem that can support switching costs through integrated device-software continuity, reinforced by community-driven engagement. While hardware introduces cyclicality and margin volatility, the subscription model can provide the structural foundation for compounding value if retention holds and hardware economics stabilize. The core debate centers on durability of ecosystem differentiation versus competitive convergence in connected fitness.


⚠ AI-generated — informational only. Validate using filings before investing.

📰 Market News & Coverage

15 Stories Available

Real-time institutional reporting and market updates for PTON.

defenseworld.net2026-08-01

Avidity Partners Management LP Acquires New Position in Peloton Interactive, Inc. $PTON

Avidity Partners Management LP bought a new stake in shares of Peloton Interactive, Inc. (NASDAQ: PTON) in the undefined quarter, according to its most recent disclosure with the Securities and Exchange Commission (SEC). The institutional investor bought 200,000 shares of the company's stock, valued at approximately $858,000. A number of other institutional investors

proactiveinvestors.com2026-07-27

Peloton expected to issue conservative outlook for fiscal 2027, says UBS

Peloton Interactive Inc (NASDAQ:PTON) is expected to deliver a slightly better-than-expected fourth quarter but provide conservative fiscal 2027 guidance when it reports results, according to UBS analysts. UBS, which rates the stock ‘Buy' with an $11 price target, expects fourth quarter revenue of $595 million, slightly above the midpoint of the company's guidance range of $582 million to $602 million.

proactiveinvestors.com2026-07-27

Peloton expected to issue conservative outlook for fiscal 2027, says UBS

Peloton Interactive Inc (NASDAQ:PTON) is expected to deliver a slightly better-than-expected fourth quarter but provide conservative fiscal 2027 guidance...

globenewswire.com2026-07-23

Peloton Interactive, Inc. Announces Date of Fourth Quarter & Fiscal Year 2026 Earnings Release and Conference Call

NEW YORK, July 23, 2026 (GLOBE NEWSWIRE) -- Peloton Interactive, Inc. (NASDAQ: PTON) will release its fourth quarter and fiscal year 2026 financial results before the U.S. stock market opens on Thursday, August 6, 2026. The company will host a conference call and live audio webcast to discuss the financial results at 8:30 a.m. (Eastern Time) that day.

seekingalpha.com2026-07-13

Peloton: What To Watch In Q4 Earnings

Peloton has stabilized its business, delivering profitability and strong free cash flow, yet the stock remains depressed due to ongoing revenue declines. PTON's subscriber base remains flat, with churn improving to 1.2%, but no near-term catalysts are expected to reignite growth this quarter. Management is focused on refinancing its $1B term loan, potentially unlocking $10–12M in quarterly interest savings and enabling shareholder-friendly actions like buybacks.

fool.com2026-07-03

After Skyrocketing 34% in 3 Months, Has Peloton Finally Turned the Corner?

In the third quarter of fiscal 2026, Peloton reported positive net income and free cash flow. The company's biggest challenge, its declining user base and revenue, supports the bear case.

seekingalpha.com2026-06-08

Peloton Interactive, Inc. (PTON) Presents at Oppenheimer 26th Annual Consumer Growth and E-Commerce Conference Transcript

Peloton Interactive, Inc. (PTON) Presents at Oppenheimer 26th Annual Consumer Growth and E-Commerce Conference Transcript

fool.com2026-06-08

3 Stocks Under $10 to Buy Hand Over Fist in June

Opendoor is closing in on positive adjusted earnings, and that's a solid foundation. Grab's revenue is growing even faster than its 16% in monthly transacting users.

fool.com2026-06-08

Why Peloton Stock Zoomed More Than 17% Higher Last Month

It also posted modest revenue growth. Finally, it benefited from inclusion on a key small-cap stock index.

fool.com2026-06-05

Peloton Is Down 2% in 2026. Is This a Once-in-a-Lifetime Buying Opportunity?

An extremely volatile year for shares of the fitness equipment and software enterprise may overshadow fundamental changes.

investorplace.com2026-06-05

Skip the Oura Ring IPO. Buy These 10 Stocks Instead.

Oura Ring's IPO looks like Peloton in 2020 - great product, dangerous price. Ten public wellness stocks own the real trade.

globenewswire.com2026-06-03

Peloton Announces Participation in the Oppenheimer 26th Annual Consumer Growth and E-Commerce Conference

NEW YORK, June 03, 2026 (GLOBE NEWSWIRE) -- Peloton Interactive, Inc. (Nasdaq: PTON) today announced that Chief Executive Officer and President, Peter Stern, will participate in a fireside chat at the virtual Oppenheimer 26th Annual Consumer Growth and E-Commerce on Monday, June 8, 2026 at 1:30 PM EDT.

seekingalpha.com2026-06-02

Peloton Interactive, Inc. (PTON) Presents at 2026 Baird Global Consumer, Technology & Services Conference Transcript

Peloton Interactive, Inc. (PTON) Presents at 2026 Baird Global Consumer, Technology & Services Conference Transcript

fool.com2026-05-31

Peleton's (PTON) Chief Commercial Officer Sold All Their Shares for $584,000

Peloton, a leader in connected fitness and digital subscriptions, reported a notable insider sale amid ongoing market challenges.

globenewswire.com2026-05-28

Peloton Announces Participation in the Baird 2026 Global Consumer, Technology & Services Conference

NEW YORK, May 28, 2026 (GLOBE NEWSWIRE) -- Peloton Interactive, Inc. (Nasdaq: PTON) today announced that Chief Executive Officer, Peter Stern, will participate in a fireside chat at the Baird Global Consumer, Technology & Services Conference on Tuesday, June 2, 2026 at 1:25 PM EDT.

📊 AI Financial Analysis

Powered by StockMarketInfo
Earnings Data: Q Ending 2026-03-31

"PTON reported Q3’26 revenue of $631.0M (vs. $550.8M in Q1’26 QoQ, and $624.0M in Q3’25 YoY), and net income of $26.4M (vs. $13.9M in Q1’26 QoQ and a net loss of $47.7M in Q3’25 YoY). EPS was $0.06, up from $0.03 in the prior quarter and from a -$0.12 year-ago quarter. Over the last four quarters, margins improved: gross margin strengthened versus Q1’26/Q2’26 (51.5% in Q3’26 vs. 50.5% in Q2’26), and operating/net margins moved back into positive territory (operating margin 8.3% in Q3’26; net margin 4.2%). Cash flow quality also improved. Operating cash flow was $152.7M and free cash flow was $150.5M, marking a step up from $71.9M operating cash flow in Q2’26. Balance sheet liquidity remains strong with cash & equivalents of ~$1.04B, but leverage is still significant: long-term debt is $751M and total debt is ~$1.03B. Shareholder returns look mixed from the provided market data (price at $5.10; 1Y change -9.25%), implying limited capital appreciation tailwind; no dividend and no buybacks were reported in Q3’26. Overall, Q3’26 shows a clear earnings turnaround and stronger cash generation, which supports sentiment, but valuation and shareholder return momentum appear muted versus the prior year."

Revenue Growth

Fair

Revenue was $631.0M in 2026-03-31. QoQ growth: +14.5% (vs. $550.8M in 2025-09-30). YoY growth: +1.1% (vs. $624.0M in 2025-03-31).

Profitability

Positive

Net income was $26.4M vs. -$47.7M YoY (improvement of ~$74.1M) and up QoQ from $13.9M (+90.1%). Operating margin expanded to 8.3% in Q3’26 from 7.5% in Q1’26 and from 1.7% in Q2’26; net margin rose to 4.2% from -5.9% in Q2’26.

Cash Flow Quality

Positive

Operating cash flow was $152.7M and free cash flow $150.5M in 2026-03-31, improving vs. Q2’26 (OCF $71.9M; FCF $71.0M). No dividends were paid and no repurchases were reported in Q3’26.

Leverage & Balance Sheet

Fair

Liquidity improved modestly to cash & equivalents of ~$1.04B (down from $1.18B in Q2’26). Leverage remains elevated with total debt of ~$1.03B and negative retained earnings; however, leverage risk appears more manageable than the prior quarter given stronger profitability and cash generation.

Shareholder Returns

Caution

Provided marketPerformance shows price at $5.10 with 1Y change of -9.25%, which is a headwind for total shareholder return. Dividend yield is 0 and no buybacks were reported in the quarter.

Analyst Sentiment & Valuation

Positive

Consensus price target is $7.1 vs. current $5.10 (upside implied). Recent earnings/cash improvement supports sentiment, though the valuation indicators were not favorable in the ratios set.

Disclaimer:This analysis is AI-generated for informational purposes only. Accuracy is not guaranteed and this does not constitute financial advice.

Fundamentals Overview

Loading fundamentals overview...

Peloton reported Q3 FY26 revenue of $631M, beating guidance by $6M, alongside 2.662M ending paid connected fitness subscriptions (in line with midpoint) and churn improvement of 7 bps YoY to 1.2%. The key disappointment was gross margin: 51.9%, up 90 bps YoY but 210 bps below guidance, driven by opportunistic promotions. Management expects Q4 subs of 2.55M–2.57M with churn roughly flat YoY, while gross additions decline YoY due to lower equipment sales—so subscriber upside timing remains uncertain. On positives, free cash flow rose to $151M (+59% YoY) and balance sheet strength accelerated: net debt fell 70% YoY to $173M and cash ended at $1.13B. The largest line-item risk update was tariff exposure reduction to ~$30M FCF for FY26 (down $15M). Strategic momentum is evident in Spotify licensing, commercial growth (CBU +14% YoY), and new product/hardware development, but management remains cautious on pacing until a permanent CFO and credit ratings process guide capital allocation.

AI IconGrowth Catalysts

  • HiLit classes contribution: over 400,000 people took Rebecca Kennedy HiLit classes; contributed to 48% growth in Pilates modality (and ongoing R&D/instructor onboarding).
  • Breathwrk expansion: launched 140th Peloton instructor-led meditation and sleep classes and daily meditations/sleep programming to build the app into a mental well-being platform.
  • Commercial business unit momentum: Peloton Commercial Series announcement; Q3 CBU revenue increased 14% YoY and management expects new heavy-traffic bike/tread availability in Q2 FY27.
  • Revenue inflection vectors beyond paid subs: additional equipment sales to existing members, CBU equipment revenue, Spotify licensing revenue driver, and pricing/offer mix driving high-margin revenue.

Business Development

  • Spotify content licensing partnership: expects to bring more than 1,400 Peloton classes (strength, pilates, bar, yoga, meditation, outdoor, cardio) to hundreds of millions of Spotify Premium subscribers; guidance assumes anticipated Spotify content licensing revenue was already reflected and will be recorded to the subscription segment.
  • Commercial Series equipment collaboration: Precor industrial-grade durability combined with Peloton connected experience for gym environments (heavy-traffic bike and treadmill).
  • Brand/marketing association referenced: ad campaign featuring Hudson Williams; management cited >60 million organic social views.

AI IconFinancial Highlights

  • Total revenue: $631 million, exceeding guidance by $6 million and positive YoY growth.
  • Connected Fitness subscriptions: 2.662 million ending paid subs (in line with guidance midpoint); average net monthly paid churn 1.2%, improved by 7 bps YoY.
  • Gross margin: 51.9%, +90 bps YoY, but 210 bps below guidance (~54%).
  • Gross margin miss drivers: opportunistic promotions across Connected Fitness equipment sales; management indicated they still operate within strict LTV-to-CAC hurdle rates.
  • Free cash flow: $151 million, +$56 million (+59%) YoY; management attributed strength to profitability and cash generation.
  • Full-year FY26 revenue outlook: $2.42B-$2.44B (midpoint +$10M vs prior guidance; 2% YoY decline at midpoint).
  • Full-year FY26 gross margin outlook: ~52.5%, ~50 bps lower than prior guidance; +160 bps YoY.
  • Full-year FY26 adjusted EBITDA: $470M-$480M (midpoint in line; +18% YoY at midpoint).
  • Q4 guidance for ending paid Connected Fitness subs: 2.55M to 2.57M; churn expected roughly flat YoY while gross additions decline YoY due to lower equipment sales.
  • Tariff exposure update: tariffs expected to represent ~$30M of full-year FY26 free cash flow exposure, reduced by $15M vs prior quarter’s $45M.

AI IconCapital Funding

  • Cash and leverage: ended Q3 with $1.13B cash; net debt of $173M (70% reduction YoY).
  • Debt/capital actions: paid down ~$200M convertible debt upon maturity in February; term loan noted as $1B with a $10M prepayment penalty expiring end of May 2026 (end of this month).
  • Buyback/share repurchase: management stated it is evaluating options including share repurchases, but did not announce timing or amounts in this transcript.

AI IconStrategy & Ops

  • Executive compensation cost allocation change: in Q1 FY26, corporate facility overhead previously recorded to G&A began being assigned across COGS, sales & marketing, G&A, and R&D; management clarified that YoY comparisons are on an as-reported basis.
  • Cost structure rightsizing: Q3 operating expenses excluding restructuring and payment/supply settlement expenses were $267M (-$50M, -16% YoY); targeting at least $100M annualized run-rate cost savings by end of FY26.
  • Marketing/promotions discipline: Q3 gross margin pressured by opportunistic promotions, enabled by strong LTV-to-CAC performance (management referenced 2x LTV-to-CAC as room to be more aggressive); management said it does not plan to repeat Q3 promo activity in Q4.
  • Store strategy: micro stores described as ~1/10 the size of inline stores but more productive; management plans to invest in next round of micro stores for FY27.
  • R&D and hardware pipeline: “new equipment in one of our existing modalities” progressing; unannounced hardware not detailed, but management emphasized increased price accessibility (enabled by refurb inventory in bike category) and longer lead time for new modalities; strength category already cited as ~2M members engaging each quarter.

AI IconMarket Outlook

  • Q4 subscription guidance: ending paid Connected Fitness subs 2.55M to 2.57M; average net monthly churn roughly flat YoY in FY26 despite Q2 price change; gross additions decrease YoY due to lower equipment sales.
  • FY26 targets: positive net income on a full-year basis in FY26 (in addition to previously stated goal of positive operating income).
  • Spotify partnership monetization: management reiterated Spotify-related content licensing revenue was already included in prior revenue guidance and will be recorded to the subscription segment.

AI IconRisks & Headwinds

  • Gross margin volatility from promotional intensity: Q3 gross margin 210 bps below guidance due to opportunistic equipment promotions.
  • Q4 operational cadence: management noted growth path to sustained YoY revenue growth “will not be linear” and Q4 churn/gross-add dynamics may lag as equipment sales decline.
  • Tariff/macro uncertainty: Section 232 and CBP refund timing remain moving targets; refunds depend on CBP readiness for IEEPA requests.
  • Subscriber growth timing lag: net adds depend on convergence of gross adds decline vs improved churn; management emphasized revenue may inflect before paid subs.

Q&A: Analyst Interest

  • Tariffs and IEEPA refund timing: Management clarified US-made equipment is not subject to Section 232; imported hardware is no longer subject specifically to 232 aluminum/steel, but remains subject to MFN plus Sections 122 and 301. For IEEPA, they are awaiting CBP readiness to file a more complex refund request and expect net benefit reducing exposure.
  • Capital allocation timing and framework: Management emphasized patience until after the term loan prepayment penalty expires, then conducting a credit ratings process before refinancing. They described a four-part framework: reduce cost of capital, increase flexibility, reduce dilution, and ensure capital for sustainable ops plus vetted organic/inorganic investments.
  • Churn vs gross adds convergence: Management explained that improving churn and decelerating gross adds decline would eventually yield subscriber net adds, but only if convergence accelerates sustainably. They emphasized discipline via marketing/LTV-to-CAC, avoiding “unnatural acts,” and highlighted revenue inflections from equipment, CBU, and Spotify without immediate subscription attachments.

Sentiment: MIXED

Note: This summary was synthesized by AI from the PTON Q3 2026 earnings transcript. Financial data is complex; please verify all metrics against official SEC filings before making investment decisions.

📋 Official Regulatory 10-K / 10-Q SEC Filings

Direct authenticated documentation links to audited SEC database reports for PTON.

SEC EDGAR Live Feed
Loading financial data and tables...
📁

SEC Filings (PTON)

© 2026 Stock Market Info — Peloton Interactive, Inc. (PTON) Financial Profile