Patrick Industries, Inc.

Patrick Industries, Inc. (PATK) Market Cap

Patrick Industries, Inc. has a market capitalization of .

No quote data available.

CEO: Andy L. Nemeth

Sector: Consumer Cyclical

Industry: Furnishings, Fixtures & Appliances

IPO Date: 1980-03-17

Website: https://www.patrickind.com

Patrick Industries, Inc. (PATK) - Company Information

Market Cap: -|Sector: Consumer Cyclical

Company Profile

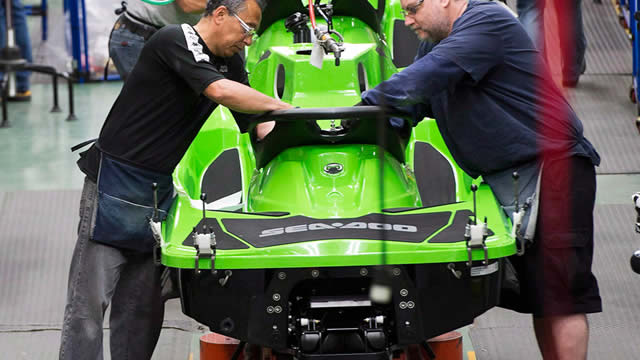
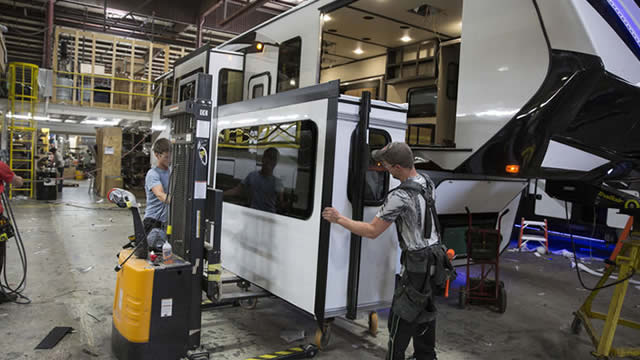
Patrick Industries, Inc. serves as a primary provider of essential components, construction products, and various materials to key sectors such as the recreational vehicle (RV), marine, manufactured housing, and industrial markets. The company's operational footprint covers the United States, China, and Canada, executed through its distinct Manufacturing and Distribution divisions. Within its Manufacturing segment, the company produces a comprehensive range of specialized parts and finished goods. This includes numerous interior furnishings like furniture, shelving, wall panels, various countertop options (including solid surface, granite, and quartz fabrications), bespoke cabinetry, and cabinet doors. Patrick Industries also fabricates fiberglass bath fixtures, tile systems, decorative laminated panels, and polymer-based flooring. Tailored for the marine and RV industries, it manufactures aluminum and plastic goods, fiberglass and plastic components, dash panels, and offers RV painting services. Acoustic products such as amplifiers, tower speakers, soundbars, and subwoofers are also part of its production capabilities. Additionally, this division supplies wrapped profile mouldings, interior passage doors, air handling systems, slide-out trim and fascia, various types of plywood, fiberglass and plastic helm systems, boat covers, adhesives, sealants, thermoformed shower surrounds, specialty bath and closet items, wiring harnesses, fuel tanks, CNC molds, composite parts, marine hardware, and slotwall panels. The company's Distribution division focuses on supplying a broad assortment of finished goods and raw materials. Its offerings include pre-finished wall and ceiling panels, drywall and finishing products, and a variety of electronic and audio system components. This segment also distributes major appliances, marine accessories, diverse wiring products, and crucial electrical and plumbing fixtures. Building materials such as fiber reinforced polyester and cement siding, along with raw and processed lumber, are also provided. Furthermore, the division handles various flooring types (including interior passage, roofing, laminate, and ceramic), shower doors, furniture, fireplaces with surrounds, and both interior and exterior lighting solutions. Beyond product supply, this division also delivers comprehensive transportation and logistics services. Established in 1959, Patrick Industries, Inc. is headquartered in Elkhart, Indiana.

Analyst Sentiment

72%
Buy

From 10 Active Polls

1Y Forecast: $113.00

▲ +0.0% Potential Upside

Consensus Target Metrics

Low Bound

$85

Median

$113

High Bound

$150

Average

$113

Price & Moving Averages

Loading chart...

🎯 Wall Street Analyst Intelligence Report

1-Year structural target targets, chart projections, and sentiment maps.

Average 1Y Target
$113.00
▲ +36.89% Upside
Low Target
$85.00
3% Risk
Median Target
$113.00
37% Mid
High Target
$150.00
82% Max

Consensus Trend Projection

Trailing closures vs. 12-month metrics map.

Analyst Vote Distribution

Aggregate institutional coverage sentiment weights.

Sentiment volume allocation data unavailable.

Historical valuation matrix unavailable.

📘 Full Research Report

ℹ️

AI-Generated Research: This report is for informational purposes only.

📘 PATRICK INDUSTRIES INC (PATK) — Investment Overview

🧩 Business Model Overview

Patrick Industries supplies engineered interior and exterior components used in recreational vehicles (including towables and motorhomes) and in select marine applications. The value chain is primarily: product design and component engineering → manufacturing of components (often built-to-spec for each customer program) → qualification and ongoing production for RV and marine OEMs (original equipment manufacturers) → delivery aligned with OEM production schedules.

The operating model depends on long-standing supplier relationships and program-based manufacturing: components must match specific floorplans, weight/fit targets, and material requirements, which creates meaningful friction for customers when changing vendors.

💰 Revenue Streams & Monetisation Model

Revenue is driven by shipments of manufactured RV and marine components to OEM customers. Monetisation is largely transactional per unit produced by the OEM, with variability tied to OEM build cycles.

Margin drivers typically include:

  • Manufacturing utilization and operating leverage (fixed-cost absorption across cycles)
  • Product mix (higher-content solutions and more complex components generally support better economics)
  • Input cost pass-through and sourcing discipline (wood products, foams/insulation materials, metals and resins)
  • Working-capital efficiency (inventory and production timing relative to OEM schedules)

While revenue is not “subscription-like,” the underlying setup is program-based: once a component is engineered into a customer platform, it tends to persist across model-year production runs, providing repeat demand within the customer’s lifecycle.

🧠 Competitive Advantages & Market Positioning

Patrick’s competitive positioning is best understood as a supplier moat built on switching costs and operational scale.

  • Switching costs (Hard-to-replace qualification): Components require design integration, tooling/fixtures, and OEM qualification. Replacement involves engineering rework, revalidation, and schedule risk.
  • Scale and manufacturing know-how: The company benefits from concentrated manufacturing expertise in RV-relevant materials and processes, enabling consistent quality and cost control when volumes are supported.
  • Customer program embed: A meaningful portion of demand is tied to specific OEM platforms, reducing the likelihood of wholesale vendor churn.

Competitive benchmarking (primary peers):

  • Lippert Components (LCII): A diversified components supplier with scale across many RV subsystems. Lippert often competes broadly across interiors and structural components; Patrick’s focus is more concentrated in engineered interior/exterior component categories.
  • Thor Industries / Forest River (vehicle OEMs with captive or closely aligned supply chains): These firms can internalize or tightly manage certain component categories. Patrick competes by offering engineered, qualified alternatives and by maintaining production reliability.
  • Diversified RV parts suppliers (including regional fabricated-parts manufacturers): These suppliers can compete on price for narrower categories, but typically face disadvantages around qualification breadth, scale, and program longevity compared with Patrick.

Overall, Patrick’s defensibility is less about technological exclusivity and more about the durability of qualification, engineered integration, and cost discipline at scale versus smaller or less program-integrated rivals.

🚀 Multi-Year Growth Drivers

Over a 5–10 year horizon, growth is supported by a combination of end-market expansion and content-per-unit dynamics:

  • RV lifestyle demand with higher unit content: Even without assuming major unit growth, incremental components and design evolution can increase the value of components per manufactured vehicle.
  • Lightweighting and efficiency requirements: Regulatory and consumer preferences toward better fuel economy and improved insulation performance can lift demand for optimized materials and engineered assemblies.
  • Model proliferation and customization: Wider floorplan variety supports greater component complexity and program-specific manufacturing, reinforcing qualification-based switching costs.
  • Marine content opportunities: Select marine application demand can provide diversification, particularly when engineered interior/exterior solutions translate into repeatable production formats.
  • Supply-chain and manufacturing rationalization: In cycles where weaker suppliers exit, remaining qualified suppliers often gain share—especially for OEMs seeking stable quality and delivery.

⚠ Risk Factors to Monitor

  • Cyclicality in RV and marine end markets: OEM production schedules drive component volumes; downturns can pressure utilization and margins.
  • Customer concentration and program timing risk: A portion of revenue is tied to OEM platform cycles, where schedule shifts can impact production and inventory levels.
  • Input cost volatility: Exposure to commodity-linked costs (wood products, metals, resins, foams/insulation inputs) can compress margins without timely sourcing or pricing actions.
  • Execution and working-capital pressure: Inventory build or production timing mismatches with OEM demand can lead to cash flow volatility.
  • Capital intensity and capacity alignment: Maintaining capable manufacturing capacity across cycles requires careful investment discipline and cost controls.
  • Material/technology substitution: Shifts toward alternative materials or construction methods can change what constitutes “best fit” for OEM qualification requirements.

📊 Valuation & Market View

Markets typically value cyclic industrial component suppliers using EV/EBITDA or earnings-based multiples, but the key is normalizing for cycle effects. The valuation debate generally centers on:

  • Normalized gross margin durability (ability to defend pricing and manage input costs)
  • Operating leverage through utilization (how margins scale when volumes recover)
  • Working-capital efficiency (cash conversion across build cycles)
  • Share durability via qualification and program stickiness (evidence that the company retains engineered content through product transitions)
  • Risk perception around OEM concentration and end-market volatility

Because the underlying business is tied to unit production, valuation typically compresses when investor expectations assume prolonged downturns and expands when the market expects improved utilization and more stable margins.

🔍 Investment Takeaway

Patrick Industries presents a compelling long-term profile as a qualified, program-integrated supplier to the RV and marine ecosystems. The core moat is switching costs created by engineering integration and OEM qualification, reinforced by scale and manufacturing execution. The primary investment question is not the existence of end-market volatility, but whether the company can sustain margin discipline, manage input costs and working capital through cycles, and retain engineered content as OEM platforms evolve.


⚠ AI-generated — informational only. Validate using filings before investing.

📊 AI Financial Analysis

Powered by StockMarketInfo
Earnings Data: Q Ending 2026-06-28

"PATK reported Q2 2026 revenue of $1.0417B and net income of $43.4M (EPS $1.36). QoQ, revenue rose +4.6% ($1.0417B vs. $0.9972B) and net income increased +9.9% ($43.4M vs. $39.5M). YoY, revenue declined -0.6% ($1.0417B vs. $1.0476B) while net income grew +33.8% ($43.4M vs. $32.4M), indicating meaningful earnings leverage despite flat sales. Profitability improved across the latest quarter: gross margin expanded to 23.8% (from 22.8% in Q1 and 23.9% in Q2’25), and net margin rose to 4.17% (vs. 3.96% QoQ and 3.10% YoY). Operating income increased to $77.0M, with operating margin improving to 7.40% (from 6.49% QoQ; from 8.28% in Q2’25—still below the prior-year peak). Cash flow strengthened in Q2: operating cash flow was $82.9M and free cash flow was $65.3M, supporting buybacks ($14.7M) and dividends ($16.3M). Balance sheet liquidity remains solid (cash ~$29.2M; total assets $3.21B) though leverage is still meaningful (net debt ~$210M) and goodwill/intangibles are large. Total shareholder returns look favorable: the stock is up +35.0% over 1 year, which likely outweighs the modest dividend yield (~0.54%). Analyst targets are $122 (consensus) vs. ~$106.93 current price, implying upside."

Revenue Growth

Neutral

QoQ revenue +4.6% (Q2’26 vs Q1’26) but YoY revenue -0.6% (vs Q2’25), suggesting flat demand with some quarter-to-quarter strength.

Profitability

Good

Net income +9.9% QoQ and +33.8% YoY; net margin improved to 4.17% (from 3.96% QoQ; 3.10% YoY). Gross margin ~23.8% in Q2’26.

Cash Flow Quality

Good

Q2’26 operating cash flow $82.9M and free cash flow $65.3M. Continued shareholder payouts with dividends ($16.3M) and buybacks ($14.7M).

Leverage & Balance Sheet

Neutral

Total assets $3.21B; equity $1.13B. Leverage remains notable with total debt $238.9M and net debt ~$209.8M, but liquidity ratios are acceptable (current ratio ~2.67).

Shareholder Returns

Strong

Strong momentum: 1Y price change +34.96%. Dividend yield is modest (~0.54%), but buybacks/dividends supported capital returns in the quarter.

Analyst Sentiment & Valuation

Positive

Consensus target ~$122.33 vs. current ~$106.93 implies upside, though valuation multiples (e.g., P/E ~17.1 on provided ratios) suggest the market already prices in improvement.

Disclaimer:This analysis is AI-generated for informational purposes only. Accuracy is not guaranteed and this does not constitute financial advice.

Fundamentals Overview

Loading fundamentals overview...

PATK delivered resilient but weakening profitability in Q2 2026, with sales roughly flat YoY ($1.04B) despite a 16% RV wholesale shipment decline. The offset came from strong Marine (+22%) and Powersports (+28%), plus Housing (+2%), aided by higher content per unit and organic share gains in Marine electrical/digital solutions. However, adjusted operating margin fell to 7.5% (from 8.3%) and adjusted EBITDA margin slipped 80 bps, driven by RV volume pressure and higher oil/fuel costs, with additional EPS headwinds from ~$0.07 of accounting-related convertible dilution. Management’s 2026 outlook keeps operating margin flat vs 2025, but flags a further ~20 bps margin hit in 2H26 from incremental volume-based affordability programs—an explicit margin trade for customer retention and channel restocking. Liquidity remains strong (~$691M) with net leverage 3.0x and ongoing buybacks (~$91M in the quarter). Strategic catalysts include Marine solutions momentum, Powersports cabin-closure take rates, and new RV advanced digital printing capability, alongside capacity optimization for the current run-rate environment.

AI IconGrowth Catalysts

  • Marine solutions traction: tower & windshield solutions, electrical solutions, digital systems, SeaDek flooring programs, and fuel tanks driving content growth and share gain
  • Powersports attachment strength: continued increase in cabin closures uptake in side-by-side units
  • Housing supportive backdrop: Road to Housing Act becoming law (potential to unlock pent-up affordable housing demand)
  • RV decorative differentiation: launch of multimillion-dollar advanced digital printing technology on North American Forest Products campus enabling direct-to-substrate printing for improved design flexibility and efficiency
  • Cost-off portfolio execution: good-better-best value-engineering and low-cost alternatives to address affordability while maintaining product differentiation
  • Operational automation/AI: internal AI process competition for administrative automation plus AI in aftermarket platform to improve product introductions and digital content generation

Business Development

  • LCI Industries merger agreement (previously announced); company says it remains limited in what it can disclose beyond public information
  • All-stock merger agreement with Lippert (recently executed); targeted close in first half of 2027 pending customary approvals
  • Partnership methodology with RV customers to mitigate price increases and tariffs via good-better-best offerings and procurement/value engineering

AI IconFinancial Highlights

  • Net sales: $1.04B, down <1% YoY; organic growth estimated at 7% with acquisition growth 1% and industry negative 9%
  • Adjusted diluted EPS: $1.29 vs prior year $1.50 adjusted (reported Q2 adjusted basis); dilution of ~+$0.07 from convertible notes/warrants and additional accounting-related dilution (prior year $0.03 per share)
  • Reported diluted EPS: $1.28 vs $0.96 YoY (net income up 34% to $43M) driven by lower prior-year one-time legal settlement impact
  • Gross margin: 23.8% vs 23.9% prior year (essentially flat); adjusted operating margin: 7.5% vs 8.3% prior year
  • Adjusted EBITDA margin: 12.1%, down 80 bps YoY
  • Operating margin guide: 2026 adjusted operating margin now expected flat vs 2025
  • Margin headwind: incremental volume-based affordability programs in 2H26 may negatively impact margins by additional ~20 bps vs 2025

AI IconCapital Funding

  • Share repurchases: ~ $91M during the quarter (repurchased ~980,000 shares)
  • Total returned to shareholders in quarter: ~ $106M (quarterly dividends $15M + repurchases $91M)
  • Remaining repurchase authorization: ~$62M at quarter end
  • Available liquidity: ~$691M (about $661M unused revolver capacity + cash on hand)
  • Leverage: net leverage 3.0x at quarter end; expected to bring leverage down in coming 2 quarters
  • Operating cash flow: $69M in first 6 months 2026 vs $189M in first 6 months 2025 (working capital investment, elevated inventories)
  • No major debt maturities until 2028

AI IconStrategy & Ops

  • Increased short-term leverage and repurchased shares during quarter based on cash flow confidence
  • Capacity management: making capacity adjustments while maintaining scalability; centering models on current run-rate environment and taking a little capacity out without constraining flexibility
  • Inventory discipline at dealers/OEMs supported by improved channel weeks-on-hand; management expects dealers to take another ~1 week out of inventory by end of year vs last year
  • Working capital and composites: elevated inventory levels supporting composite products growth strategy (began 2H25); RV shipment decline delayed release of composite and raw material inventories
  • AI initiatives: first internal AI process competition for administrative automation; AI used in aftermarket platform for new product introductions and improved content generation

AI IconMarket Outlook

  • 2026 RV: retail down low double digits; wholesale units 285,000 to 300,000
  • 2026 Marine: retail flat to down slightly; wholesale up low single digits
  • 2026 Powersports: full-year unit shipments and organic content up low single digits (implying mid-to-high single-digit increase for business)
  • 2026 Housing: MH wholesale unit shipments and total new housing starts both down low-to-mid single digits
  • 2026 adjusted operating margin: flat vs 2025; but incremental 2H26 volume-based affordability programs may reduce margins by additional ~20 bps vs 2025
  • 2026 operating cash flow: $320M to $350M; capex $70M to $80M; free cash flow ~ $250M
  • 2026 effective tax rate: 24% to 25%
  • Merger timing: Lippert targeted close first half of 2027 (customary approvals)

AI IconRisks & Headwinds

  • RV demand softness: 16% reduction in RV industry wholesale unit shipments; RV retail units down 12% in Q2 to ~99,200 vs wholesale ~77,600
  • Dealer destocking dynamics: implied seasonal dealer field inventory destock ~21,600 units in Q2 with dealer inventory weeks on hand estimated 18-20 weeks (vs 20-22 weeks end of Q1; pre-COVID 26-30)
  • Macro pressure on discretionary spend: elevated domestic fuel prices, higher interest rates, lower consumer confidence; payment/price sensitivity weighing on larger-ticket purchases
  • Cost pressure: higher oil and fuel prices contributing to adjusted operating margin decline
  • Luan plywood import duties: antidumping/countervailing duties on imported luan plywood from Indonesia expected to take effect end of Q3/Q4; composites inventory turns slowed somewhat due to shifts/offset strategy
  • Margin risk: 2H26 affordability programs could pressure margins by ~20 bps beyond base
  • Convertible notes/accounting dilution: additional accounting-related dilution of ~$0.07 in EPS driven by stock price above convertible option strike

Q&A: Analyst Interest

  • RV production and July-to-open-house demand signals: Management compared OEM dealer “touch points” with reported retail numbers across June/July and emphasized production tracking vs early-year expectations. They said production levels would step down into July/August consistent with the 285k–300k 2026 wholesale outlook, relying on open-house order visibility.
  • Affordability volume-based pricing and margin trade-off timing: Management framed affordability initiatives as an offensive partnership, leveraging scale, value engineering, and procurement to discount inventory and transfer savings to OEMs. They indicated these actions are intended for aggressive deployment in 2H26, potentially sacrificing margin to support long-term channel health.
  • Commodities (luan plywood duties) and margin impact mitigation: Management said commodities have generally leveled off, with some relief in metals. They highlighted imported luan plywood antidumping/countervailing actions from Indonesia taking effect end of Q3/Q4, mitigated via purchased inventory and continued offsetting through composites, though composite inventory turns were slower.

Sentiment: MIXED

Note: This summary was synthesized by AI from the PATK Q2 2026 earnings transcript. Financial data is complex; please verify all metrics against official SEC filings before making investment decisions.

Loading financial data and tables...
© 2026 Stock Market Info — Patrick Industries, Inc. (PATK) Financial Profile