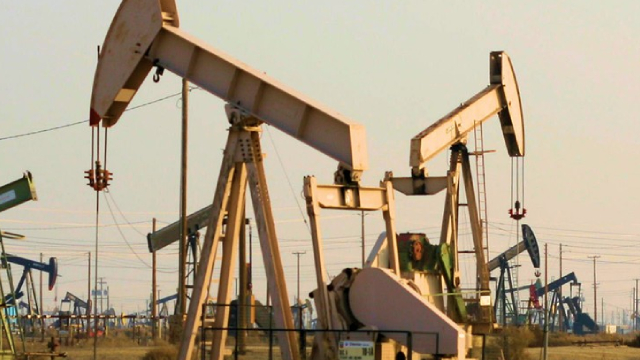
Riley Exploration Permian, Inc.

Riley Exploration Permian, Inc. (REPX) Market Cap

Riley Exploration Permian, Inc. has a market capitalization of $743.5M.

Price: $34.27

0.75 (2.24%)

Market Cap: 743.52M

AMEX · time unavailable

CEO: Bobby D. Riley

Sector: Energy

Industry: Oil & Gas Exploration & Production

IPO Date: 1998-12-28

Website: https://www.rileypermian.com

Riley Exploration Permian, Inc. (REPX) - Company Information

Market Cap: 743.52M|Sector: Energy

Company Profile

Riley Exploration Permian, Inc. (REPX) functions as an independent energy company, engaged in the entire process of hydrocarbon extraction—from acquiring properties and exploring for reserves to developing sites and producing oil, natural gas, and natural gas liquids across the states of Texas and New Mexico. The company primarily concentrates its activities on the San Andres Formation, a geological shelf margin deposit located within the Central Basin Platform and Northwest Shelf areas. REPX's landholdings are predominantly comprised of interconnected blocks situated in Yoakum County, Texas, along with Lea and Roosevelt Counties, New Mexico. As of the end of the third quarter of 2021 (September 30, 2021), the company reported approximately 31,352 net acres and operated a total of 77 net producing wells. Riley Exploration Permian, Inc.'s main office is located in Oklahoma City, Oklahoma.

Analyst Sentiment

83%
Strong Buy

From 4 Active Polls

1Y Forecast: $37.00

▲ +8.0% Potential Upside

Consensus Target Metrics

Low Bound

$36

Median

$37

High Bound

$38

Average

$37

Price & Moving Averages

Loading chart...

🎯 Wall Street Analyst Intelligence Report

1-Year structural target targets, chart projections, and sentiment maps.

Average 1Y Target
$37.00
▲ +7.97% Upside
Low Target
$36.00
5% Risk
Median Target
$37.00
8% Mid
High Target
$38.00
11% Max
Consensus
Buy
3 / 3 Buys

Consensus Trend Projection

Trailing closures vs. 12-month metrics map.

Analyst Vote Distribution

Aggregate institutional coverage sentiment weights.

📊 Historical Valuation Multiples

Real-time Trailing Twelve Month (TTM) momentum side-by-side with discrete quarterly metrics.

Fiscal QuarterTTMQ1 2026Q4 2025Q3 2025Q2 2025Q1 2025Q4 2024Q3 2024Q2 2024
Period EndingTrailing 12MMar 31, 2026Dec 31, 2025Sep 30, 2025Jun 30, 2025Mar 31, 2025Dec 31, 2024Sep 30, 2024Jun 30, 2024
Market Cap ($M)744761558574555616673556583
Enterprise Value ($M)976993795932820861937838900
Price to Earnings Ratio (P/E)11.94-2.701.638.804.555.3615.355.434.34
Price/Earnings-to-Growth Ratio (PEG)-0.160.3544.120.76
Price to Sales Ratio (P/S)1.846.685.735.376.496.016.565.435.53
Price to Book Ratio (P/B)1.291.370.881.011.001.161.321.101.19
Price to Free Cash Flow Ratio (P/FCF)11.0949.2439.1716.58198.9719.7220.3311.5941.01
Enterprise Value to Sales (EV/Sales)8.728.178.729.608.419.138.198.54
Enterprise Value to EBITDA (EV/EBITDA)4.64-16.425.4415.9712.3813.9022.7013.6214.59
Debt to Equity Ratio1.110.450.400.660.500.480.540.580.67

📘 Full Research Report

ℹ️

AI-Generated Research: This report is for informational purposes only.

📘 RILEY EXPLORATION PERMIAN INC (REPX) — Investment Overview

🧩 Business Model Overview

Riley Exploration Permian Inc (REPX) is an upstream oil and gas producer focused on the Permian Basin. The value chain is standard for unconventional E&P: land position → drilling and completion of horizontal wells → production from reservoir to centralized facilities (either operated or contracted) → sales of crude oil, natural gas, and natural gas liquids (NGLs) into regional market hubs. Operational performance is driven by drilling/completion execution, well productivity (initial rates and decline curves), and per-unit cost discipline across a defined operating footprint. Customer “stickiness” in oil and gas is not contractual in the way software is; instead, it comes from scale and logistics—producing volumes that can be reliably delivered into established takeaway and market infrastructure, typically through third-party gathering, processing, and pipeline systems.

💰 Revenue Streams & Monetisation Model

REPX’s monetisation is primarily transactional, sourced from:
  • Crude oil sales (generally the dominant revenue contributor)
  • Natural gas sales
  • NGL sales (often meaningful for total revenue and margin capture)
  • Derivative/hedging effects (where utilized, they influence realized cash flows rather than creating recurring revenue)
Margin drivers typically include:
  • Production mix (oil vs. gas vs. NGL composition)
  • Realization and differentials, including basis impacts for gas and quality/transport impacts for crude
  • Transportation and fuel-related costs tied to basin logistics and contractual terms
  • Lease operating expense (LOE) and workover intensity
  • Cash taxes and sustaining capital requirements required to offset declines
Because this is an E&P model, revenue is not recurring; the economic “repeatability” is tied to reserve life extension through drilling and inventory of development locations, rather than a subscription-like monetisation structure.

🧠 Competitive Advantages & Market Positioning

The principal moat for an E&P producer like REPX is not branding—it is unit-cost and logistical effectiveness within a mature operating region where infrastructure enables efficient production. Moat Thesis (Permian geographic + logistics cost advantage):
  • Geographic cost advantage: Permian-area density of service providers, specialty contractors, rigs, completion resources, and water logistics supports lower “time-to-drill” and reduced frictional costs versus less developed basins.
  • Logistical infrastructure access: Proximity to gathering systems, processing capacity, and long-haul pipelines improves the economics of moving volumes to market and can reduce the risk of local bottlenecks affecting realized volumes.
  • Operational learning curve / density: When acreage is developed in a concentrated footprint, repeatable execution and shared infrastructure typically reduce per-well and per-unit costs (facility utilization, centralized operations, and standardized processes).
Competitive benchmarking (Permian-focused peers): Primary competitors include:
  • Pioneer Natural Resources (major Permian operator with substantial scale and infrastructure)
  • Diamondback Energy (large-scale Permian producer with strong capital allocation processes)
  • Civitas Resources (focused Permian operator with active development platforms)
Contrast vs. REPX positioning: Large peers often compete on acreage quality, scale procurement, and breadth of midstream/pipeline optionality. REPX’s competitive positioning is typically more reliant on achieving superior well economics and cost efficiency within its specific acreage footprint (drilling cadence, completion designs, and LOE control) rather than matching the largest operators’ absolute scale. In a basin with shared infrastructure, the differentiator is frequently how efficiently each operator converts capital into production and reserves at the field level—not merely the presence of oil and gas resources.

🚀 Multi-Year Growth Drivers

Over a 5–10 year horizon, REPX’s total addressable opportunity is shaped by basin-wide activity and the economics of unconventional resource development:
  • Permian development cycle and repeatable drilling inventory: Unconventional wells are capital-intensive, but the industry has established a long runway of locations across defined acreage blocks. Growth depends on maintaining an inventory of economic drilling opportunities and sustaining development capital.
  • Infrastructure buildout and midstream utilization: Continued expansion and debottlenecking of gathering/processing and pipeline capacity can support higher effective recoveries (through better takeaway access and reduced constraints).
  • Operational technology and execution: Incremental improvements in drilling efficiency, completion efficiency, water logistics, and production optimization typically raise per-well economics without changing commodity fundamentals.
  • Cost normalization through scale and learning: As service providers and operators refine execution in the same basin, field-level learning can improve well performance and reduce per-unit costs, supporting longer “cash breakeven” runway.

⚠ Risk Factors to Monitor

  • Commodity price volatility: Oil and gas price cycles drive cash flow and the ability to fund development. Even strong operational performance can be offset by unfavorable realized prices.
  • Regulatory and environmental pressure: Methane regulations, flaring rules, water handling/disposal requirements, and permitting timelines can increase costs and slow development.
  • Midstream and transportation constraints: Pipeline or processing bottlenecks can impact realized volumes and basis differentials, especially for operators without flexible takeaway arrangements.
  • Capital intensity and decline rates: Unconventional production typically declines over time, requiring continuous capital deployment to sustain output and reserve value.
  • Operational risk: Well performance variability (IPs, decline rates, EURs), gathering/processing uptime, and workover effectiveness can shift project economics.
  • Balance sheet and discipline risk: In periods of weaker prices, leverage and liquidity constraints can force suboptimal drilling decisions.

📊 Valuation & Market View

The market typically values Permian E&P companies using cash-flow and reserve value frameworks rather than sales growth multiples:
  • EV/EBITDA or EV/EBITDAX: Driven by realized differentials, operating cost structure, and production volumes.
  • Cash flow and free-cash-flow potential: Sensitivity to commodity price decks, hedging effectiveness, and sustaining capital requirements.
  • Reserve-based value (PV-10 / NPV concepts): The quality and replacement rate of reserves, drilling inventory economics, and assumptions about decline rates and costs.
Key valuation sensitivities that move multiples include: (i) production growth/decline trajectory, (ii) field-level cost of supply (LOE and lifting costs), (iii) realized differentials (basis and quality), and (iv) capital efficiency (capital required per unit of incremental production).

🔍 Investment Takeaway

REPX’s long-term investment case rests on the ability to translate Permian acreage development into durably competitive well economics through cost discipline and effective logistics. The structural advantage for this business model is primarily geographic and infrastructural—operating within a mature basin where takeaway, services, and execution capabilities are concentrated. For investors, the central question is whether REPX can sustain production and reserve growth at attractive unit costs through cycles, while managing regulatory and midstream risks and maintaining financial discipline in a capital-intensive industry.

⚠ AI-generated — informational only. Validate using filings before investing.

📰 Market News & Coverage

15 Stories Available

Real-time institutional reporting and market updates for REPX.

gurufocus.com2026-07-31

EnerCom Announces SM Energy as a Keynote Speaker at the 31st EnerCom Denver - The Energy Investment Conference, on August 19, 2026, in Denver, Colorado

EnerCom Announces SM Energy as a Keynote Speaker at the 31st EnerCom Denver - The Energy Investment Conference, on August 19, 2026, in Denver, C

zacks.com2026-07-29

Riley Exploration Permian, Inc. (REPX) Earnings Expected to Grow: What to Know Ahead of Next Week's Release

Riley Exploration Permian (REPX) possesses the right combination of the two key ingredients for a likely earnings beat in its upcoming report. Get prepared with the key expectations.

zacks.com2026-07-28

Will Riley Exploration Permian (REPX) Beat Estimates Again in Its Next Earnings Report?

Riley Exploration Permian (REPX) has an impressive earnings surprise history and currently possesses the right combination of the two key ingredients for a likely beat in its next quarterly report.

prnewswire.com2026-07-15

Riley Permian Declares Quarterly Dividend and Schedules Second Quarter 2026 Earnings Release and Conference Call

OKLAHOMA CITY, July 15, 2026 /PRNewswire/ -- Riley Exploration Permian, Inc. (NYSE American: REPX) ("Riley Permian" or the "Company") today announced that its Board of Directors has approved a cash dividend on the Company's common stock in the amount of $0.40 per share. The dividend is payable on August 12, 2026 to stockholders of record as of the close of business on July 29, 2026.

seekingalpha.com2026-07-09

Riley Exploration: The Turnaround Is Working

Riley Exploration Permian trades at a forward P/E of 5.5x, despite strong fundamentals and a transformed, lower-risk profile. REPX offers a 4.7% dividend yield with a five-year growth streak and a 50% payout ratio, supporting further increases if earnings hold. Recent asset sales and acquisitions have streamlined operations, reduced debt, and boosted production, with Q1 2026 results exceeding guidance.

seekingalpha.com2026-06-02

Riley Exploration Permian: Excellent Operational Results In Q1

Riley's Q1 2026 oil production exceeded its guidance midpoint by 5%. Riley's capex and lease operating expenses also came in better than expected. This resulted in an increase to its full-year production guidance, with only a modest increase in capex due to higher development activity levels.

seekingalpha.com2026-05-31

Riley Exploration Permian: An Extremely Profitable Conventional Opportunity

Riley Exploration Permian (REPX) boasts highly profitable wells. REPX was already paying dividends, growing production, and reducing debt before the recent surge in oil prices. The stock trades at a low P/E ratio of 5, making it exceptionally cheap for a profitable U.S.-based operator.

zacks.com2026-05-26

Should Energy Investors Choose REPX Stock Over MGY Right Now?

Riley Exploration Permian REPX and Magnolia Oil & Gas MGY both operate in the U.S. Oil & Gas Exploration & Productionspace, but offer investors two different stories. Riley Exploration Permian is a faster-growing Permian Basin player.

gurufocus.com2026-05-21

EnerCom Announces Premier Networking Events for the 31st Annual Energy Investment Conference, Including Monday Charity Golf Tournament, Monday VIP Welcome Mixer, and Tuesday Casino Night

EnerCom Announces Premier Networking Events for the 31st Annual Energy Investment Conference, Including Monday Charity Golf Tournament, Monday

zacks.com2026-05-20

Here's Why Momentum in Riley Exploration Permian (REPX) Should Keep going

Riley Exploration Permian (REPX) could be a solid choice for shorter-term investors looking to capitalize on the recent price trend in fundamentally sound stocks. It is one of the many stocks that passed through our shorter-term trading strategy-based screen.

zacks.com2026-05-20

Can REPX's Oil Growth Plan Outrun Permian Gas Price Weakness?

Riley Exploration Permian  REPX is entering 2026 with a clear growth message: oil production is expected to rise sharply as the company accelerates drilling across its Texas and New Mexico assets. In the first quarter, REPX produced an average of 20.2 thousand barrels per day of oil and 35.6 thousand barrels of oil equivalent per day (MBOE/d) overall.

zacks.com2026-05-14

REPX After Q1 Earnings: Is This Permian Play Worth Buying?

Riley Exploration Permian's Q1 beat, surging output and free cash flow spotlight a discounted growth-and-dividend story despite Permian gas constraints.

seekingalpha.com2026-05-07

Riley Exploration Permian, Inc. (REPX) Q1 2026 Earnings Call Transcript

Riley Exploration Permian, Inc. (REPX) Q1 2026 Earnings Call Transcript

zacks.com2026-05-06

Riley Exploration Permian, Inc. (REPX) Q1 Earnings Surpass Estimates

Riley Exploration Permian, Inc. (REPX) came out with quarterly earnings of $1.02 per share, beating the Zacks Consensus Estimate of $0.99 per share. This compares to earnings of $1.62 per share a year ago.

prnewswire.com2026-05-06

Riley Permian Reports First Quarter 2026 Results

OKLAHOMA CITY, May 6, 2026 /PRNewswire/ -- Riley Exploration Permian, Inc. (NYSE American: REPX) ("Riley Permian" or the "Company"), today reported financial and operating results for the first quarter ended March 31, 2026. FIRST QUARTER 2026 HIGHLIGHTS Reported 35.6 MBoe/d of total equivalent production (oil production of 20.2 MBbls/d) Generated $47 million of operating cash flow or $55 million before changes in working capital(1) and $24 million of Total Free Cash Flow(1) Incurred total accrual (activity-based) capital expenditures before acquisitions of $47 million and cash capital expenditures before acquisitions of $31 million Reduced debt by $8 million with a quarter-end debt-to-Adjusted EBITDAX(1) ratio of 1.0x(2) Repurchased 152 thousand shares of stock for $4 million Bobby Riley, Chief Executive Officer and Chairman of the Board commented, "Our first quarter results reflect strong operational execution, with production exceeding guidance and capital spending below expectations.

📊 AI Financial Analysis

Powered by StockMarketInfo
Earnings Data: Q Ending 2026-03-31

"REPX reported Q1 2026 revenue of $113.9M, up +11.0% QoQ from Q4 2025 ($97.3M) and +11.2% YoY vs Q1 2025 ($102.5M). Net income swung sharply to a loss of -$70.4M (EPS -$3.38) versus profit of $85.4M in Q4 2025 and profit of $28.6M in Q1 2025, implying margins contracted materially in the quarter (net margin -61.8% vs +87.8% in Q4 and +27.9% in Q1). Profitability deterioration appears driven by below-the-line items: operating income was positive at $43.7M (operating margin 38.3%), but income before tax fell to -$92.7M (pretax margin -81.4%), with total other income/expense of -$136.4M. This quarter also showed a liquidity hit: operating cash flow was +$47.2M and free cash flow +$16.6M, but the company repurchased stock (-$4.0M) and paid dividends (-$8.4M), reducing cash by about $2.1M QoQ. Shareholder returns look strong from the market: the stock is up +35.6% over 1 year, suggesting positive total return momentum (dividend yield ~1.1%, buybacks ongoing). Balance sheet leverage remains moderate with net debt of ~$224.9M and equity of $553.4M, though the very weak earnings quarter reduces near-term confidence."

Revenue Growth

Good

Revenue rose +11.0% QoQ (Q4 $97.3M to Q1 $113.9M) and +11.2% YoY (Q1 2025 $102.5M to Q1 2026 $113.9M), indicating steady top-line momentum.

Profitability

Neutral

Operating income stayed positive at $43.7M (38.3% operating margin), but net income collapsed to -$70.4M (net margin -61.8%) from +$85.4M in Q4 2025 and +$28.6M in Q1 2025; EPS deteriorated to -$3.38.

Cash Flow Quality

Neutral

Cash generation remained positive: operating cash flow was +$47.2M and free cash flow +$16.6M. However, cash ended lower QoQ (-$2.1M) due to dividends (-$8.4M) and buybacks (-$4.0M).

Leverage & Balance Sheet

Neutral

Equity increased to $553.4M (from $634.2M in Q4), and leverage is moderate with net debt about $224.9M vs equity $553.4M (debt-equity ~0.43).

Shareholder Returns

Good

Strong price momentum: +35.6% 1-year change plus a ~1.1% dividend yield and ongoing buybacks (repurchased ~$4.0M in the quarter). Total return momentum improves the score despite earnings volatility.

Analyst Sentiment & Valuation

Caution

Consensus target is $37 vs current price $33.47 (~10.5% upside). Valuation is supported by market expectations, but the current quarter’s large net loss weakens fundamentals.

Disclaimer:This analysis is AI-generated for informational purposes only. Accuracy is not guaranteed and this does not constitute financial advice.

Fundamentals Overview

Loading fundamentals overview...

REPX delivered a strong Q1 operational cadence with production exceeding the high end of guidance while CapEx came in below the low end, reinforcing management’s “Texas first” development discipline and accelerating execution via faster drilling/completions and multi-well pad/zipper frac efficiencies. Financials show cash generation continuing despite GAAP distortion: the company reported a GAAP net loss of $70M largely driven by -$127M derivative losses (91% unrealized), while operating cash flow remained positive. Unhedged revenue grew 17% QoQ, but gas/NGL weakness persisted due to structural egress constraints and seasonality, with gas and NGL revenues after fees down $11M. Outlook is materially constructive: Q2 accrual CapEx guided to $80M, full-year CapEx midpoint raised to $210M (+5%), and production midpoint raised to 22,500 bpd (+5%) implying 30% YoY growth with back-end weighting. Key catalysts center on Targa pipeline progress enabling New Mexico earnouts and ERCOT commissioning monetization; primary headwinds remain gas pricing, inflation in services, and midstream timing risk.

AI IconGrowth Catalysts

  • Production exceeded the high end of Q1 guidance while spending below the low end of capital guidance; management attributes the uplift to faster drilling/completions plus well productivity outperforming predrill forecasts
  • Second-quarter ramp with 2 rigs running full time and 16–18 planned completions by quarter end (30% more than Q1), driving a production ramp later in Q2
  • New Mexico Targa high-pressure trunk line: engineering/design progressed with construction to begin after final regulatory approval; scheduled commercial operations date in Q3, enabling wells to turn in line and move toward earn-outs
  • Texas-led development efficiencies: record spud-to-TD timing (4.28 days) and record spud-to-rig-release (5.79 days); multi-well pads and zipper fracs reducing downtime and per-well cost
  • ERCOT power monetization: 10 MW Ward County site in final commissioning stage with power sold into real-time market and forecast commercial operations later in May enabling day-ahead market participation

Business Development

  • Targa midstream project (New Mexico) referenced for the high-pressure trunk line into processing plants; timing aligned to Q3 commercial operations
  • RPC joint venture power projects referenced under ERCOT commissioning (Ward County 10 MW site plus additional sites scheduled late summer)
  • Power/behind-the-meter project at Champions: avoided negative gas sales at recent prices cited as a mitigation lever
  • Acquisition underwriting history: Silverback acquisition referenced (financed with 100% debt in a $60 oil environment) and tied to hedging and infrastructure/inventory positioning
  • Non-op participation referenced in New Mexico as dynamic due to forced pooling and overlapping ownership; majors (largest oil companies) participating in wells

AI IconFinancial Highlights

  • Unhedged revenue: +$17M (+17% QoQ) driven by +18% higher oil revenue partially offset by weaker natural gas and NGL revenues
  • Gas and NGL revenues after fees: -$11M, which reduced total net revenue by 9%
  • Revenue net of derivative settlements: -$3M (-3%) to $102M due to weaker gas/NGLs (hedged oil revenue flat)
  • Operating cash flow: $47M; $55M before working-capital changes
  • Adjusted EBITDAX: $61M, -$5M (-8% QoQ) due to -$3M lower gas/NGL hedge revenue and +$2M higher operating costs and production taxes
  • GAAP net loss: -$70M driven by -$127M loss on derivatives, 91% unrealized; management notes mark-to-market volatility will reverse as hedged production delivers
  • Hedging coverage: only ~67% hedged for remaining 2026 balance of year (implies increased sensitivity to oil prices if oil remains elevated)
  • Capital discipline: Q1 total accrual-based CapEx $47M vs cash CapEx $31M (2/3 of accrual) attributed to rapid activity ramp lag
  • Full-year outlook raised: full-year guidance range increased by $10M to $210M midpoint (+5%) and full-year production guidance raised by 5% to 22,500 bpd at midpoint (30% YoY growth per management)
  • LOE per BOE: $7.51 in Q1, below $8–$9 per BOE guidance; drivers cited include chemical cost nearly halved in New Mexico vs 2025 monthly average via January program change and vendor re-alignment plus productivity/divisor benefits

AI IconCapital Funding

  • Q1 capital allocation: reduced debt by $8M and returned $12M to shareholders via dividend and share repurchases (plus in-quarter notes: dividends $8.4M; stock buyback $4M; power JV investment $4M total/$2.5M net of distribution)
  • Full-year capital efficiency: expects CapEx reinvestment rate ~65%–70% of operating cash flow before working capital at midpoint and based on current forward oil prices
  • Excess free cash flow allocation plan: majority to debt paydown; smaller allocation possibly to stock buybacks depending on conditions

AI IconStrategy & Ops

  • Activity sequencing: Texas focused in 2026 with New Mexico rig released in Q3 and later reintroduced to align completion cadence with pipeline/infrastructure readiness
  • Midstream constraint management: structural gas egress constraints plus seasonal midstream maintenance negatively impacted Permian gas pricing in Q1
  • Operational automation/efficiency themes: multi-well pads and zipper fracs materially reduced downtime and per-well cost while improving consistency; faster spud-to-TD and spud-to-rig-release records
  • Workover/cycle efficiency: elective workovers deferred from Q4 executed primarily in Red Lake; nearly 500 net bpd of flat production with some oil cut improvement; management highlighted only ~30% of possible uplift realized to date
  • New Mexico chemical program change: costs nearly cut in half on a per-barrel basis within months of implementation (with petrochemical creep later but expected minimization of impact)

AI IconMarket Outlook

  • Production ramp path: Q2 modest growth (~4% at midpoint stated in Q&A), with largest gain in Q3 and another gain in Q4; back-half volumes guided roughly between 24,000 and 25,000 bpd
  • Full-year production midpoint: 22,500 barrels/day (+5% guidance raise) supporting 30% YoY growth
  • Second-quarter CapEx: $80M accrual CapEx guidance
  • ERCOT commissioning timing: Ward County 10 MW facility forecast commercial operations later in May ("after which" day-ahead market participation begins); remaining ERCOT sites scheduled late summer
  • New Mexico Targa linkage: permit expected to come "any day" in management discussion; pipeline construction several months; Targa commercial operations scheduled for Q3

AI IconRisks & Headwinds

  • Structural gas egress constraints and seasonal midstream maintenance causing negative gas/NGL outcomes and weaker pricing across the Permian; Q1 gas/NGL revenues after fees were -$11M
  • Service cost inflation risk (diesel up; service companies adjusting pricing); management claims drilling speed/completion efficiency has mostly outpaced increases but noted inflationary pressure persists
  • Derivative/GAAP volatility risk: Q1 net loss largely driven by -$127M derivative losses (91% unrealized), creating period-to-period GAAP swings even if operating cash flow remains positive
  • Execution/timing risk around midstream buildout: dependency on Targa high-pressure trunk line regulatory approval, construction schedule, and resulting ability to have wells ready by Q3
  • Commodity price environment sensitivity: hedges cover ~67% of remaining 2026; management notes optionality to speed up or slow down if macro/industry conditions deteriorate

Q&A: Analyst Interest

  • Topic: Earnout timing tied to midstream milestones: Management stated they have line of sight to early 2027 recognition. They linked earnout payments to New Mexico wells coming online post-Targa project and described a threshold of days producing, plus timing lag before the first $30M earnout in 1H’27. Subsequent payments expected ~one year later.
  • Topic: Production guidance split between timing vs well performance: Management said uplift is partly acceleration from running 2 rigs with a frac crew and partly performance, with all 2026-completed wells exceeding predrill forecasts. They cited 2-mile lateral execution and child-well dynamics at Champions improving early time pressure/rates and oil peaks.
  • Topic: LOE under guidance—what changed operationally: Management attributed Q1 LOE per BOE of $7.51 (below $8–$9) to chemical cost reductions in New Mexico (nearly halved per barrel) from a January program change and vendor rebidding/realignment. They also noted fewer ESP/tubing string replacements due to the chemical program and productivity aiding divisors.

Sentiment: POSITIVE

Note: This summary was synthesized by AI from the REPX Q1 2026 earnings transcript. Financial data is complex; please verify all metrics against official SEC filings before making investment decisions.

📋 Official Regulatory 10-K / 10-Q SEC Filings

Direct authenticated documentation links to audited SEC database reports for REPX.

SEC EDGAR Live Feed
Loading financial data and tables...
📁

SEC Filings (REPX)

© 2026 Stock Market Info — Riley Exploration Permian, Inc. (REPX) Financial Profile