Vital Energy, Inc.

Vital Energy, Inc. (VTLE) Market Cap

Vital Energy, Inc. has a market capitalization of $693.3M.

Price: $17.92

-0.18 (-0.99%)

Market Cap: 693.32M

NYSE · time unavailable

CEO: Mikell Jason Pigott

Sector: Energy

Industry: Oil & Gas Exploration & Production

IPO Date: 2011-12-15

Website: https://vitalenergy.com

Vital Energy, Inc. (VTLE) - Company Information

Market Cap: 693.32M|Sector: Energy

Company Profile

Vital Energy, Inc., an independent energy company, engages in the acquisition, exploration, and development of oil and natural gas properties in the Permian Basin of West Texas, the United States. The company was formerly known as Laredo Petroleum, Inc. and changed its name to Vital Energy, Inc. in January 2023. Vital Energy, Inc. was founded in 2006 and is headquartered in Tulsa, Oklahoma.

Analyst Sentiment

58%
Buy

From 10 Active Polls

1Y Forecast: $23.00

▲ +28.3% Potential Upside

Consensus Target Metrics

Low Bound

$23

Median

$23

High Bound

$23

Average

$23

Price & Moving Averages

Loading chart...

🎯 Wall Street Analyst Intelligence Report

1-Year structural target targets, chart projections, and sentiment maps.

Average 1Y Target
$23.00
▲ +28.35% Upside
Low Target
$23.00
28% Risk
Median Target
$23.00
28% Mid
High Target
$23.00
28% Max
Consensus
Hold
10 / 36 Buys

Consensus Trend Projection

Trailing closures vs. 12-month metrics map.

Analyst Vote Distribution

Aggregate institutional coverage sentiment weights.

📊 Historical Valuation Multiples

Real-time Trailing Twelve Month (TTM) momentum side-by-side with discrete quarterly metrics.

Fiscal QuarterTTMQ3 2025Q2 2025Q1 2025Q4 2024Q3 2024Q2 2024Q1 2024Q4 2023
Period EndingTrailing 12MSep 30, 2025Jun 30, 2025Mar 31, 2025Dec 31, 2024Sep 30, 2024Jun 30, 2024Mar 31, 2024Dec 31, 2023
Market Cap ($M)6936386087971,1591,0081,6421,8721,273
Enterprise Value ($M)3,0182,9632,9723,1703,6733,5473,3833,6883,011
Price to Earnings Ratio (P/E)-0.52-0.45-0.26-10.58-0.811.1711.18-7.081.13
Price/Earnings-to-Growth Ratio (PEG)-0.05-0.830.55
Price to Sales Ratio (P/S)0.371.521.411.562.172.193.453.882.86
Price to Book Ratio (P/B)0.390.360.290.300.430.330.580.670.46
Price to Free Cash Flow Ratio (P/FCF)1.062.232.416.76-3041.44-1.2514.70-40.48-5.28
Enterprise Value to Sales (EV/Sales)7.046.926.196.877.727.107.656.77
Enterprise Value to EBITDA (EV/EBITDA)-14.12-23.75-27.7514.38-18.167.0512.9128.895.89
Debt to Equity Ratio-10.881.331.140.900.950.840.630.800.63

📘 Full Research Report

ℹ️

AI-Generated Research: This report is for informational purposes only.

📘 VITAL ENERGY INC (VTLE) — Investment Overview

🧩 Business Model Overview

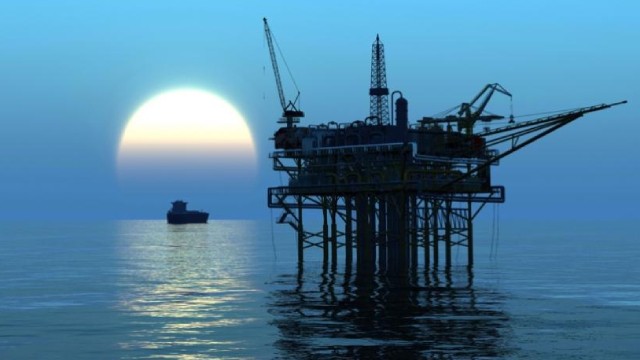
Vital Energy Inc is an onshore upstream oil and gas producer. The business generates value by developing a concentrated set of producing assets, drilling and completing wells to grow production, and selling oil, natural gas, and associated natural gas liquids (NGLs) into nearby market outlets. Profitability is driven by the gap between the all-in realized commodity price and the company’s operating cost structure (lease operating expenses, gathering/treatment costs, and development costs), alongside capital discipline and reserve quality.

💰 Revenue Streams & Monetisation Model

  • Commodity sales (primary): Revenue is predominantly tied to production volumes multiplied by realized prices for oil and gas (and NGLs where applicable). Realized pricing typically reflects basis differentials versus benchmark curves, plus product-specific pricing terms.
  • Fee-based byproducts (secondary): Where gas processing, gathering, or transportation arrangements exist, netback economics can shift based on contract structure and the degree of midstream integration/contracting.
  • Hedging impact (smoothing, not value creation): Many upstream companies use commodity hedges to reduce cash-flow volatility; hedging generally affects the earnings profile more than underlying asset value.

Margin drivers are (1) operating cost per unit of production, (2) development capital efficiency (cost per incremental barrel of proved reserve replacement), (3) transportation/gathering and processing economics, and (4) realized price/basis differential quality for the producing region.

🧠 Competitive Advantages & Market Positioning

Upstream “moats” are less about brand or customer switching costs and more about earning a sustained cost advantage and maintaining access to productive acreage. For Vital Energy, the primary competitive strength is typically expressed through:

  • Geographic cost advantage (low-cost producing core): In-basin drilling, lower decline volatility in good rock, and an operating footprint near processing and takeaway outlets can compress the cost of producing each barrel-equivalent unit.
  • Logistical infrastructure and netback quality: Proximity to gathering, treatment, processing, and pipeline connections can reduce basis risk and lower per-unit transportation/gathering costs. Contracting and operational familiarity with local midstream can also reduce downtime and curtailment exposure.
  • Acreage control and regulatory/operational know-how (intangible asset): Continuous development builds institutional knowledge, reduces execution risk, and preserves the value of drilling inventory with a clearer path to reserve conversion.

Competitive benchmarking: Vital Energy competes for capital and operating opportunities in the onshore E&P landscape against peers such as Devon Energy, EOG Resources, and Pioneer Natural Resources. Large peers often operate diversified, multi-basin portfolios and may have scale advantages in procurement and capital markets access. Vital’s positioning is generally more dependent on how well it concentrates capital into its most economic development inventory and sustains superior unit economics within its operating footprint.

🚀 Multi-Year Growth Drivers

  • Reserve growth through disciplined development: Sustainable growth comes from converting drilling inventory into proved reserves at attractive capital intensity and maintaining reserve replacement under commodity-cycle stress.
  • Cost curve improvements: Multi-well execution learning, operational optimization, and service-cost management can improve margins even when pricing is volatile.
  • Infrastructure and takeaway continuity: Ongoing alignment with gathering/processing capacity and pipeline access supports consistent production throughput and reduces the risk that growth is constrained by midstream bottlenecks.
  • TAM resilience via North American energy demand: Over a 5–10 year horizon, North American demand for natural gas and liquids continues to be shaped by industrial use, power generation, and petrochemical feedstock needs—supporting ongoing investment in effective supply.
  • Capital allocation flexibility: The ability to scale drilling up or down based on economics can protect balance sheets and maintain optionality to capture future cycle opportunities.

⚠ Risk Factors to Monitor

  • Commodity price risk: Oil and gas are priced in global markets; realized prices can diverge from benchmarks due to basis differentials and product mix.
  • Cost inflation and execution risk: Service cost inflation (drilling, completions, well workovers) and operational disruptions can impair development returns.
  • Regulatory and permitting volatility: Environmental rules, water handling requirements, methane-related compliance, and permitting timelines can increase both cost and schedule risk.
  • Midstream constraints: Limited gathering/processing availability, contract terms, or pipeline takeaway constraints can reduce netback quality or create production curtailment exposure.
  • Balance sheet and capital discipline: Upstream equity outcomes can be sensitive to leverage, refinancing conditions, and the company’s ability to fund development through varying cash-flow conditions.

📊 Valuation & Market View

The market commonly values upstream E&P businesses using a blend of reserve-based valuation (NAV), EV/EBITDAX or EV/EBITDA-style multiples, and cash-flow-based frameworks. Key valuation drivers include:

  • Unit economics: Operating costs, transportation/gathering netbacks, and capital efficiency (cost per incremental reserve/unit).
  • Reserve quality and replacement rate: How reliably the development inventory converts into proved reserves at sustainable returns.
  • Balance sheet risk: Net leverage, liquidity, and sensitivity to commodity-driven free cash flow.
  • Concentration risk: Degree of exposure to a specific basin, product mix, and pipeline/gathering dependence.

Multiple expansion is typically harder to sustain when investors perceive deteriorating cost structure, weaker reserve conversion, or increased regulatory/midstream constraints. Conversely, valuation can improve when cash flow resilience and reserve conversion quality are demonstrated through consistent execution.

🔍 Investment Takeaway

VTLE’s long-term investment case rests on whether it can sustain a regional cost advantage and protect netback quality through effective logistical positioning and disciplined capital deployment. In an industry where competition for economic wells is intense and commodity prices are cyclical, the durable edge typically emerges from superior unit economics, disciplined reserve conversion, and execution that preserves cash-flow strength across a commodity cycle.


⚠ AI-generated — informational only. Validate using filings before investing.

📰 Market News & Coverage

14 Stories Available

Real-time institutional reporting and market updates for VTLE.

gurufocus.com2026-02-17

Arnold Van Den Berg's Strategic Moves: MarketAxess Holdings Inc. Takes Center Stage

Insight into Arnold Van Den Berg (Trades, Portfolio)'s Fourth Quarter 2025 Investment Strategy Arnold Van Den Berg (Trades, Portfolio) recently submitted the 1

newsfilecorp.com2026-01-05

Vital Energy Annouces Acquisition of Crown Lands

Calgary, Alberta--(Newsfile Corp. - January 5, 2026) - Vital Energy Inc. (TSXV: VUX) (the "Corporation" or "Vital") announces that the Corporation acquired seven (7) sections totaling approximately 1,792 hectares of Alberta Crown petroleum and natural gas ("P&NG") rights in the Elmworth area of the Grande Prairie region, Alberta, for a total purchase price of $5,998,139, inclusive of bonus consideration and associated Crown fees. The acquired lands include P&NG rights from surface or base of the Nikanassin Formation to the base of the Halfway Formation under a four-year Northern P&NG License.

defenseworld.net2026-01-02

Vital Energy (NYSE:VTLE) & CN Energy Group. (NASDAQ:CNEY) Head to Head Review

CN Energy Group. (NASDAQ: CNEY - Get Free Report) and Vital Energy (NYSE: VTLE - Get Free Report) are both small-cap energy companies, but which is the better stock? We will compare the two companies based on the strength of their risk, profitability, earnings, institutional ownership, analyst recommendations, valuation and dividends. Risk and Volatility CN Energy Group.

defenseworld.net2025-12-28

Vital Energy (NYSE:VTLE) versus Bloom Energy (NYSE:BE) Head to Head Comparison

Bloom Energy (NYSE: BE - Get Free Report) and Vital Energy (NYSE: VTLE - Get Free Report) are both energy companies, but which is the better business? We will compare the two companies based on the strength of their valuation, dividends, profitability, institutional ownership, risk, analyst recommendations and earnings. Analyst Recommendations This is a summary of recent

businesswire.com2025-12-15

Crescent Energy Closes Transformative Acquisition of Vital Energy

HOUSTON--(BUSINESS WIRE)--Crescent Energy Company (NYSE: CRGY) (“Crescent” or the “Company”) today announced the closing of its previously announced acquisition of Vital Energy, Inc. (NYSE: VTLE) (“Vital Energy”), creating a leading, returns-driven independent E&P company. The all-stock transaction positions Crescent as a top ten liquids-weighted independent with a consistent strategy focused on free cash flow generation, disciplined capital allocation and sustainable long-term value creati.

defenseworld.net2025-12-14

Caxton Associates LLP Grows Stock Holdings in Vital Energy, Inc. $VTLE

Caxton Associates LLP lifted its position in Vital Energy, Inc. (NYSE: VTLE) by 126.4% during the undefined quarter, according to its most recent filing with the Securities and Exchange Commission. The firm owned 288,155 shares of the company's stock after buying an additional 160,878 shares during the quarter. Caxton Associates LLP owned approximately

globenewswire.com2025-12-12

Vital Energy Stockholders Approve Merger with Crescent Energy

TULSA, Okla., Dec. 12, 2025 (GLOBE NEWSWIRE) -- Vital Energy, Inc. (NYSE: VTLE) ("Vital Energy" or the "Company") today announced that, at a special meeting of Vital Energy stockholders held today, the stockholders of the Company approved the previously announced merger (the "Merger") between Vital Energy and Crescent Energy Company ("Crescent"). Vital Energy will file the final vote results for its special meeting on a Form 8-K with the U.S. Securities and Exchange Commission (the "SEC"). The Merger is anticipated to close on December 15, 2025.

businesswire.com2025-12-12

Crescent Stockholders Overwhelmingly Approve Merger with Vital Energy

HOUSTON--(BUSINESS WIRE)--Crescent Energy Company (NYSE: CRGY) (“Crescent” or the “Company”), today announced it received overwhelming stockholder approval for the issuance of Crescent Class A common stock in connection with its proposed merger (the “Merger”) with Vital Energy, Inc. (NYSE: VTLE) (“Vital Energy”) at a special meeting of stockholders held today. The Merger is expected to close on December 15, 2025. “We are pleased with the strong support from our shareholders in approving this hi.

prnewswire.com2025-12-08

Ares Management Set to Join S&P 500; Sezzle and Vital Farms to Join S&P SmallCap 600

NEW YORK , Dec. 8, 2025 /PRNewswire/ -- S&P Dow Jones Indices will make the following changes to the S&P 500 and S&P SmallCap 600:  Ares Management (NYSE: ARES) will replace Kellanova (NYSE: K) in the S&P 500 effective prior to the open of trading on Thursday, December 11. Mars Inc. is acquiring Kellanova in a deal expected to close soon, pending final closing conditions.

seekingalpha.com2025-11-16

Crescent-Vital Energy Deal Can Unlock Significant Value

Crescent Energy (CRGY) plans to acquire Vital Energy (VTLE) in an all-stock deal, creating a top 10 US independent oil and gas producer. The combined company would benefit from strong free cash flows, disciplined M&A history, and multi-basin exposure that would position it for significant potential synergies and potential re-rating. The stocks trade at deep discounts compared to the combined company's fair value, offering attractive upside even without the deal.

globenewswire.com2025-11-03

Vital Energy Reports Third-Quarter 2025 Financial and Operating Results

TULSA, Okla., Nov. 03, 2025 (GLOBE NEWSWIRE) -- Vital Energy, Inc. (NYSE: VTLE) ("Vital Energy" or the "Company") today reported third-quarter 2025 financial and operating results. Due to the Company's pending merger (the "Transaction") with Crescent Energy Company ("Crescent"), the Company will not be posting supplemental slides or hosting a conference call to discuss its quarterly results.

prnewswire.com2025-11-03

Shareholder Alert: The Ademi Firm continues to investigate whether Vital Energy Inc. is obtaining a Fair Price for its Public Shareholders

MILWAUKEE , Nov. 3, 2025 /PRNewswire/ -- The Ademi Firm is investigating Vital Energy (NYSE: VTLE) for possible breaches of fiduciary duty and other violations of law in its transaction with Crescent Energy Company. Click here to learn how to join our investigation and obtain additional information or contact us at gademi@ademilaw.com or toll-free: 866-264-3995.

zacks.com2025-10-29

Analysts Estimate Vital Energy (VTLE) to Report a Decline in Earnings: What to Look Out for

Vital Energy (VTLE) doesn't possess the right combination of the two key ingredients for a likely earnings beat in its upcoming report. Get prepared with the key expectations.

newsfilecorp.com2025-09-19

Vital Energy Announces AU$20 Million Loan

Calgary, Alberta--(Newsfile Corp. - September 19, 2025) - Vital Energy Inc. (TSXV: VUX) (the "Corporation") announces that it has entered into a loan agreement with an arm's length lender, for loan in the principal sum of AU$20,000,000 loan (the "Loan"). The Loan will be advanced in two instalments, matures on September 19, 2027, and funds advanced bear interest at a rate of 15% per annum, payable monthly.

📊 AI Financial Analysis

Powered by StockMarketInfo
Earnings Data: Q Ending 2025-09-30

"Valero Texas L.P. (VTLE) reported revenue of $420.83M for the quarter ending September 2025, but experienced a significant net loss of $353.52M, resulting in an EPS of -$9.35. The company displayed strong operating cash flow of $286.55M and maintained a free cash flow of the same amount, indicating it is able to generate cash despite its overall profitability concerns. VTLE's total assets stand at approximately $4.72B against total liabilities of $2.96B, leading to a solid equity position of $1.76B. However, the net debt stands at $2.32B, indicating a leveraged balance sheet that may pose risks in adverse conditions. With no dividends paid and a market price currently at zero, the shareholder returns evaluation reflects challenges. The consensus price target suggests potential upward movement, with a median target of $26.5. Overall, while VTLE shows sound cash generation, the persistent net losses and high leverage warrant caution in investment considerations."

Revenue Growth

Neutral

Revenue of $420.83M reflects a stable performance.

Profitability

Neutral

Significant net loss of $353.52M raises profitability concerns.

Cash Flow Quality

Positive

Strong operating cash flow of $286.55M provides good liquidity.

Leverage & Balance Sheet

Caution

High net debt of $2.32B introduces leverage risks.

Shareholder Returns

Neutral

No dividends paid and negative returns indicate shareholder concerns.

Analyst Sentiment & Valuation

Fair

Price target suggests potential upside, yet current market performance is unclear.

Disclaimer:This analysis is AI-generated for informational purposes only. Accuracy is not guaranteed and this does not constitute financial advice.

Fundamentals Overview

Loading fundamentals overview...

So What?: Management is pushing a clear cost-down narrative: EBITDAX of $338M and $36M adjusted free cash flow, with explicit per-foot savings ($5/ft, $13/ft, $9/ft) and a < $111M/quarter LOE run-rate (from $115M–$120M) plus nearly 20% lower G&A after ~10% headcount reduction. They also de-risk 2H by hedging (95% of oil at $69/bbl) and by timing controls (38 wells to be producing by October; Q3/Q4 volumes flat). However, the Q&A shows lingering execution/timing pressure: $13M drilling overruns in May and the admission that Q4 flush production will “come down a little” into 2026 due to turn-in-line cadence. On leverage, they refuse to give numbers but imply continued debt paydown in 2026 and claim a 2026 corporate breakeven below $55/bbl (likely dropping to low $50s with additional Q3 hedges).

AI IconGrowth Catalysts

  • 38 wells scheduled to turn in line over the next 2.5 months; all expected to be producing by October
  • J-Hook well design optimization: estimate ~130 of 10,000-foot straight locations can be converted into 90 J-Hook locations at 15,000 feet
  • Capital efficiency gains enabling stronger adjusted free cash flow (AFCF) in 2H 2025 and beyond

Business Development

  • Point acquisition noncore/portfolio optimization (closed late last year; used as cost-savings base for LOE reduction)
  • Noncore asset sales: closed an additional $6.5 million sale to support debt reduction (no buyer/counterparty named)

AI IconFinancial Highlights

  • Consolidated EBITDAX: $338 million
  • Adjusted free cash flow: $36 million
  • Capital for the quarter: $257 million (above high end of guidance); increase driven by $11 million activity accelerated from Q3 and $13 million drilling cost overruns (technical challenges resolved; improved performance/cost consistency on newer wells)
  • Weather/temporary curtailments reduced average daily production by 780 boe/day (~500 boe/day oil) yet volumes stayed within guidance range
  • LOE reduction: lease operating expense run-rate reduced from $115M–$120M/quarter to < $111M/quarter over past 3 quarters; drivers included service contract renegotiations, optimized chemical usage, more efficient power generation, and consolidation of lease operator routes
  • Sustainable incremental cash flow: +$25 million per year from cost optimization efforts
  • G&A reduction: reduced employee/contractor headcount by ~10%, driving nearly 20% reduction in total G&A vs average of prior 3 quarters
  • Net debt: rose by $8 million at end of Q2 (net working capital reduced by $41 million, in line with expectations)
  • Noncash pretax impairment plus federal net deferred tax asset valuation allowance recorded (details in press release); management stated neither impacts ability to generate AFCF, reduce debt, or utilize NOLs
  • Hedge position (2H 2025): swapped ~95% of expected second-half oil production at average $69/bbl; hedged ~85% natural gas and 75% ethane/propane volumes

AI IconCapital Funding

  • Capital investment guidance: on track to meet midpoint of $875 million (no change stated)
  • Net debt reduction target: ~ $25 million reduction in Q3; ~$185 million total reduction for remainder of 2025
  • Capital acceleration: $11 million of activity pulled forward from Q3
  • Noncore asset sale proceeds: additional $6.5 million closed (amount noted; use stated to support debt reduction goals)
  • No explicit buyback or ending cash balance disclosed in transcript

AI IconStrategy & Ops

  • Operational cost/unit savings (per-foot) from optimization initiatives in Q2:
  • - Horseshoe wells: 3 horseshoe wells using water-based fluids vs oil-based mud; saving $5/foot
  • - Completion stage architecture: reduced pumping cycle times by 9%; saving $13/foot
  • - Delaware Basin drill-out: shaved one day off drill-out cycle time; 30% improvement in drillout speed; saving $9/foot
  • Advanced drilling/completion performance:
  • - Drilled 9 longest wells in company history; longest lateral 16,515 feet
  • - Delaware Basin records: most feet drilled in a single day; most feet completed in a week
  • - Midland County Horseshoe: drilled 6 of 12 Horseshoe wells in the quarter; after quarter drilled 5 more; expect to finish the 12th in coming days; claimed first stacked horseshoe development of its kind
  • J-Hook execution: first 2 J-Hook wells completed; turned 3 wells into 2, saving millions in drilling capital
  • Employee/corporate streamlining: reduced combined employee and contractor headcount by ~10%
  • Workover/LOE strategic pivot into 2026: building gas lift infrastructure to support campaign transitioning off high-cost ESPs to a more gas-lift effective structure; expected benefit in workover in 2026
  • Production timing management: capital acceleration intended to de-risk timing rather than accelerate overall activity; keeping Q3 and Q4 volumes flat to prior guide

AI IconMarket Outlook

  • 2H 2025 production plan: 38 remaining wells to bring online; 3 contribute to 33 of 38; focused delivery of large well packages
  • Exit 2025: expected to exit year high in Q4 due to flush production; will come down into 2026 given turn-in-line cadence timing
  • 2025 well timing: all 38 wells should be producing by October
  • 2026: no full-year 2026 guidance provided; management expects corporate breakeven to remain low with hedges

AI IconRisks & Headwinds

  • Production impacts: weather-related impacts and temporary curtailments reduced daily production by 780 boe/day (~500 boe/day oil), though within guidance range
  • Capital overspend risk materialized: $13 million drilling cost overruns on wells drilled in May (technical challenges resolved; improved cost consistency on newer wells)
  • Timing/cadence risk into 2026: flush production in Q4 expected to moderate into 2026 because of turn-in-line cadence timing (not quantified, but acknowledged as downtrend)

Sentiment: MIXED

Note: This summary was synthesized by AI from the VTLE Q2 2025 earnings transcript. Financial data is complex; please verify all metrics against official SEC filings before making investment decisions.

📋 Official Regulatory 10-K / 10-Q SEC Filings

Direct authenticated documentation links to audited SEC database reports for VTLE.

SEC EDGAR Live Feed
No recent 10-K available.
No recent 10-Q available.
Loading financial data and tables...
📁

SEC Filings (VTLE)

© 2026 Stock Market Info — Vital Energy, Inc. (VTLE) Financial Profile