Red Rock Resorts, Inc.

Red Rock Resorts, Inc. (RRR) Market Cap

Red Rock Resorts, Inc. has a market capitalization of $3.78B.

Price: $64.44

-0.49 (-0.75%)

Market Cap: 3.78B

NASDAQ · time unavailable

CEO: Frank J. Fertitta

Sector: Consumer Cyclical

Industry: Gambling, Resorts & Casinos

IPO Date: 2016-04-27

Website: https://www.redrockresorts.com

Red Rock Resorts, Inc. (RRR) - Company Information

Market Cap: 3.78B|Sector: Consumer Cyclical

Company Profile

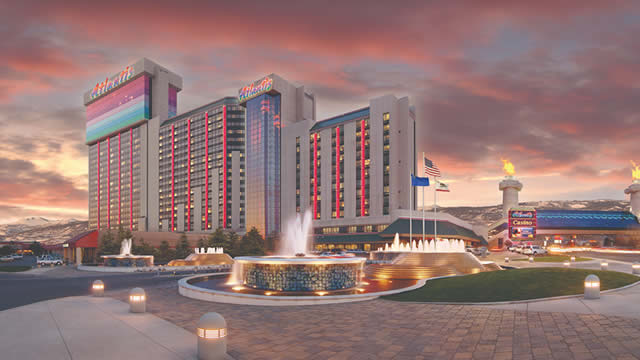
Red Rock Resorts, Inc. is a company that develops and operates casino and entertainment properties throughout the United States. This is primarily achieved through its investments in Station Holdco and Station LLC. The business is categorized into two main divisions: Las Vegas Operations and Native American Management. In the Las Vegas regional market, the company owns and runs a total of 19 gaming facilities, comprising 9 larger entertainment complexes and 10 smaller casinos. Additionally, Red Rock Resorts manages the Graton Resort & Casino, situated in northern California. By December 31, 2021, its Las Vegas properties featured roughly 13,894 slot machines, 240 table games, and 3,081 hotel rooms. The enterprise, originally founded in Las Vegas, Nevada, in 1976, officially became Red Rock Resorts, Inc. in January 2016, after operating for years as Station Casinos Corp.

Analyst Sentiment

81%
Strong Buy

From 18 Active Polls

1Y Forecast: $72.00

▲ +11.7% Potential Upside

Consensus Target Metrics

Low Bound

$61

Median

$72

High Bound

$79

Average

$72

Price & Moving Averages

Loading chart...

🎯 Wall Street Analyst Intelligence Report

1-Year structural target targets, chart projections, and sentiment maps.

Average 1Y Target
$72.00
▲ +11.73% Upside
Low Target
$61.00
-5% Risk
Median Target
$72.00
12% Mid
High Target
$79.00
23% Max
Consensus
Buy
22 / 30 Buys

Consensus Trend Projection

Trailing closures vs. 12-month metrics map.

Analyst Vote Distribution

Aggregate institutional coverage sentiment weights.

📊 Historical Valuation Multiples

Real-time Trailing Twelve Month (TTM) momentum side-by-side with discrete quarterly metrics.

Fiscal QuarterTTMQ1 2026Q4 2025Q3 2025Q2 2025Q1 2025Q4 2024Q3 2024Q2 2024
Period EndingTrailing 12MMar 31, 2026Dec 31, 2025Sep 30, 2025Jun 30, 2025Mar 31, 2025Dec 31, 2024Sep 30, 2024Jun 30, 2024
Market Cap ($M)3,7843,1063,6353,6043,0962,5962,8203,2793,227
Enterprise Value ($M)3,7193,0413,5516,8866,3595,8466,0986,6086,538
Price to Earnings Ratio (P/E)15.4218.0311.9112.9413.558.4114.6316.4022.41
Price/Earnings-to-Growth Ratio (PEG)1.562.3719.242.47
Price to Sales Ratio (P/S)1.876.127.107.585.885.215.697.016.64
Price to Book Ratio (P/B)26.2821.7617.4516.4115.2210.5113.1118.6820.30
Price to Free Cash Flow Ratio (P/FCF)6.32137.408.6048.3239.3876.7425.1187.0653.73
Enterprise Value to Sales (EV/Sales)5.996.9414.4812.0811.7412.3014.1213.44
Enterprise Value to EBITDA (EV/EBITDA)4.6215.1217.9737.6328.5429.5030.0639.1535.20
Debt to Equity Ratio-0.080.490.2815.5416.7513.7716.0019.6321.68

📘 Full Research Report

ℹ️

AI-Generated Research: This report is for informational purposes only.

📘 RED ROCK RESORTS ORS CLASS A INC (RRR) — Investment Overview

🧩 Business Model Overview

Red Rock Resorts is a Las Vegas–focused gaming and hospitality operator. The business model is straightforward: it generates consumer demand at its properties and converts that demand into revenue streams across gaming (slot and table games) and non-gaming amenities (rooms, food & beverage, entertainment, and related “on-property” spend). The operating engine is property-level throughput—driven by visitation, customer mix, and the ability to manage costs while sustaining appealing facilities. A key feature of the model is the linkage between gaming floors and cross-spend: customers who choose a property for gaming often consume lodging, dining, and entertainment, increasing revenue per visitor even when gaming volumes fluctuate.

💰 Revenue Streams & Monetisation Model

Revenue is primarily derived from:
  • Casino gaming revenue (slots and table games), which is the dominant earnings driver.
  • Rooms revenue, which tends to be supported by event/tourism demand and property attractiveness.
  • Food & beverage and other on-property revenue, which benefits from higher on-site visitation.
  • Sports betting and adjacent wagering, where monetisation depends on product availability, marketing efficiency, and customer retention.
Margin dynamics are driven by:
  • Operating leverage: fixed labor and overhead components can be absorbed as visitation rises.
  • Cost discipline: controlling labor hours, comps/marketing intensity, and vendor costs while maintaining guest experience.
  • Revenue mix: the proportion of high-return gaming activity versus lower-margin services affects operating income conversion.

🧠 Competitive Advantages & Market Positioning

The moat is best characterized as an asset- and location-based advantage with meaningful but not absolute customer stickiness.
  • Location and destination utility: Red Rock’s Las Vegas positioning supports recurring demand from leisure tourists and local/regional players seeking a convenient, integrated entertainment environment.
  • Operational scale and learning curve: experienced property operations improve labor productivity, vendor procurement, and yield management (especially across gaming, rooms, and food & beverage).
  • Customer retention mechanisms (loyalty and offers): while patrons can switch between casinos, loyalty tooling and personalized offers reduce churn and support more stable play patterns.
  • Integrated resort cross-sell: gaming drives non-gaming spend, and non-gaming spend increases the probability of repeat gaming visitation—creating a self-reinforcing revenue ecosystem at the property level.
Competitive benchmarking (industry context) Primary competitors for Las Vegas visitation and gambling spend include:
  • MGM Resorts (integrated Strip/regional scale)
  • Caesars Entertainment (portfolio scale and established national loyalty)
  • Station Casinos (Boyd Gaming historically as a key comp set in the local segment) (Southwest/locals-focused positioning in the broader market)
Contrast in industry focus: Red Rock is positioned more squarely in the Las Vegas local and “off-Strip” / master-planned leisure demand profile, with emphasis on property-level entertainment and cross-spend rather than relying solely on mega-brand Strip tourism. This can support a different mix of customer behavior and cost structure versus fully integrated mega-resort peers.

🚀 Multi-Year Growth Drivers

Over a 5–10 year horizon, the main growth vectors are structural demand expansion and incremental monetisation rather than dependence on a single product cycle:
  • Tourism and visitation tailwinds: Las Vegas demand is tied to broader travel trends, domestic and international tourism flows, and travel willingness that typically rises with income and leisure spending.
  • Premiumization and mix management: improving the yield of gaming activity and elevating the mix of high-value guests supports revenue per visitor without requiring proportional increases in fixed costs.
  • Expansion of wagering products: sports betting and related digital offerings can grow with product refinement, compliance maturation, and customer acquisition efficiency (subject to regulation and competitive intensity).
  • Non-gaming attachment: leveraging property entertainment and lodging inventory to increase share of wallet per visitor can smooth results versus pure gaming demand fluctuations.
  • Systematized operational improvement: experienced resort operators can sustain gains in labor productivity, yield management, and cost efficiency, which compound over time.

⚠ Risk Factors to Monitor

Key structural risks include:
  • Regulatory and licensing risk: gaming and sports wagering are subject to licensing, taxation, and regulatory requirements that can change with policy.
  • Discretionary demand cyclicality: consumer spending on leisure and gaming can decline during macroeconomic stress, pressuring volumes and mix.
  • Competition and regional capture: aggressive promotional strategies by large multi-property operators can increase customer acquisition and discount intensity.
  • Capital intensity and execution risk: facility upgrades, technology investment, and capacity decisions require capital and can face cost overruns or slower-than-expected payback.
  • Labor and input cost inflation: service-heavy operations are exposed to wage rates and benefits costs, which can compress margins if not offset by productivity.
  • Sports betting execution and technology risk: platform reliability, customer management, and compliance operations influence both growth and profitability.

📊 Valuation & Market View

Gaming operators are typically valued using EV/EBITDA (and often related enterprise value multiples) because cash generation at the property level is a primary driver of equity value. Market pricing tends to respond to:
  • Sustainable EBITDA margin profile (cost discipline, mix, and operating leverage)
  • Visibility of cash flows (stability of visitation and ability to maintain pricing power)
  • Capital allocation discipline (maintenance vs. growth capex and return on invested capital)
  • Regulatory outlook for wagering (market structure, tax rates, and competitive dynamics)
Because asset-level earnings drive valuation, investors often underwrite operating performance through volume assumptions, mix expectations, and cost trajectories rather than relying on accounting earnings alone.

🔍 Investment Takeaway

Red Rock Resorts offers an institutional long-term thesis anchored in property-based competitive positioning, an operational scale/learning advantage, and a cross-sell revenue ecosystem where gaming visitation supports lodging and on-property spend. The investment case relies on sustained demand in the Las Vegas leisure market, disciplined cost management, and continued monetisation improvements (including wagering and non-gaming attachment), while acknowledging that cyclicality, competition, and regulatory changes remain the principal determinants of performance.

⚠ AI-generated — informational only. Validate using filings before investing.

📰 Market News & Coverage

15 Stories Available

Real-time institutional reporting and market updates for RRR.

zacks.com2026-07-28

Analysts Estimate Red Rock Resorts (RRR) to Report a Decline in Earnings: What to Look Out for

Red Rock Resorts (RRR) doesn't possess the right combination of the two key ingredients for a likely earnings beat in its upcoming report. Get prepared with the key expectations.

defenseworld.net2026-07-21

Bessemer Group Inc. Has $4.35 Million Stock Position in Red Rock Resorts, Inc. $RRR

Bessemer Group Inc. lifted its stake in Red Rock Resorts, Inc. (NASDAQ: RRR) by 48.5% during the undefined quarter, according to its most recent 13F filing with the Securities and Exchange Commission. The fund owned 81,494 shares of the company's stock after purchasing an additional 26,600 shares during the period. Bessemer Group Inc.

seekingalpha.com2026-07-17

Red Rock Resorts: Las Vegas Growth And Scarce Land

Red Rock Resorts offers a durable Las Vegas locals casino business and a unique portfolio of scarce, gaming-entitled development land. RRR benefits from recurring local demand, demographic tailwinds, and strong barriers to entry due to regulatory restrictions on new casino sites. Expansion projects like Durango North are positioned to capture population growth, with management targeting >6,000 additional households within three miles.

zacks.com2026-07-14

PENN or RRR: Which Is the Better Value Stock Right Now?

Investors interested in Gaming stocks are likely familiar with PENN Entertainment (PENN) and Red Rock Resorts (RRR). But which of these two stocks offers value investors a better bang for their buck right now?

zacks.com2026-07-10

New Strong Sell Stocks for July 10th

HON, RRR and SAMG have been added to the Zacks Rank #5 (Strong Sell) List on July 10, 2026.

prnewswire.com2026-07-01

Red Rock Resorts Announces Date of Second Quarter 2026 Conference Call and Earnings Release Date

LAS VEGAS, July 1, 2026 /PRNewswire/ -- Red Rock Resorts, Inc. ("Red Rock Resorts", "we" or the "Company") (NASDAQ: RRR) announced today that it will release the Company's financial results for the second quarter 2026 on Tuesday, August 4, 2026 and will hold a conference call on the same day at 4:30 p.m. ET (1:30 p.m.

gurufocus.com2026-06-05

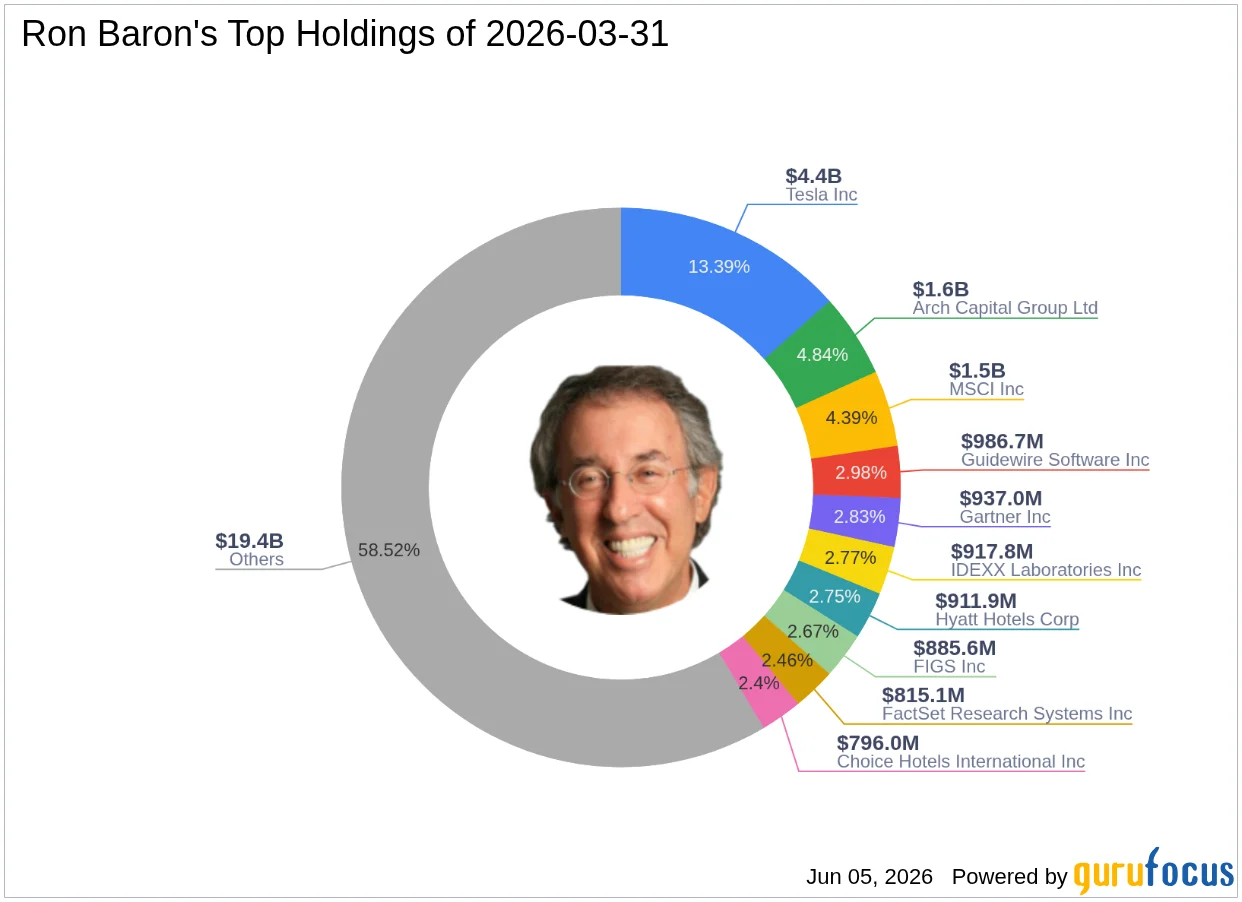
Ron Baron's Strategic Acquisition of Red Rock Resorts Inc Shares

On May 31, 2026, Ron Baron (Trades, Portfolio) executed a significant stock transaction involving Red Rock Resorts Inc (RRR). This transaction saw the addition

zacks.com2026-06-01

CHDN or RRR: Which Is the Better Value Stock Right Now?

Investors interested in Gaming stocks are likely familiar with Churchill Downs (CHDN) and Red Rock Resorts (RRR). But which of these two companies is the best option for those looking for undervalued stocks?

247wallst.com2026-05-30

After Caesars Goes Private, These 3 Casino Stocks Are Next on the Buyout List, Ranked

On May 28, 2026, Caesars Entertainment (NASDAQ: CZR | CZR Price Prediction) announced a definitive agreement to be acquired by Fertitta Entertainment.

zacks.com2026-05-29

Why Is Red Rock Resorts (RRR) Up 7.1% Since Last Earnings Report?

Red Rock Resorts (RRR) reported earnings 30 days ago. What's next for the stock?

zacks.com2026-05-15

CHDN vs. RRR: Which Stock Is the Better Value Option?

Investors interested in stocks from the Gaming sector have probably already heard of Churchill Downs (CHDN) and Red Rock Resorts (RRR). But which of these two stocks is more attractive to value investors?

gurufocus.com2026-05-13

A Look at Red Rock Resorts Inc (RRR) After 3.8% Decline -- GF Value $65.79 vs Price $51.04

On May 13, 2026, Red Rock Resorts Inc (RRR) shares fell 3.8% today, bringing the current price to $51.04. Over the last year, the stock has seen a range between

seekingalpha.com2026-05-11

Red Rock Resorts Q1 2026 Earnings: Focus On The Long Term

Red Rock Resorts dominates the Las Vegas locals' gaming market with eighteen outlets and seven major resorts. RRR reported Q1 2026 revenue of $507M (+2% yoy) and adjusted EBITDA of $213M (-1% yoy), with margins pressured by property renovations. Renovations at Durango and Green Valley Ranch are causing short-term EBITDA and margin declines but are expected to drive future growth.

seekingalpha.com2026-05-04

Diamond Hill Small Cap Strategy Q1 2026 Portfolio Review

Exploration and production company Magnolia Oil & Gas saw shares rise as the sharp increase in oil prices drove a broad rally across US-based oil producers. Red Rock Resorts' fundamentals remained solid, though the stock faced pressure in Q1 as investors linked gaming demand to discretionary spending trends. Recent Knowles' strategic initiatives have reshaped the portfolio toward higher-margin, mission-critical end markets with more durable demand drivers.

seekingalpha.com2026-04-30

Red Rock Resorts, Inc. (RRR) Q1 2026 Earnings Call Transcript

Red Rock Resorts, Inc. (RRR) Q1 2026 Earnings Call Transcript

📊 AI Financial Analysis

Powered by StockMarketInfo
Earnings Data: Q Ending 2026-03-31

"RRR reported Q1 2026 revenue of $507.3M and net income of $42.9M, with EPS of $0.74. On a YoY basis, revenue declined -3.9% (vs. Q1 2025), while net income fell -4.1% (vs. Q1 2025). QoQ, revenue edged down -0.9% (vs. Q4 2025) and net income declined -4.0%. Profitability was mixed across the quarter and over the year. Gross margin was roughly stable at ~51.8% (down slightly vs. Q4 2025 and Q1 2025 where margins were ~51.5–62.6%). Operating income of $143.7M translated to an operating margin of 28.3%, which is broadly steady to slightly down QoQ. Cash flow reporting is inconsistent across quarters (Q1 2026 operating cash flow is shown as 0), but the balance sheet shows meaningful resilience: total assets were $4.22B with cash of $134.0M. Equity shrank to $247.6M from $332.3M at Q4 2025, and net debt remained negative (net cash) at about -$64M. Shareholder returns appear favorable from market momentum: the stock is up +39.6% over 1 year (as of the provided market data) alongside a modest dividend yield (~2.4%)."

Revenue Growth

Caution

Q1 2026 revenue was $507.3M: -0.9% QoQ and -3.9% YoY, indicating a mild contraction rather than an accelerating trend.

Profitability

Neutral

Net income was $42.9M: -4.0% QoQ and -4.1% YoY. Operating margin was 28.3% in Q1 2026, broadly stable QoQ but not showing a clear expansion trend vs prior-year periods.

Cash Flow Quality

Fair

Q1 2026 cash flow lines appear non-informative (operating cash flow reported as 0). Balance-sheet liquidity is solid (cash ~$134.0M) with no dividends/buybacks reflected in the provided Q1 2026 cash flow.

Leverage & Balance Sheet

Positive

Net debt remains negative (net cash ~-$64M). Total assets were $4.22B; however, equity declined to ~$247.6M from ~$332.3M QoQ, which tempers the balance-sheet outlook.

Shareholder Returns

Good

1Y price momentum is strong (+39.6%), and the dividend yield is ~2.36%. Buybacks/dividends are not clearly evidenced in Q1 2026 cash flow, but total return backdrop from price is positive.

Analyst Sentiment & Valuation

Neutral

Price is $56.91 vs consensus target $71 (implied upside ~25%). Valuation metrics shown are mixed (e.g., P/E ~18), suggesting not distressed but not obviously cheap.

Disclaimer:This analysis is AI-generated for informational purposes only. Accuracy is not guaranteed and this does not constitute financial advice.

Fundamentals Overview

Loading fundamentals overview...

Red Rock delivered a strong Q1 on revenue and cash generation but posted year-over-year EBITDA margin compression, with management attributing most of the 113–129 bps decline to Green Valley Ranch hotel disruption rather than structural cost inflation. Consolidated revenue rose 1.9% to $507.3M while adjusted EBITDA fell 1.2% to $212.6M. Despite margin pressure, free cash flow conversion was solid (50.3%), producing $107M (~$1.03/share), supporting ongoing investment and shareholder returns. Guidance emphasis is operational: Q2 seasonality typically brings a 8%–9% decline from Q1 plus continued disruptions—$9M at GVR and $2M–$3M at Durango. On growth, management highlighted Durango’s premium expansion momentum and detailed Durango North (summer 2027, ~$385M) plus sustained capex at Sunset Station and GVR. North Fork remains on-track for turnover late June and early Q4 opening, funded/financed with note receivable ~$80.6M.

AI IconGrowth Catalysts

  • Durango expansion momentum: >25,000 sq ft casino space, premier high-limit slot area, and nearly 2,000 covered parking added in Dec 2025; management cites ~4+ months of results validating premium slot/table investment
  • Durango North (summer 2027): expected +275,000 sq ft on north side, nearly 400 additional slot machines, and new amenities (36-lane bowling, luxury movie theaters, new dining/entertainment) to drive repeat visitation
  • Premium room/product refresh progress at Sunset Station (podium refresh on track through 2026) and Green Valley Ranch (West Tower + convention areas reopened; East Tower on schedule through late summer 2026)

Business Development

  • Moonshine Flats partnership: brings its Country Western Bar and live music concept to Las Vegas for the first time as part of Durango North expansion

AI IconFinancial Highlights

  • Las Vegas segment: net revenue $499.5M (+0.9% YoY); adjusted EBITDA $232.4M (-1.5% YoY); adjusted EBITDA margin 46.5% (-113 bps YoY)
  • Consolidated: net revenue $507.3M (+1.9% YoY); adjusted EBITDA $212.6M (-1.2% YoY); adjusted EBITDA margin 41.9% (-129 bps YoY)
  • Cash generation: converted 50.3% of adjusted EBITDA into operating free cash flow; generated $107M (~$1.03/share)
  • Disruption-driven margin decline attribution (Q1): payroll up <3%, elevated utilities, and losses/damages; management states ~half of EBITDA margin degradation due to Green Valley hotel disruption
  • Guided disruption for Q2: $9M disruption at Green Valley Ranch and incremental $2M–$3M disruption at Durango
  • Seasonality: typical Q1 to Q2 decline of ~8% to 9% (management referenced 8%–10% also); no major one-time items besides the previously disclosed GVR disruption and ongoing construction timing

AI IconCapital Funding

  • Cash & debt: cash $134M; total debt $3.6B; net debt $3.4B; net debt/EBITDA 4.07x
  • Shareholder returns in quarter: distributions ~$139.9M to Station Holdco LLC unitholders (including ~$82.1M to Red Rock Resorts); special dividend $1.00/Class A; quarterly dividend $0.26/Class A
  • Share repurchase: ~635,000 Class A shares repurchased at avg ~$6.32 under $900M program; reduced shares outstanding to ~104.4M
  • Total capital returned: ~$170.5M (dividends + repurchases) in Q1
  • CapEx: Q1 capital spend $117.2M (investment $87.2M, maintenance $30.0M); full-year 2026 expected $375M–$425M (investment $275M–$300M; maintenance $100M–$125M)

AI IconStrategy & Ops

  • Durango construction staging: heavy lift phase beginning; cement poured; mobilizing cranes early Q2/Q3; erecting steel expected to increase disruption through the summer to completion
  • Sunset Station: Gaudi Bar reopening in coming weeks; remaining podium refresh amenities to open throughout 2026; next phase work (casino refresh, movie theater expansion, bingo relocation, Highland steakhouse conversion) starting in Q2 with extension into 2027; total phase cost ~$87M
  • Green Valley Ranch: West Tower + convention spaces reopened; East Tower renovations underway, expected through late summer 2026; next casino-floor + entertainment/food&bev enhancements expected to extend into 2027; total cost ~$56M
  • North Fork: construction progress to permanent power; targeting turnover of first casino-floor phase late June and early Q4 2026 opening; project cost ~$750M fully financed; Red Rock note balance due from Tribe ~$80.6M

AI IconMarket Outlook

  • Q2 disruption expectations: GVR $9M disruption and Durango $2M–$3M disruption (incremental to Q1); seasonality expects Q1 to Q2 down ~8% to 9%
  • Durango North expansion schedule: opening in summer 2027; estimated total cost ~$385M
  • North Fork opening timeline: turnover late June; early Q4 2026 open

AI IconRisks & Headwinds

  • Adjusted EBITDA margin pressure year-over-year: -113 bps (Las Vegas) and -129 bps (consolidated), primarily linked (management estimate) to Green Valley hotel disruption and other transitory costs (utilities, losses/damages)
  • Ongoing construction disruptions across properties: Q1 traffic disruption at Durango; Q2 expected $9M GVR disruption plus incremental $2M–$3M Durango disruption
  • Travel-related volatility: management characterized TSA/air travel disruption and gas price impacts as not materially affecting Q1 overall results by April, but noted March/period impacts
  • Hotel room inventory temporarily offline at GVR: ~27,000 room nights offline (~10% of inventory) driving disruption and related profit headwinds

Q&A: Analyst Interest

  • Q2 disruption sizing and duration: Analysts asked how management expects Durango/GVR disruption to evolve beyond Q2 through the projects’ timelines. Management reiterated Durango’s $2M–$3M estimate stays through summer to project completion and confirmed GVR’s $9M disruption remains the same, tied to construction ramp and heavy-lift phases.
  • EBITDA margin bridge and what’s transitory: Analysts requested decomposition of the year-over-year EBITDA margin decline into disruption vs persistent OpEx inflation. Management said payroll rose under 3% (in line with broader cost behavior), utilities were elevated, and the majority of margin degradation was from Green Valley hotel disruption (about half), with additional uncontrollables like damages/losses.
  • Durango expansion returns and early demand signals: Analysts sought evidence of returns and customer traction since Durango’s premium areas opened. Management (Scott) cited the “Durango zone” showing notably higher net deal vs last year, supporting the thesis that continued Durango capital investment works even while teams manage traffic disruption, and management maintained confidence in incremental returns.

Sentiment: MIXED

Note: This summary was synthesized by AI from the RRR Q1 2026 earnings transcript. Financial data is complex; please verify all metrics against official SEC filings before making investment decisions.

📋 Official Regulatory 10-K / 10-Q SEC Filings

Direct authenticated documentation links to audited SEC database reports for RRR.

SEC EDGAR Live Feed
Loading financial data and tables...
📁

SEC Filings (RRR)

© 2026 Stock Market Info — Red Rock Resorts, Inc. (RRR) Financial Profile