YETI Holdings, Inc.

YETI Holdings, Inc. (YETI) Market Cap

YETI Holdings, Inc. has a market capitalization of $3.59B.

Price: $47.37

-0.45 (-0.94%)

Market Cap: 3.59B

NYSE · time unavailable

CEO: Matthew J. Reintjes

Sector: Consumer Cyclical

Industry: Leisure

IPO Date: 2018-10-25

Website: https://www.YETI.com

YETI Holdings, Inc. (YETI) - Company Information

Market Cap: 3.59B|Sector: Consumer Cyclical

Company Profile

YETI Holdings, Inc. designs, markets, retails, and distributes products for the outdoor and recreation market under the YETI brand. The company offers hard and soft coolers, as well as cargo, bags, outdoor living, and associated accessories. It also provides drinkware products, such as colsters, lowballs, wine tumblers, stackable pints, mugs, tumblers, bottles, and jugs, as well as accessories comprising bottle straw caps, tumbler handles, jug mounts, and bottle slings under the Rambler brand. In addition, the company offers YETI-branded gear products, such as hats, shirts, bottle openers, and ice substitutes. It sells its products through independent retailers, including outdoor specialty, hardware, sporting goods, and farm and ranch supply stores, as well as through Website. The company operates in the United States, Canada, Australia, New Zealand, Europe, Hong Kong, China, Singapore, and Japan. YETI Holdings, Inc. was founded in 2006 and is headquartered in Austin, Texas.

Analyst Sentiment

71%
Buy

From 16 Active Polls

1Y Forecast: $50.44

▲ +6.5% Potential Upside

Consensus Target Metrics

Low Bound

$42

Median

$51

High Bound

$60

Average

$50

Price & Moving Averages

Loading chart...

🎯 Wall Street Analyst Intelligence Report

1-Year structural target targets, chart projections, and sentiment maps.

Average 1Y Target
$50.44
▲ +6.48% Upside
Low Target
$42.00
-11% Risk
Median Target
$51.00
8% Mid
High Target
$60.00
27% Max
Consensus
Buy
11 / 22 Buys

Consensus Trend Projection

Trailing closures vs. 12-month metrics map.

Analyst Vote Distribution

Aggregate institutional coverage sentiment weights.

📊 Historical Valuation Multiples

Real-time Trailing Twelve Month (TTM) momentum side-by-side with discrete quarterly metrics.

Fiscal QuarterTTMQ2 2026Q1 2026Q3 2025Q2 2025Q1 2025Q4 2024Q3 2024Q2 2024
Period EndingTrailing 12MApr 4, 2026Jan 3, 2026Sep 27, 2025Jun 28, 2025Mar 29, 2025Dec 31, 2024Sep 28, 2024Jun 29, 2024
Market Cap ($M)3,5892,7393,4442,8242,5312,7333,2303,4463,235
Enterprise Value ($M)3,6862,8353,4842,8832,4382,6573,0443,3433,199
Price to Earnings Ratio (P/E)22.4969.5014.7817.9212.3741.1415.1915.3116.05
Price/Earnings-to-Growth Ratio (PEG)0.751.910.461.074.750.45
Price to Sales Ratio (P/S)1.897.205.905.795.687.785.917.206.98
Price to Book Ratio (P/B)5.414.155.304.023.153.584.364.484.58
Price to Free Cash Flow Ratio (P/FCF)13.59-62.5721.2631.7044.59-28.5317.8346.6877.89
Enterprise Value to Sales (EV/Sales)7.455.975.915.477.575.576.996.90
Enterprise Value to EBITDA (EV/EBITDA)14.21107.3638.8642.3032.4376.3132.0540.9140.23
Debt to Equity Ratio0.370.340.350.320.220.240.230.230.25

YETI Growth Runway Model

Standard long term linear growth fade

Multi-Stage Discounted Cash Flow Sandbox

Market Price$47.37
Intrinsic Value$46.59
Market Alignment
Overvalued by 1.6%relative to calculated intrinsic value
9.00%
Exp: 1%1%
i

Growth runway slowdown

This value provides a time window for the growth rate to decline beyond Stage 1 toward the terminal rate. Longer windows are most useful for companies with high growth starting conditions or strong competitive advantages. This option stretches out the growth rate slowdown across 5, 10, or 15-year steps. A high-growth starting condition (exceeding a 25% initial growth rate) automatically applies a curve decay to simulate realistic, rapid market saturation.
i

Terminal growth rate

With long-term inflation between 3-5%, revenue must grow by that baseline to maintain flat real-world market share. This value sets the permanent terminal growth rate to factor into the valuation beyond the growth slowdown runway toward maturity.

3-Stage Financial Runway Horizon

🧠 Perpetuity Horizon Engine (Stage 3: Post-2035)

Terminal FCF Base$0.20B
Perpetuity TV Value$3.80B
Discounted TV (PV)$1.61B
TV Weighting %57.9%
⚠️
Financial Model Disclaimer & Risk Disclosure: This interactive scenario simulator is an educational sandbox provided strictly for informational and analytical research purposes. Core historical financial statements and consensus estimates are sourced directly via Financial Modeling Prep (FMP). All downstream outputs are entirely deterministic, hypothetical projections generated by combining automated mathematical formulas (including linear interpolation and Gaussian bell-curve decay models) with user-selected variables and third-party financial data inputs. Users assume all liability for trading decisions executed based on these sandbox calculations.

📘 Full Research Report

ℹ️

AI-Generated Research: This report is for informational purposes only.

📘 YETI HOLDINGS INC (YETI) — Investment Overview

🧩 Business Model Overview

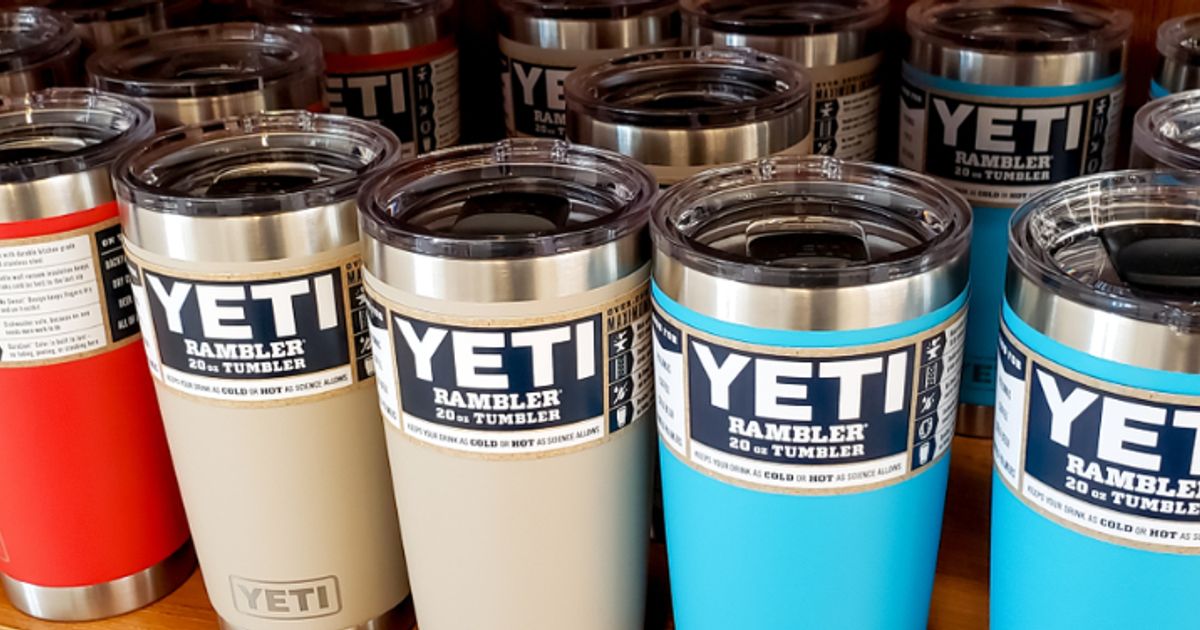
YETI designs and sells premium outdoor lifestyle products—primarily coolers, drinkware, and an expanding set of accessories (bags, mounting systems, and related items). The value chain centers on proprietary product engineering and materials selection, followed by global manufacturing and distribution through a mix of direct-to-consumer channels and wholesale/retail partners. Demand is driven by product performance attributes (temperature retention, durability, portability) and by consistent merchandising across an expanding installed base of households and outdoor users who repurchase complementary accessories.

While YETI is not a subscription or contract-based business, it supports an “ecosystem” effect: consumers often build a set (coolers + drinkware + compatible accessories), which increases the share of wallet within the outdoor premium category and creates repeat purchase pathways.

💰 Revenue Streams & Monetisation Model

Revenue is predominantly product sales, with monetisation driven by:

  • Core categories: coolers and drinkware are the primary revenue engines, with bags and accessories acting as attach drivers.
  • Channel mix: margins typically benefit from direct-to-consumer participation (pricing control, reduced retailer margin capture) versus wholesale/retail (volume and distribution breadth).
  • Product mix and durability-related positioning: higher-end models and bundle/attachment strategies generally support higher gross margins than entry-level alternatives.

The business exhibits limited recurring revenue, but it can generate repeat purchasing through accessories, replacement cycles, and product line extensions that fit the same consumer use cases.

🧠 Competitive Advantages & Market Positioning

YETI’s moat is best characterized as a combination of Intangible Assets (premium product credibility and customer preference for rugged performance) and Moderate Switching Costs driven by an installed “system” of accessories and compatible use patterns.

  • Intangible asset / premium engineering credibility: YETI’s reputation for durability and temperature performance supports sustained willingness to pay versus mass-market alternatives. Competing products may replicate individual features, but matching the perceived end-to-end performance and product consistency across a broad assortment is more difficult and requires years of design iteration, testing discipline, and consumer reinforcement.
  • Installed-base and assortment depth: Once consumers own compatible items (coolers, drinkware, and accessories), purchases shift toward maintaining compatibility and matching the established look and performance expectations—creating a practical switching barrier even without formal contracts or subscriptions.
  • Distribution execution and merchandising: YETI’s ability to secure shelf/placement and run consistent product presentation supports conversion and reduces “trial friction,” which is essential in a premium consumer durable category where brand preference is earned through perceived performance.

Competitive benchmarking:

  • RTIC and Coleman compete primarily on price and broad availability, targeting mainstream consumers seeking functional coolers and drinkware.
  • Igloo competes with established mass-market and mid-tier offerings, often emphasizing value and distribution scale.
  • Pelican competes in rugged, performance-oriented categories with different channel dynamics and use-case emphasis.

YETI’s focus vs. rivals: YETI concentrates on premium outdoor lifestyle performance and a cohesive product system across coolers, drinkware, and accessories. Price-led competitors can undercut on initial purchase, but they typically face greater difficulty sustaining premium gross margin profiles across an expanding assortment without trade-down in perception.

🚀 Multi-Year Growth Drivers

  • Premiumization in consumer durables: Ongoing migration from basic coolers and entry-level drinkware toward higher-performance, longer-life products supports category growth even when unit demand is stable.
  • Use-case expansion and household penetration: Outdoor occasions (camping, tailgating, fishing, road trips) and everyday lifestyle use increase the addressable base, particularly as YETI extends beyond coolers into drinkware and accessory-heavy solutions.
  • Accessory attach and ecosystem building: Continued expansion of compatible accessories and bundles can lift total customer value per active household by increasing attach rates.
  • International distribution scale: Growth opportunities exist through deeper penetration with existing retail partners and the expansion of direct-to-consumer infrastructure in higher-income outdoor markets.

⚠ Risk Factors to Monitor

  • Demand cyclicality and inventory risk: Consumer durables can face purchase timing shifts. Excess inventory or slower sell-through can pressure gross margins and increase promotional activity.
  • Competitive intensity and price pressure: Premium competitors and price-led brands can expand assortment and promotional reach, potentially eroding pricing power and mix.
  • Supply chain and cost inflation: Input costs (materials, logistics, energy) and contract manufacturing execution can affect margins; freight and foreign exchange movements can be a headwind.
  • Warranty and product quality: Failures, recalls, or elevated warranty costs can damage brand credibility and raise operating expenses.
  • Channel concentration: Wholesale partner performance and retail shelf space decisions can influence revenue stability, especially during demand slowdowns.

📊 Valuation & Market View

Markets often value YETI-like branded durable businesses using EV/EBITDA and P/S, with attention to gross margin durability, operating leverage, and reinvestment returns (new product development, brand merchandising, and channel expansion). The valuation framework typically prices:

  • Quality of revenue: resilience of demand and mix shift toward higher-end products and accessories
  • Margin sustainability: ability to defend premium pricing and manage input cost volatility
  • Operating leverage: scaling fixed costs through stable marketing efficiency and distribution costs

Key valuation “drivers” are therefore operational: sustained gross margin discipline, inventory management, and continued conversion of customers from core categories into higher-value accessory ecosystems.

🔍 Investment Takeaway

YETI’s long-term case rests on a premium performance position that functions as an intangible-asset moat, reinforced by an installed-base ecosystem that supports accessory attach and repeat purchasing. The investment merits a focus on whether YETI can defend premium mix and margin discipline while managing inventory and competitive pricing pressure in a category that remains attractive but competitive.


⚠ AI-generated — informational only. Validate using filings before investing.

📰 Market News & Coverage

15 Stories Available

Real-time institutional reporting and market updates for YETI.

seekingalpha.com2026-06-04

YETI Holdings, Inc. (YETI) Presents at 2026 Baird Global Consumer, Technology & Services Conference Transcript

YETI Holdings, Inc. (YETI) Presents at 2026 Baird Global Consumer, Technology & Services Conference Transcript

globenewswire.com2026-05-28

YETI Holdings, Inc. Announces Participation in Upcoming Investor Conferences

AUSTIN, Texas, May 28, 2026 (GLOBE NEWSWIRE) -- YETI Holdings, Inc. (“YETI”) (NYSE: YETI) today announced that management will be attending the following investor conferences:

seekingalpha.com2026-05-20

YETI: Strong Brand In Consumer Discretionary Drives Value

YETI Holdings, Inc. has outperformed the market, delivering 19% alpha since prior coverage and continues to present a strong fundamental case. YETI beat Q1 2026 earnings expectations, raised sales guidance to 7-8% growth, and maintains robust free cash flow and aggressive share repurchases. Despite macroeconomic headwinds and tariff impacts, YETI trades near fair value ($40.57–$47.87/share) with double-digit returns on capital and strong margins.

proactiveinvestors.com2026-05-18

YETI sees stronger year ahead after blowout quarter defies cautious sentiment

YETI (NYSE:YETI) lifted its full-year guidance and topped first-quarter expectations, offering investors a more confident growth trajectory just as concerns over consumer spending and tariff headwinds had weighed on the stock. The outdoor lifestyle brand now expects fiscal 2026 net sales growth of 7% to 8%, tightened from a prior range of 6% to 8%, and raised its adjusted EPS outlook to $2.83-$2.89 from $2.77-$2.83.

proactiveinvestors.com2026-05-18

YETI sees stronger year ahead after blowout quarter defies cautious sentiment

YETI (NYSE:YETI) lifted its full-year guidance and topped first-quarter expectations, offering investors a more confident growth trajectory just as concerns...

proactiveinvestors.com2026-05-18

Hive Digital subsidiary plans 320 megawatt AI data centre near Toronto in $3.5 billion investment

HIVE Digital Technologies Ltd (TSX:HIVE, NASDAQ:HIVE, FRA:YO0, BVC:HIVECO), the Canadian digital infrastructure group listed in Toronto and New York, has...

marketbeat.com2026-05-15

YETI Q1 Earnings Call Highlights

YETI NYSE: YETI reported first-quarter fiscal 2026 sales growth of 8.3% and raised parts of its full-year outlook, as management pointed to stronger wholesale demand, improving Drinkware trends and continued momentum in Coolers & Equipment.

barrons.com2026-05-14

YETI Shares Are Up 8%. It's About More Than Pricey Mugs.

Yeti Holdings stock surged after the outdoor gear maker topped earnings estimates and raised its 2026 profit outlook as tariff pressures begin to ease.

seekingalpha.com2026-05-14

YETI: Strong Sales Defy A Weak Macro, But Watch Out For Channel Shift (Upgrade)

YETI Holdings, Inc. is upgraded to a Buy after strong Q1 sales and a resilient U.S. recovery, despite the stock being down ~10% YTD. YETI's mid-50s gross margins and growing direct-to-consumer mix support profitability and scale, distinguishing it from many retail peers. International sales are accelerating, outpacing U.S. growth but still offering significant runway, currently comprising a low-20s percentage of total sales.

marketbeat.com2026-05-14

YETI Rallies After Earnings Beat and Raised Outlook

Shares of YETI Holdings Inc. NYSE: YETI jumped Thursday after the company delivered a first-quarter earnings beat and raised its full-year outlook, giving investors renewed confidence after a rocky few months for the stock.

seekingalpha.com2026-05-14

YETI Holdings, Inc. (YETI) Q1 2026 Earnings Call Transcript

YETI Holdings, Inc. (YETI) Q1 2026 Earnings Call Transcript

zacks.com2026-05-14

Yeti (YETI) Q1 Earnings: Taking a Look at Key Metrics Versus Estimates

The headline numbers for Yeti (YETI) give insight into how the company performed in the quarter ended March 2026, but it may be worthwhile to compare some of its key metrics to Wall Street estimates and the year-ago actuals.

zacks.com2026-05-14

Yeti (YETI) Tops Q1 Earnings and Revenue Estimates

Yeti (YETI) came out with quarterly earnings of $0.26 per share, beating the Zacks Consensus Estimate of $0.17 per share. This compares to earnings of $0.31 per share a year ago.

businesswire.com2026-05-14

YETI Reports First Quarter 2026 Results

AUSTIN, Texas--(BUSINESS WIRE)--YETI Holdings, Inc. (“YETI”) (NYSE: YETI) today announced its financial results for the first quarter ended April 4, 2026. First Quarter 2026 Highlights Sales increased 8%, driven by strong consumer demand across categories and channels Wholesale sales grew 19%, delivering our best quarterly performance in over three years US sales grew 8%; International sales grew 9% Coolers & Equipment sales grew 11%; Drinkware sales grew 5% EPS decreased 35% to $0.13; Adju.

zacks.com2026-05-11

Ahead of Yeti (YETI) Q1 Earnings: Get Ready With Wall Street Estimates for Key Metrics

Evaluate the expected performance of Yeti (YETI) for the quarter ended March 2026, looking beyond the conventional Wall Street top-and-bottom-line estimates and examining some of its key metrics for better insight.

📊 AI Financial Analysis

Powered by StockMarketInfo
Earnings Data: Q Ending 2026-04-04

"YETI reported Q1 2026 revenue of $380.4M and net income of $9.9M (EPS $0.13). Revenue was up +8.2% YoY versus $351.1M in Q1 2025, and down -34.8% QoQ versus $583.7M in Q4 2025. Net income increased +491.4% YoY (from $16.6M), but declined -83.1% QoQ (from $58.2M), reflecting strong seasonality. Profitability weakened sequentially: gross margin fell to 55.3% from 58.4% in Q4, and net margin contracted to 2.6% from 10.0%. Operating margin also compressed to 3.3% (vs. 12.9% in Q4). Despite this, gross margin remains roughly stable versus Q1 2025 (57.4% in Q1 2025 vs. 55.3% now), suggesting cost pressure or product mix impact concentrated in the quarter. Cash flow quality is mixed: operating cash flow was -$32.6M and free cash flow was -$43.8M in Q1, versus strongly positive FCF in Q4 ($162.0M). Balance sheet resilience is solid with $1.22B total assets and $660M equity; net debt was roughly $29M (slightly levered). Shareholder returns appear positive given the strong +52.8% 1-year price change and 22.9% 6-month gain; no dividend is shown and buybacks occurred historically, but Q1 repurchases were relatively small ($10.0M)."

Revenue Growth

Neutral

Q1 revenue $380.4M was +8.2% YoY but -34.8% QoQ, consistent with seasonality (Q4 spike).

Profitability

Fair

Net margin fell to 2.6% from 10.0% QoQ, and operating margin dropped to 3.3% (from 12.9%). Gross margin declined to 55.3% (from 58.4%).

Cash Flow Quality

Caution

Operating cash flow and free cash flow were negative in Q1 (-$32.6M OCF; -$43.8M FCF) versus strong Q4 positives, indicating weaker quarterly working-capital dynamics.

Leverage & Balance Sheet

Good

Equity is stable (~$660M) and net debt is low (~$29M). Total assets are $1.22B with manageable debt (~$157M total debt).

Shareholder Returns

Positive

Strong momentum with price up +52.8% over 1 year (>20%). Dividend yield is 0; buybacks were modest in Q1 (-$10.0M), with stronger repurchases in prior quarters.

Analyst Sentiment & Valuation

Positive

Street target consensus is ~$50.71 vs. current price ~$41.17 (implies ~23% upside). Valuation metrics are elevated (e.g., P/E ~69.5) given low current-quarter earnings.

Disclaimer:This analysis is AI-generated for informational purposes only. Accuracy is not guaranteed and this does not constitute financial advice.

Fundamentals Overview

Loading fundamentals overview...

YETI delivered a strong Q1 operating start with sales of $380.4M (+8.3% YoY) and particularly strong wholesale (+19% YoY) supported by double-digit US sell-through and healthy inventories. However, profitability deteriorated: adjusted gross margin fell 200 bps to 55.3% due to a 280 bps tariff cost headwind and D2C mix pressure, driving adjusted EPS down to $0.26 from $0.31. Management raised FY sales growth to 7%–8% and lifted the lower end of gross margin expectations to 56.5%–57%, emphasizing tariff headwinds as largely time-bound (about a 200 bps 1H decline, then ~50 bps expansion in 2H as 2H 2025 tariffs lap). The operational narrative centers on demand diversification (bags/soft coolers, drinkware), plus supply constraints easing in the back half. Risks remain around corporate sales episodicity, tariff/inbound cost volatility, and regional macro softness. Net: confidence on growth is improving; margin execution is the key watch item.

AI IconGrowth Catalysts

  • Drinkware: global drinkware up 5% YoY; growth broadening beyond single hero SKU; new refresh/extension items including stackable cups, chug bottles, ceramic mugs, and Yonder Shaker bottle
  • Coolers & Equipment: sales up 11% YoY led by soft coolers and bags; Daytrip and Camino outperforming with demand outpacing supply and improving inventory position into later quarters
  • Everyday-use expansion via ecosystem: strong pull in bags/soft coolers/carry solutions; GoBox 1 protective case (“Cargo” strength) establishing foundation for 2026 expansion
  • Wholesale channel momentum: global wholesale grew 19% YoY, strongest quarter in 3+ years, with double-digit US sell-through growth and balanced inventory positions

Business Development

  • Japan: expanded wholesale partnerships; recent launch of e-commerce platform; “good momentum” building (no partner names provided)
  • Corporate sales: described as episodic and supported by “big partnerships,” larger corporate orders, and an “underlying hum” (no specific partners/customers named in provided transcript)

AI IconFinancial Highlights

  • Q1 sales: $380.4M, +8.3% YoY; at top end of initial FY outlook range (6%–8%)
  • Category performance: Drinkware $217M (+5%); Coolers & Equipment $156M (+11%)
  • Channel performance: Wholesale $184M (+19%); DTC $197M flat; corporate sales declined YoY (timing + cautious corporate buyers)
  • Adjusted gross profit: $210M, 55.3% of sales, down 200 bps YoY
  • Gross margin headwinds: 280 bps headwind from higher tariff costs; unfavorable D2C mix
  • Gross margin partial offsets: lower product costs and favorable FX
  • Adjusted operating income: $26.6M, down 24% YoY; 7% of sales
  • Adjusted net income: $19.8M (-23% YoY), 5.2% of sales; adjusted EPS $0.26 vs $0.31 prior year
  • Net tariff impact: incremental unfavorable net tariff impact of ~$0.09 in Q1
  • International: +9% YoY to $87M including ~800 bps of FX favorability; corporate sales decline impacted international growth quarter-to-quarter
  • Guidance raise: FY sales growth raised to 7%–8% from 6%–8%; gross margin lower end raised to 56.5%–57% from 56%–57%
  • FY gross margin YoY: midpoint implies 60 bps decline vs prior-year guidance midpoint implying 90 bps decline (tariff rate benefit offset by higher commodities/inbound transportation)
  • Gross margin phasing: ~200 bps YoY decline in 1H, then ~50 bps YoY expansion in 2H (lapping 2H 2025 tariff impacts)
  • No guidance assumption: does not include recovery of potential IEEPA refunds due to uncertainty on amount/timing
  • OpEx and operating margin: adjusted operating income margin expected ~14.6%, up 20 bps vs 2025; FY adjusted operating income growth 8%–10% (raised from 6%–8%)
  • Op margin phasing: ~450 bps operating margin decline in 1H, partially offset by ~350 bps improvement in 2H
  • Tax and share count: effective tax rate ~24%; diluted shares ~76.6M vs 81.6M in 2025 (reflects ~300M buybacks in 2025 plus additional ~$100M planned in 2026)
  • EPS guidance: adjusted EPS $2.83–$2.89 (+14% to +17% vs prior year guidance $2.77–$2.83, +12% to +14%)
  • Cash flow: FY free cash flow expected $200M–$225M

AI IconCapital Funding

  • Cash balance: $127.8M at end of Q1 2026 vs $259.0M prior-year quarter (YoY decline tied to elevated share repurchases through 2025)
  • Total debt (excl. finance leases/unamortized fees): ~$73M vs ~$77M end of prior-year Q1
  • Share repurchases: Board increased authorization by ~$350M to a total remaining outstanding authorization of $500M
  • FCF conversion focus: FY free cash flow guidance $200M–$225M supports buybacks and reinvestment

AI IconStrategy & Ops

  • Inventory/supply: fill rates in certain soft cooler and bag programs ran short through 2025 into Q1 2026; additional capacity expected in back half of year to capture demand
  • Omnichannel/digital: AI-driven shopping assistant “Ranger” to improve conversion and scale efficiently as assortment grows
  • Social commerce: recently launched TikTok shop; scaling approach tied to performance, repeat behavior, and brand standards (no quantitative targets given)
  • Website/product conversion improvements: “meaningful enhancements” to US and Canadian websites improving conversion, add-to-cart, and AOV
  • Store investment: SG&A growth driven by facilities including 2 new stores plus sales/product development headcount and technology for digital businesses

AI IconMarket Outlook

  • FY 2026 sales growth: 7%–8% (raised from 6%–8%); expects total sales growth rate relatively consistent throughout the rest of the year
  • FY channel growth: wholesale expected to grow slightly faster than DTC this year (driven by wholesale partner customer traffic and merchandising innovations)
  • FY by geography: international expected high teens to 20% full-year growth; US expected low to mid-single-digit growth
  • FY gross margin: 56.5%–57% (raised lower end); phasing ~200 bps decline in 1H then ~50 bps expansion in 2H
  • FY adjusted operating margin: ~14.6% (up 20 bps YoY)
  • FY adjusted operating income growth: 8%–10%
  • FY EPS: $2.83–$2.89
  • Capex: unchanged at $60M–$70M
  • FCF: $200M–$225M
  • Planned capital return: additional ~$100M share repurchases planned for 2026 (per diluted share count bridge)

AI IconRisks & Headwinds

  • Tariffs: peak tariff impact in 1H; gross margin expected to decline ~200 bps YoY in first half; no assumed benefit from uncertain IEEPA refunds
  • Input cost pressures: gross margin impacted by higher commodity and inbound transportation costs (partially offset by lower realized tariff rates)
  • D2C mix: unfavorable impact from lower mix of D2C contributed to Q1 gross margin down 200 bps YoY
  • Corporate sales volatility: corporate sales described as episodic; Q1 corporate softness due to order timing and cautious corporate buyers; described as improving in Q2
  • Supply constraints: soft cooler and bag programs experienced fill-rate shortages through 2025 into Q1 2026; risk of delayed capture until capacity ramps in back half
  • Macro: international and specific regions (e.g., Australia discretionary spending) face macro pressures; international quarterly variability expected

Q&A: Analyst Interest

  • Revenue guide confidence and linkage to medium/long-term algorithm: Management cited Q1 strength and Q2 momentum, attributing durability to diversified channels, portfolio breadth (coolers/equipment + drinkware), and strengthening corporate trend. Corporate orders can be episodic but roll over; international door openings and feedback support confidence in the raised guide and long-term growth algorithm.
  • Corporate sales action plans and sizing (visibility into episodic softness): Management confirmed continued belief in untapped corporate potential globally and described corporate as comprising big partnerships plus larger orders and an underlying baseline. They noted an active sales team targeting third-bucket opportunities; Scott was to add specifics (response truncated in provided transcript).
  • Margin resilience mechanics: Management emphasized channel diversification, global replication, and supply chain flexibility developed over multiple tariff cycles. They linked continued free cash flow to resilient gross margin despite transient shocks, and highlighted leverageability enabling EPS compounding and shareholder buybacks; no new numeric bps targets were added in the provided response.

Sentiment: MIXED

Note: This summary was synthesized by AI from the YETI Q1 2026 earnings transcript. Financial data is complex; please verify all metrics against official SEC filings before making investment decisions.

📋 Official Regulatory 10-K / 10-Q SEC Filings

Direct authenticated documentation links to audited SEC database reports for YETI.

SEC EDGAR Live Feed
Loading financial data and tables...
📁

SEC Filings (YETI)

© 2026 Stock Market Info — YETI Holdings, Inc. (YETI) Financial Profile