Reliance Steel & Aluminum Co.

Reliance Steel & Aluminum Co. (RS) Market Cap

Reliance Steel & Aluminum Co. has a market capitalization of $20.73B.

Price: $406.10

5.08 (1.27%)

Market Cap: 20.73B

NYSE · time unavailable

CEO: Karla R. Lewis

Sector: Basic Materials

Industry: Steel

IPO Date: 1994-09-16

Website: http://reliance.com

Reliance Steel & Aluminum Co. (RS) - Company Information

Market Cap: 20.73B|Sector: Basic Materials

Company Profile

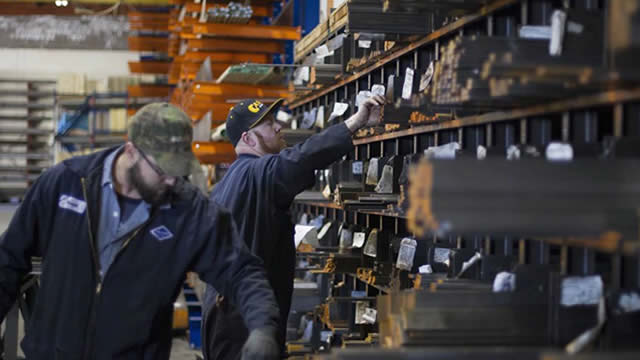
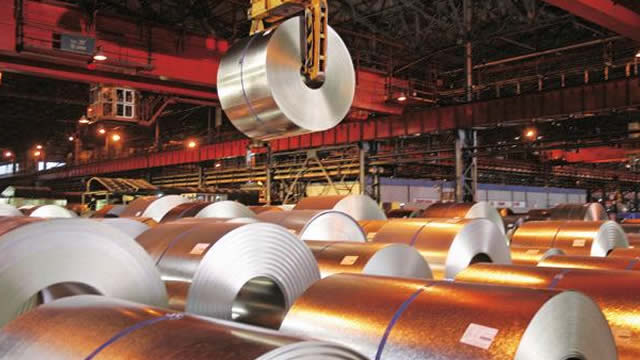
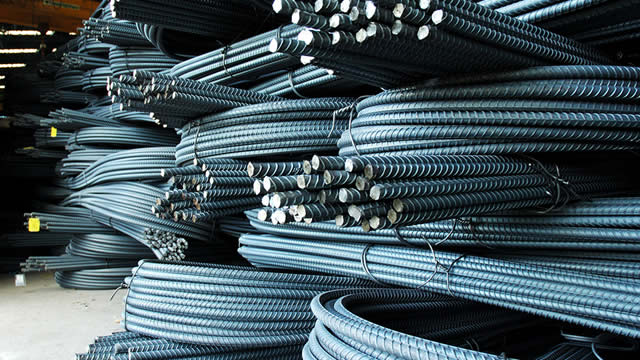
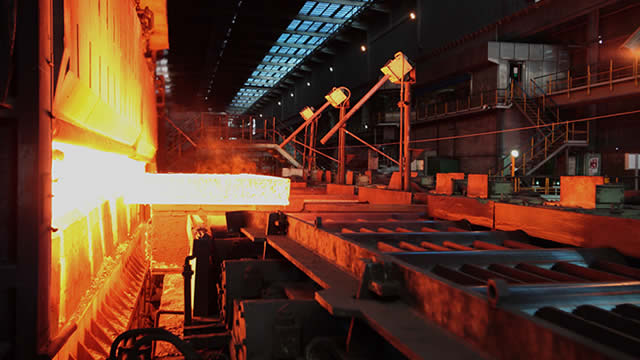
Reliance Steel & Aluminum Co. (RS) operates as a premier diversified metal solutions provider and a leading metal service center, serving clients across the United States, Canada, and globally. The company provides an extensive inventory of approximately 100,000 metal products, including alloys, aluminum, brass, copper, carbon steel, stainless steel, titanium, and various specialty steels. Beyond distribution, it offers comprehensive metal processing services to diverse sectors such as general manufacturing, non-residential construction, transportation, aerospace, energy, electronics and semiconductor fabrication, and heavy industries. Additionally, RS supplies non-ferrous metals and tubular building products, while also manufacturing bespoke extruded metals, fabricated components, and welded parts. As of December 31, 2021, its network comprised about 315 facilities spread across 40 U.S. states and 13 other countries. The company directly sells its offerings to original equipment manufacturers, largely catering to small machine shops and fabricators. Founded in 1939, Reliance Steel & Aluminum Co. is headquartered in Los Angeles, California.

Analyst Sentiment

37%
Underperform

From 8 Active Polls

1Y Forecast: $382.50

▼ -5.8% Potential Upside

Consensus Target Metrics

Low Bound

$350

Median

$381

High Bound

$418

Average

$383

Price & Moving Averages

Loading chart...

🎯 Wall Street Analyst Intelligence Report

1-Year structural target targets, chart projections, and sentiment maps.

Average 1Y Target
$382.50
▼ -5.81% Upside
Low Target
$350.00
-14% Risk
Median Target
$381.00
-6% Mid
High Target
$418.00
3% Max
Consensus
Hold
9 / 27 Buys

Consensus Trend Projection

Trailing closures vs. 12-month metrics map.

Analyst Vote Distribution

Aggregate institutional coverage sentiment weights.

📊 Historical Valuation Multiples

Real-time Trailing Twelve Month (TTM) momentum side-by-side with discrete quarterly metrics.

Fiscal QuarterTTMQ2 2026Q1 2026Q4 2025Q3 2025Q2 2025Q1 2025Q4 2024Q3 2024
Period EndingTrailing 12MJun 30, 2026Mar 31, 2026Dec 31, 2025Sep 30, 2025Jun 30, 2025Mar 31, 2025Dec 31, 2024Sep 30, 2024
Market Cap ($M)20,73319,18115,69215,04014,73916,58715,32514,56815,817
Enterprise Value ($M)22,49320,94017,47216,81416,16618,08016,80815,66817,041
Price to Earnings Ratio (P/E)23.4714.7814.8132.2419.4517.6719.2034.5219.86
Price/Earnings-to-Growth Ratio (PEG)0.990.983.521.68
Price to Sales Ratio (P/S)1.314.143.904.304.044.534.404.664.62
Price to Book Ratio (P/B)2.822.592.202.102.022.292.162.022.15
Price to Free Cash Flow Ratio (P/FCF)38.43278.79179.9674.1381.61117.30-684.1740.2045.05
Enterprise Value to Sales (EV/Sales)4.524.344.814.434.944.825.014.98
Enterprise Value to EBITDA (EV/EBITDA)14.7940.7340.2570.1848.6046.5649.0673.1850.22
Debt to Equity Ratio1.160.270.280.280.230.240.250.200.21

📘 Full Research Report

ℹ️

AI-Generated Research: This report is for informational purposes only.

```html

📘 RELIANCE STEEL & ALUMINUM (RS) — Investment Overview

🧩 Business Model Overview

RELIANCE STEEL & ALUMINUM operates as a metals service center and distributor, bridging upstream metal producers and downstream manufacturers. The business receives steel and aluminum products from mills and other suppliers, maintains an inventory buffer, and delivers value through processing and fulfillment services such as cutting-to-length, slitting, blanking, and light fabrication/processing (where applicable). This model reduces procurement friction for customers that need reliable material availability, consistent specifications, and faster turnaround than direct-from-mill sourcing.

Customer stickiness is supported by a practical “procure-to-deliver” workflow: RS manages product breadth, quality/grade requirements, and logistics so customers can run manufacturing with fewer sourcing disruptions. The service center format converts commodity supply into dependable production input timing.

💰 Revenue Streams & Monetisation Model

Revenue is primarily driven by transactional sales of steel and aluminum products, with monetisation coming from (i) product spread versus supplier cost, and (ii) incremental margins from processing/handling and value-added services. The margin profile is typically influenced by the discipline of inventory management and pass-through dynamics for commodity-linked input costs.

A key driver is working-capital efficiency: as RS buys, processes, and ships inventory, earnings reflect not only demand and pricing, but also inventory turns, shrink/damage management, and the ability to match procurement timing to customer consumption patterns. Where processing is offered, RS benefits from higher gross margin on conversion/handling activity and from recurring operational relevance to customers.

🧠 Competitive Advantages & Market Positioning

RS competes in a fragmented metals distribution landscape where scale, logistics, and operational execution matter. The principal moats are:

  • Switching costs (operational dependency): Customers often rely on RS for consistent grades, spec compliance, processing lead times, and delivery reliability. Changing suppliers can require requalification, new logistics arrangements, and loss of responsiveness.
  • Cost and procurement advantages (scale purchasing + sourcing flexibility): Scale improves bargaining power, access to supply, and the ability to manage inventory across grades and regions—reducing total delivered cost variability for customers.
  • Geographic/logistical infrastructure (reach + service levels): A distributed footprint supports faster delivery windows and lower effective freight costs, which becomes materially important for manufacturing schedules and jobsite timelines.

COMPETITIVE BENCHMARKING: Primary peers include Ryerson (metals service center and processing), Metals USA (service center distribution), and Commercial Metals (mini-mill producer with direct product supply to some end markets).

  • RS vs. Ryerson/Metals USA: RS emphasizes broad end-market coverage and diversified metals with an execution model oriented around supply reliability and processing capabilities, which supports higher customer operational stickiness.
  • RS vs. Commercial Metals: Mini-mills supply metal directly and can pressure service center spreads when end customers shift to direct purchasing. RS’s positioning relies on the service center layer—processing, inventory availability, and delivery responsiveness—rather than pure production cost leadership.

🚀 Multi-Year Growth Drivers

  • Industrial and infrastructure demand durability: Construction, transportation, industrial equipment, and energy infrastructure require ongoing steel and aluminum intake. Metals demand correlates with real asset build cycles and maintenance/replacement demand.
  • Supply-chain reshoring and localization: Manufacturing localization increases the need for dependable, specification-driven material logistics—benefiting service centers that can supply multiple regions with consistent service levels.
  • Value-added processing and service-led differentiation: Customers increasingly prioritize shorter lead times and less operational complexity. RS can expand contribution by converting commodity transactions into processing-heavy, spec-driven fulfillment.
  • Market share capture through execution and density: Over a cycle, scale operators often win share through better inventory availability, procurement discipline, and logistics performance, particularly in fragmented local markets.

⚠ Risk Factors to Monitor

  • Commodity price and spread compression risk: Earnings can be pressured when spreads narrow or when customers renegotiate terms in periods of volatility.
  • Working-capital/inventory risk: Metals businesses are sensitive to inventory valuation, turn rates, and the timing of purchases versus sales. Weak demand can elevate carrying costs and impair conversion to cash.
  • Customer and end-market cyclicality: Construction and industrial demand swings can reduce volumes and utilization, impacting margins.
  • Trade policy and tariff/geopolitical effects: Tariffs, import restrictions, and cross-border supply disruptions can alter sourcing economics and require rapid re-optimization of supply and inventory.
  • Operational and regulatory pressures: Environmental compliance, safety, transportation constraints, and labor availability can raise costs or reduce throughput.

📊 Valuation & Market View

The market typically values metals service/distribution businesses on cash earnings power and operating efficiency rather than long-duration growth narratives. Common frameworks include EV/EBITDA and earnings yield, with performance frequently tied to (i) volume trends, (ii) service center spreads, and (iii) working-capital discipline. Valuation sensitivity often increases when uncertainty around spreads and inventory turns rises.

Key valuation “moving parts” include sustainable gross margin/spread, normalized utilization, and the quality of operating cash flow. Because the business transforms commodity inputs into delivered availability and processing, investors tend to assess whether margins are supported by service value (execution and infrastructure) versus short-term pricing conditions.

🔍 Investment Takeaway

RELIANCE STEEL & ALUMINUM offers a defensible service-center model with structural advantages: dependable supply chain infrastructure, processing and specification capabilities that raise customer switching costs, and scale-driven procurement and logistics benefits. The long-term investment case rests on maintaining operating discipline through commodity cycles while capturing share via service reliability and value-added fulfillment across industrial and infrastructure end markets.


⚠ AI-generated — informational only. Validate using filings before investing.

```

📰 Market News & Coverage

15 Stories Available

Real-time institutional reporting and market updates for RS.

defenseworld.net2026-07-29

First Trust Advisors LP Has $31.38 Million Holdings in Reliance, Inc. $RS

First Trust Advisors LP raised its position in shares of Reliance, Inc. (NYSE: RS) by 20.2% in the first quarter, according to its most recent disclosure with the Securities and Exchange Commission. The institutional investor owned 103,249 shares of the industrial products company's stock after buying an additional 17,371 shares during the quarter.

defenseworld.net2026-07-28

Caxton Associates LLP Has $689,000 Stock Position in Reliance, Inc. $RS

Caxton Associates LLP reduced its position in shares of Reliance, Inc. (NYSE: RS) by 39.5% during the undefined quarter, according to the company in its most recent Form 13F filing with the Securities and Exchange Commission. The fund owned 2,266 shares of the industrial products company's stock after selling 1,477 shares during the

marketbeat.com2026-07-23

Reliance Q2 Earnings Call Highlights

Reliance NYSE: RS reported what executives described as another strong quarter, with record tons sold, sharply higher year-over-year sales and stronger profitability supported by favorable pricing, improving demand across several end markets and initial contributions from a U.S. Department of Homeland Security border wall contract.

seekingalpha.com2026-07-23

Reliance, Inc. (RS) Q2 2026 Earnings Call Transcript

Reliance, Inc. (RS) Q2 2026 Earnings Call Transcript

zacks.com2026-07-23

RS Q2 Earnings Beat Estimates on Record Shipments and Pricing

Reliance beat Q2 earnings estimates as record shipments, stronger pricing and border wall contributions lifted earnings 41.5% and sales 26.5%.

zacks.com2026-07-22

Reliance (RS) Reports Q2 Earnings: What Key Metrics Have to Say

The headline numbers for Reliance (RS) give insight into how the company performed in the quarter ended June 2026, but it may be worthwhile to compare some of its key metrics to Wall Street estimates and the year-ago actuals.

zacks.com2026-07-22

Reliance (RS) Surpasses Q2 Earnings and Revenue Estimates

Reliance (RS) came out with quarterly earnings of $6.27 per share, beating the Zacks Consensus Estimate of $5.38 per share. This compares to earnings of $4.43 per share a year ago.

globenewswire.com2026-07-22

Reliance, Inc. Reports Second Quarter 2026 Financial Results

- Net sales of $4.63 billion, up 15% sequentially with record tons sold up 7.0%  - EPS of $6.29; non-GAAP EPS of $6.27, up 42% year-over-year, exceeding expectations - Pretax income of $429.8 million, up 41% year-over-year PHOENIX, July 22, 2026 (GLOBE NEWSWIRE) -- Reliance, Inc. (NYSE: RS) (‘Reliance,' the ‘Company,' ‘we,' ‘our,' or ‘us') today reported its financial results for the second quarter ended June 30, 2026. (in millions, except tons sold in thousands, per ton and per share amounts)                                                         Seq.

zacks.com2026-07-20

Unlocking Q2 Potential of Reliance (RS): Exploring Wall Street Estimates for Key Metrics

Evaluate the expected performance of Reliance (RS) for the quarter ended June 2026, looking beyond the conventional Wall Street top-and-bottom-line estimates and examining some of its key metrics for better insight.

zacks.com2026-07-15

Reliance (RS) Earnings Expected to Grow: Should You Buy?

Reliance (RS) possesses the right combination of the two key ingredients for a likely earnings beat in its upcoming report. Get prepared with the key expectations.

zacks.com2026-07-14

Here's Why You Should Retain Reliance Stock in Your Portfolio

RS is riding strong end-market demand and acquisitions to fuel growth, even as weak chip and aerospace markets and aluminum costs pressure margins.

zacks.com2026-07-09

RS Shares Rise 23% in 6 Months: Here's What's Driving the Upside

Reliance shares surged 23% in six months as record tons sold, strong demand and acquisitions that expanded growth markets helped it outperform industry trends.

globenewswire.com2026-07-08

Reliance, Inc. to Announce Second Quarter 2026 Results on Wednesday, July 22nd

PHOENIX, July 08, 2026 (GLOBE NEWSWIRE) -- Reliance, Inc. (NYSE:RS) announced today that it will report second quarter 2026 financial results for the period ended June 30, 2026, on Wednesday, July 22, 2026, after the market closes. Reliance management will host a conference call on Thursday, July 23, 2026, at 11:00 a.m. Eastern Time. The call will be broadcast live over the Internet hosted on the Investors section of the Company's website at reliance.com.

zacks.com2026-06-29

Reliance Stock Rises 34% YTD: Will the Momentum Continue?

RS shares are up 33.5% year to date on record Q1 shipment volumes, extending its streak of industry outperformance as infrastructure demand and acquisitions support growth.

gurufocus.com2026-06-26

Reliance Inc (RS) Shares Fall 4.9% -- GF Value Says Still Overvalued

On June 26, 2026, Reliance Inc (RS) shares fell 4.9% to a current price of $385.78. This decline comes amid a 52-week trading range of $260.31 to $419.83, refle

📊 AI Financial Analysis

Powered by StockMarketInfo
Earnings Data: Q Ending 2026-06-30

"Revenue in Q2’26 was $4.63B, up 15.3% YoY (vs. Q2’25 $3.66B) and up 15.1% QoQ (vs. Q1’26 $4.03B). Net income was $322.9M, up 38.1% YoY (vs. $233.7M) and up 21.3% QoQ (vs. $266.3M). EPS rose to $6.32 (from $4.44 in Q2’25 and $5.13 in Q1’26). Profitability improved across the quarter: gross margin edged up from 27.39% (Q1’26) to 26.59% (Q2’26) but remained well above Q4’25 (25.31%) and Q3’25 (28.25%) with a clear rebound in operating margin from 5.04% in Q4’25 to 9.54% in Q2’26. Net margin expanded over the 4-quarter span, reaching 6.97% in Q2’26 (vs. 6.39% in Q2’25 and 3.33% in Q4’25). Cash flow quality was solid: operating cash flow was $162.2M and free cash flow $68.8M, with continued shareholder payouts (dividends paid of $63.8M) and no buybacks in the quarter (Q1 included a $234.2M repurchase). Balance sheet remains resilient with total assets rising to $11.17B from $10.81B in Q1’26, and total equity increasing to about $7.41B. Shareholder returns are supported by strong momentum (1Y change +18.29%—below the 20% threshold) and a low but steady dividend yield (~0.33%)."

Revenue Growth

Good

Q2’26 revenue +15.3% YoY and +15.1% QoQ, with a strong acceleration from Q1’26.

Profitability

Good

Net margin improved to 6.97% in Q2’26 from 6.61% (Q2’25) and 6.61% (Q1’26); operating margin jumped to 9.54% from 5.04% in Q4’25.

Cash Flow Quality

Positive

Operating cash flow was $162.2M and free cash flow $68.8M in Q2’26. Dividends paid ($63.8M) were manageable; buybacks absent in the quarter.

Leverage & Balance Sheet

Positive

Total assets increased to $11.17B QoQ; equity remains robust (~$7.41B). Leverage is moderate with net debt around $1.76B.

Shareholder Returns

Positive

Market momentum is positive (1Y +18.29%) but not >20%. Dividend yield is low (~0.33%). Buyback activity appears intermittent (repurchase in Q1, none in Q2).

Analyst Sentiment & Valuation

Good

Street consensus target $382.5 vs. current ~$325.5 suggests upside. Valuation multiples remain elevated, but fundamentals improved notably in Q2’26.

Disclaimer:This analysis is AI-generated for informational purposes only. Accuracy is not guaranteed and this does not constitute financial advice.

Fundamentals Overview

Loading fundamentals overview...

Reliance’s Q2 2026 results show strong outperformance across volumes, pricing, and profitability, anchored by the DHS border wall contract ramp (shipping started in April) and broad demand strength. Tons sold rose 7% QoQ (+10.8% YoY) and average selling price increased 7.8% QoQ, supporting significant margin and earnings gains despite a noted ~40 bps gross margin headwind from the contract. Management emphasized pretax margin accretion at the consolidated level (~30 bps to pretax income margin) due to below-company-average operating cost per ton from leveraged infrastructure and lower per-ton variable costs. The primary financial swing factor was LIFO: full-year outlook doubled to $300M with Q2 LIFO expense $112.5M (well above the $37.5M estimate) and Q3 expected at $75M (~$1.10/share). Guidance calls for Q3 non-GAAP EPS of $6.40–$6.60, with border wall shipments expected to hold near full run-rate into mid-next year, subject to metal supply.

AI IconGrowth Catalysts

  • U.S. Department of Homeland Security border wall contract ramp: second-quarter contribution ~5.1 percentage points to sequential tons sold
  • Record tons sold: +10.8% YoY and +7% QoQ (second-quarter sequential growth exceeded expectations)
  • Strengthening demand and pricing across carbon steel and aluminum amid constrained supply/extended mill lead times
  • Improving general manufacturing momentum and early aerospace commercial recovery supported by improving backlogs and OEM-build rates
  • Semiconductor demand showing clear improvement, supported by accelerating data center activity
  • Higher per-ton profitability from carbon steel and aluminum pricing strength

Business Development

  • U.S. Department of Homeland Security border wall contract awarded earlier in 2026 (shipping began in April; contract phase 1 with ~$1.4B sales through mid-2027 and potential phase 2 ~$0.8B–$0.9B opt-in)

AI IconFinancial Highlights

  • Revenue: +27% YoY (driven by stronger-than-anticipated shipment volumes and pricing)
  • Gross profit: $1.3B, +11% vs Q1 2026 and +20% vs Q2 2025
  • Non-GAAP FIFO gross margin: 30.5% vs 30.1% in Q1 2026 and 30.6% in Q2 2025; included ~40 bps headwind from border wall project (offset by below-company operating cost per ton adding ~30 bps to pretax income margin)
  • Non-GAAP pretax income: +40% YoY to $429M
  • Non-GAAP diluted EPS: $6.27 (+42% YoY); border wall contributed $0.41 per share; exceeded guidance: Q2 EPS >$0.54 estimate by 54 cents and >$0.35 prior year quarter estimate
  • LIFO: full-year LIFO expense outlook increased to $300M from $150M; Q2 LIFO expense $112.5M (vs $37.5M estimate); expected Q3 LIFO expense $75M (~$1.10/share)
  • Tax/tariff sensitivity: aluminum LIFO/tariff-related distortion cited, including Section 32 tariffs and higher aluminum pricing without corresponding demand
  • SG&A: non-GAAP SG&A up 11% YoY dollars; per-ton SG&A flat; SG&A as a percent of sales decreased in part due to higher average selling prices and lower variable cost per ton on border wall volumes
  • Cash flow: operating cash flow ~$162M in Q2 despite working-capital build from higher shipments and metal pricing
  • Inventory: inventory-turn rate ~5.2x (vs 4.8x in 2025); DSO ~42 days

AI IconCapital Funding

  • Capital expenditures funded in Q2: $93M
  • Dividends paid in Q2: $64M
  • No share repurchases in Q2; remaining authorization under current buyback program: ~$529M
  • Total debt: $1.7B at quarter-end
  • Leverage: net debt/EBITDA ~0.9

AI IconStrategy & Ops

  • Leverage existing infrastructure to process border wall volumes at below-company-average operating cost per ton; supports pretax margin accretion despite ~40 bps gross margin headwind
  • Maintain domestic mill partnership strategy to secure reliable material availability despite extended lead times and trade-driven import limitations
  • Border wall storage/handling and value-add processing occurs at a lower rate per total tonnage vs the rest of the company, lowering variable cost per ton
  • Focus on operating leverage: higher volumes and gross profit dollars driving SG&A efficiency (per-ton SG&A flat)

AI IconMarket Outlook

  • Q3 2026 non-GAAP diluted EPS guidance: $6.40 to $6.60 (+76% to +81% YoY)
  • Included in Q3 guidance: estimated $75M LIFO expense (~$1.10 per diluted share)
  • Border wall shipments: management expects Q3 to be near a full shipment run rate and sustained close to full run rate through mid-next year (subject to metal supply and customer inventory draw)
  • Full-year 2026 capex outlook: ~ $300M (about half allocated to strategic growth investments)

AI IconRisks & Headwinds

  • Supply availability as a headwind in nonresidential construction: some products face allocation/limited supply despite strong demand
  • LIFO volatility driven by aluminum and tariff dynamics (Section 32) and disproportionate LIFO effects: Q2 LIFO expense materially above estimate
  • International trade risks and U.S.-Iran conflict referenced as ongoing risk factors impacting costs and SG&A inflation (freight/fuel, variable warehousing/delivery)
  • Potential buyer pushback risk at high steel/aluminum pricing levels assessed; management indicates customers can still buy and competitors face inventory holes due to higher interest rates and higher carrying costs
  • Aerospace: elevated inventories persist even as commercial backlogs show early improvement

Q&A: Analyst Interest

  • Border wall contract run-rate and potential upside: Management said Q2 ramp began with shipping starting in April and volumes were stronger than anticipated; for Q3 they expect near-full shipment run rate and close-to-sustained throughput through mid-next year, subject to metal supply and customer inventory draw timing.
  • LIFO expense drivers (aluminum vs carbon) and margin distortion: CFO quantified aluminum’s outsized effect, citing aluminum as ~17% of sales and contributing about a third of the annual $300M estimate (~$100M). They described roughly 50 bps percentage-level noise from LIFO plus ~50 bps compression from aluminum’s tariff-driven pricing distortion versus two years ago.
  • Inventory posture and SG&A servicing economics for DHS contract: Management confirmed inventory turns slightly above 5x versus a company goal of 4.7, stating robust domestic purchasing with shorter lead times than imports. They attributed lower SG&A burden on the border wall to leveraging existing infrastructure and lower variable cost per ton versus company average.

Sentiment: POSITIVE

Note: This summary was synthesized by AI from the RS Q2 2026 earnings transcript. Financial data is complex; please verify all metrics against official SEC filings before making investment decisions.

📋 Official Regulatory 10-K / 10-Q SEC Filings

Direct authenticated documentation links to audited SEC database reports for RS.

SEC EDGAR Live Feed
Loading financial data and tables...
📁

SEC Filings (RS)

© 2026 Stock Market Info — Reliance Steel & Aluminum Co. (RS) Financial Profile