STAG Industrial, Inc.

STAG Industrial, Inc. (STAG) Market Cap

STAG Industrial, Inc. has a market capitalization of $7.32B.

Price: $38.26

ā–¼ -0.28 (-0.73%)

Market Cap: 7.32B

NYSE Ā· time unavailable

CEO: William R. Crooker

Sector: Real Estate

Industry: REIT - Industrial

IPO Date: 2011-04-15

Website: https://www.stagindustrial.com

STAG Industrial, Inc. (STAG) - Company Information

Market Cap: 7.32B|Sector: Real Estate

Company Profile

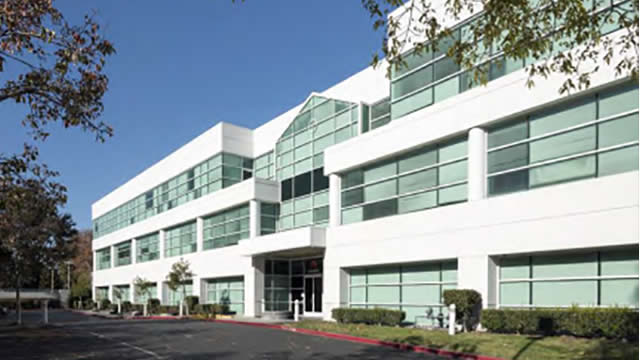
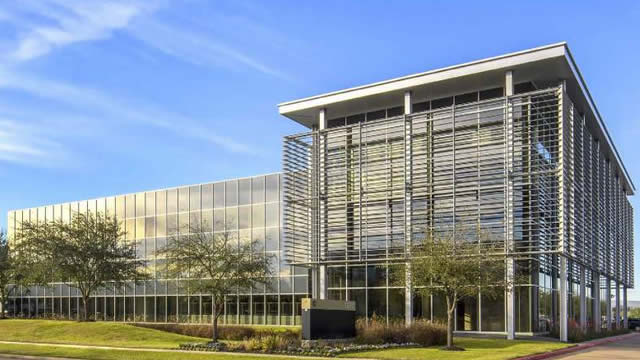
STAG Industrial, Inc. is a real estate investment company, which engages in acquiring, owning, and managing single-tenant, industrial real estate assets. It offers industrial real estate operating platform to real estate ownership. The company was founded by Benjamin S. Butcher on July 21, 2010 and is headquartered in Boston, MA.

Analyst Sentiment

68%
Buy

From 12 Active Polls

1Y Forecast: $66.75

ā–² +74.5% Potential Upside

Consensus Target Metrics

Low Bound

$41

Median

$44

High Bound

$138

Average

$67

Price & Moving Averages

Loading chart...

šŸŽÆ Wall Street Analyst Intelligence Report

1-Year structural target targets, chart projections, and sentiment maps.

Average 1Y Target
$66.75
ā–² +74.46% Upside
Low Target
$41.00
7% Risk
Median Target
$44.00
15% Mid
High Target
$138.00
261% Max
Consensus
Buy
9 / 21 Buys

Consensus Trend Projection

Trailing closures vs. 12-month metrics map.

Analyst Vote Distribution

Aggregate institutional coverage sentiment weights.

šŸ“Š Historical Valuation Multiples

Real-time Trailing Twelve Month (TTM) momentum side-by-side with discrete quarterly metrics.

Fiscal QuarterTTMQ2 2026Q1 2026Q4 2025Q3 2025Q2 2025Q1 2025Q4 2024Q3 2024
Period EndingTrailing 12MJun 30, 2026Mar 31, 2026Dec 31, 2025Sep 30, 2025Jun 30, 2025Mar 31, 2025Dec 31, 2024Sep 30, 2024
Market Cap ($M)7,3167,2736,8876,9026,5856,7676,7356,1617,115
Enterprise Value ($M)10,72810,68610,10810,1799,7039,8309,7939,18910,003
Price to Earnings Ratio (P/E)29.4333.9828.1720.8933.9333.5918.4330.2042.49
Price/Earnings-to-Growth Ratio (PEG)—470.3118.804.5119.9734.205.886.7183.82
Price to Sales Ratio (P/S)8.3132.4130.7231.2531.1932.6032.7630.9137.30
Price to Book Ratio (P/B)2.012.001.921.921.921.961.941.782.16
Price to Free Cash Flow Ratio (P/FCF)16.4659.5364.84108.3243.2262.0069.1592.9763.50
Enterprise Value to Sales (EV/Sales)—47.6345.0846.0845.9647.3547.6446.1052.44
Enterprise Value to EBITDA (EV/EBITDA)15.0961.5056.8550.3961.6961.7749.0258.3369.49
Debt to Equity Ratio4.800.960.900.920.920.890.880.890.90

šŸ“˜ Full Research Report

ā„¹ļø

AI-Generated Research: This report is for informational purposes only.

šŸ“˜ STAG INDUSTRIAL REIT INC (STAG) — Investment Overview

🧩 Business Model Overview

STAG Industrial REIT owns and operates a portfolio of single-tenant and small-multi-tenant industrial properties across major U.S. logistics corridors and local infill markets. The model is straightforward: STAG identifies properties where it can secure long-lived demand from industrial users (distribution, light manufacturing, last-mile logistics, and e-commerce-related activities), finances acquisitions/builds, leases space under negotiated terms, and converts tenant payments into stable operating cash flow.

A key feature of this model is customer and operational stickiness. Industrial tenants typically face meaningful operational disruption if they must relocate facilities—especially when a site is already optimized for access to labor, highways, and local delivery routes—supporting lower churn and recurring occupancy outcomes. STAG also manages properties with an emphasis on lease execution, market-aware rent setting, and active capital planning to preserve building utility and tenant competitiveness.

šŸ’° Revenue Streams & Monetisation Model

STAG’s revenue base is predominantly rental income, structured to be recurring and relatively insulated from short-term demand swings. Monetisation generally includes:

  • Base rent from leased industrial assets (single-tenant and multi-tenant arrangements).
  • Escalations and contractual rent growth features, which help offset inflation over time.
  • Recoveries/reimbursements for certain operating expenses, depending on lease structure.
  • Leasing and redevelopment-related cash flows through lease-up activity and value-add repositioning where underwriting supports incremental returns.

Margin drivers are closely tied to occupancy, lease renewal outcomes, and cost discipline. On the expense side, property operating costs, maintenance capital, and periodic capital expenditures determine net operating income durability. On the income side, the ability to refresh lease terms without materially degrading cash flow in weaker demand cycles is central to sustaining AFFO-style earnings power typical of industrial REITs.

🧠 Competitive Advantages & Market Positioning

STAG’s competitive positioning is best viewed as a portfolio-and-credit driven moat rather than a technology moat. The strongest durable advantages come from:

  • Tenant ā€œfacility lock-inā€ (practical switching costs): Industrial users incur time, logistics disruption, and relocation costs when moving operations. Well-located, functionally appropriate space can therefore retain tenants through cycles.
  • Local market selection and asset-level fundamentals: Emphasis on industrial properties where demand drivers (employment, logistics nodes, and transportation access) support resilient absorption and renewal probabilities.
  • Capital allocation discipline and leasing execution: REIT outperformance often reflects underwriting rigor—acquisition basis, lease structuring, and maintenance of building utility—rather than aggressive growth.

Competitive benchmarking: STAG competes with large-scale industrial REITs with different portfolio emphases, including:

  • Prologis: Broad global footprint and predominately large-scale logistics campus strategy, often competing at the top of the market with institutional-sized assets.
  • Rexford Industrial Realty: Focused on infill Southern California and similar high-demand local submarkets.
  • Duke Realty / broader industrial portfolios: Mix of operating platforms emphasizing size, development scale, and regional coverage.

Against these peers, STAG’s positioning is typically differentiated by industrial real estate selection across a wider set of markets, along with a focus on assets that can maintain cash flow through tenant turnover and leasing cycles. Where larger players may lean more heavily into top-tier logistics hubs or development pipelines, STAG’s edge tends to come from underwriting at the asset level and maintaining consistent operating performance across the portfolio.

šŸš€ Multi-Year Growth Drivers

Over a 5–10 year horizon, growth for an industrial REIT like STAG is driven by secular demand for space and the recycling of capital into higher-quality income streams:

  • U.S. industrial lease demand supported by supply-chain reconfiguration: Ongoing optimization of distribution networks and the need for modern space supports long-run occupancy for functional industrial assets.
  • Increased logistics intensity: More inventory handling, faster fulfillment expectations, and regional distribution structures support utilization of industrial footprints.
  • Capital recycling and reinvestment: Mature lease structures and asset operations create opportunities to redeploy capital into assets with stronger renewal profiles or improved rent growth characteristics.
  • Rent growth through contractual mechanisms: Lease escalators and periodic market resets can translate demand strength into cash flow over time.
  • Value creation via maintenance of building utility: Sustaining competitiveness through renovations and responsive capital plans helps protect net operating income across the lease life.

⚠ Risk Factors to Monitor

  • Interest rate and credit-market sensitivity: REIT valuation and acquisition activity are sensitive to financing costs and cap rates; higher rates can compress spreads and raise refinancing risk.
  • Tenant credit and lease rollover risk: Even with diversified industrial exposure, a recessionary environment can pressure occupancy, renewal terms, and bad-debt/abatement experience.
  • Concentration in specific logistics geographies: Industrial demand is local; regional employment or distribution-pattern changes can affect absorption and lease-up velocity.
  • Capital intensity and execution risk: Maintaining aging assets, executing repositioning, or funding development-like improvements requires disciplined capex and achievable timelines.
  • Environmental and regulatory liabilities: Typical real estate risks (hazardous materials, remediation obligations, and evolving regulations) can create cost volatility.

šŸ“Š Valuation & Market View

Industrial REIT valuation typically hinges on cash flow durability and real estate yield rather than growth multiple expansion. Markets often look to metrics such as:

  • Cap rates / implied property yields (driven by interest rates and risk appetite).
  • AFFO or FFO-based multiples that reflect recurring cash generation after maintenance capital.
  • Net asset value (NAV) considerations—the relationship between balance-sheet strength, asset-level fundamentals, and liquidation-style economics.

Key valuation drivers include occupancy trends, rent growth expectations, the trajectory of financing costs, leverage and refinancing profile, and perceived resilience of renewal outcomes through the industrial cycle.

šŸ” Investment Takeaway

STAG’s long-term case rests on owning industrial properties that can retain tenants through practical switching costs, maintaining cash-flow discipline through asset-level underwriting, and managing the balance-sheet exposure inherent to REIT structures. The moat is primarily structural and operational—tenant stickiness tied to facility utility and location, combined with consistent leasing and capital allocation execution—positioning the portfolio to compound through cycles provided interest rates and tenant credit conditions remain manageable.


⚠ AI-generated — informational only. Validate using filings before investing.
šŸ“° Market News & Coverage

15 Stories Available

Real-time institutional reporting and market updates for STAG.

marketbeat.com•2026-07-30

Stag Industrial Q2 Earnings Call Highlights

Stag Industrial NYSE: STAG said industrial real estate fundamentals continued to stabilize during the second quarter of 2026, citing stronger absorption, a reduced development pipeline and demand from e-commerce, manufacturing and data center-related users.

seekingalpha.com•2026-07-29

STAG Industrial, Inc. (STAG) Q2 2026 Earnings Call Transcript

STAG Industrial, Inc. (STAG) Q2 2026 Earnings Call Transcript

zacks.com•2026-07-29

Stag Industrial (STAG) is a Top Dividend Stock Right Now: Should You Buy?

Dividends are one of the best benefits to being a shareholder, but finding a great dividend stock is no easy task. Does Stag (STAG) have what it takes?

defenseworld.net•2026-07-29

Dimensional Fund Advisors LP Grows Holdings in Stag Industrial, Inc. $STAG

Dimensional Fund Advisors LP increased its stake in Stag Industrial, Inc. (NYSE: STAG) by 4.0% in the undefined quarter, according to its most recent disclosure with the SEC. The institutional investor owned 2,983,231 shares of the real estate investment trust's stock after acquiring an additional 113,678 shares during the period. Dimensional Fund Advisors

zacks.com•2026-07-28

Stag Industrial (STAG) Q2 FFO Meet Estimates

Stag Industrial (STAG) came out with quarterly funds from operations (FFO) of $0.65 per share, in line with the Zacks Consensus Estimate . This compares to FFO of $0.63 per share a year ago.

prnewswire.com•2026-07-28

STAG INDUSTRIAL ANNOUNCES SECOND QUARTER 2026 RESULTS

BOSTON, July 28, 2026 /PRNewswire/ -- STAG Industrial, Inc. (the "Company") (NYSE:STAG), today announced its financial and operating results for the quarter ended JuneĀ 30, 2026. "The second quarter reflected sustained execution across our platform, supported by stabilizing industrial fundamentals," said Bill Crooker, President and Chief Executive Officer of the Company.

247wallst.com•2026-07-27

5 Boomer-Proof Monthly Dividend Stocks That Pay You While You Sleep

For retirees who prefer their paychecks to arrive every 30 days instead of every 90, a small corner of the market delivers just that.

defenseworld.net•2026-07-27

Caxton Associates LLP Sells 14,895 Shares of Stag Industrial, Inc. $STAG

Caxton Associates LLP trimmed its stake in shares of Stag Industrial, Inc. (NYSE: STAG) by 40.5% during the first quarter, according to its most recent disclosure with the Securities and Exchange Commission. The institutional investor owned 21,857 shares of the real estate investment trust's stock after selling 14,895 shares during the period. Caxton

247wallst.com•2026-07-26

Forget Realty Income: 4 Other REITs Built for Dividend Investors

Realty Income (NYSE:O | O Price Prediction) gets most of the airtime in retiree circles, but it is not the only quality REIT engineered to write dividend checks year after year.

seekingalpha.com•2026-07-24

The Only 2 REITs I Would Buy Now For Retirement Income

In theory, REITs should deliver abnormal returns when inflation runs hot. In practice, REITs have barely registered positive returns. While I am not overly bullish on REITs (to say the least), I still see some exceptions that might be worth scooping up.

247wallst.com•2026-07-23

The Set It and Forget It Monthly Dividend Stocks Retirees Wish They'd Bought 20 Years Ago

Monthly dividend payers are the quiet workhorses of a retirement paycheck. They align with monthly bills, compound faster when reinvested, and let retirees stop watching a calendar for quarterly deposits.

zacks.com•2026-07-13

This is Why Stag Industrial (STAG) is a Great Dividend Stock

Dividends are one of the best benefits to being a shareholder, but finding a great dividend stock is no easy task. Does Stag (STAG) have what it takes?

247wallst.com•2026-07-09

Don’t Let Your Kids’ Braces Chew Up Your Retirement

Many parents assume braces are something they will deal with when their children reach high school. Increasingly, that is no longer true. Orthodontists now evaluate some children as early as age seven, looking for jaw-development issues, crowding, bite problems, and other concerns that can become more expensive to fix later. What once seemed like a... Don't Let Your Kids' Braces Chew Up Your Retirement

seekingalpha.com•2026-07-07

STAG Industrial's Revenue Growth And Rising Cash Flow Outshine Underperformance

STAG Industrial remains a steady, growth-focused REIT with strong cash flow and consistent revenue expansion, despite underperforming the S&P 500 since the last bullish call. STAG offers attractive exposure to the expanding e-commerce sector, with 31% of its portfolio tied to e-commerce and diversified tenant risk—Amazon represents only 2.8% of base rent. While STAG's valuation is not cheap, it trades at lower multiples than most peers and continues to grow via acquisitions, developments, and selective asset sales.

zacks.com•2026-07-06

3 Equity REIT Stocks to Watch Amid Rising Demand Trends

PEB, HPP and STAG benefit as REIT demand rises for AI-ready infrastructure, industrial assets, lodging properties and modern offices.

šŸ“Š AI Financial Analysis

Powered by StockMarketInfo
Earnings Data: Q Ending 2026-06-30

"STAG reported Q2 2026 revenue of $224.4M and net income of $52.8M (EPS $0.28). QoQ, revenue was essentially flat (+0.1%) and net income declined (-14.8%). YoY, revenue grew +8.2% versus Q2 2025 and net income rose +5.6%. Profitability was mixed across the quarter: operating income fell sharply from Q1 2026 (operating income $84.0M to $1.1M), while Q2 still delivered solid net profit margin at ~23.6%. Over the last four quarters, net margin remained roughly stable versus earlier quarters (~23–38% in prior periods), but the operating/income statement line items show meaningful volatility, likely reflecting non-cash/other expense dynamics tied to interest and other income/expense. Cash flow quality remains strong for a REIT-like business model. Operating cash flow in Q2 2026 was $110.9M and free cash flow was $122.2M, with continued shareholder distributions: dividends paid were $75.8M, representing a high payout ratio (~1.40x in the provided ratios). The balance sheet shows major leverage in prior quarters, but as of Q2 2026 total assets were $7.48B with equity of $3.63B. Total shareholder returns look favorable: the stock is up +22.27% over the past year (strong momentum >20%)."

Revenue Growth

Positive

Revenue was nearly flat QoQ (+0.1% from $224.2M in Q1 2026) and up YoY (+8.2% from $207.6M in Q2 2025), indicating steady top-line traction.

Profitability

Neutral

Net income declined QoQ (-14.8% from $62.0M to $52.8M) but increased YoY (+5.6%). Net margin stayed around ~23.6% in Q2; however operating income swung materially versus Q1, implying volatility in operating/other lines.

Cash Flow Quality

Good

Operating cash flow was $110.9M with free cash flow of $122.2M in Q2 2026. Dividend support remains active (dividends paid $75.8M), though payout ratio is elevated in the provided ratios (~1.40x).

Leverage & Balance Sheet

Neutral

As of Q2 2026, total assets were ~$7.48B and equity ~$3.63B. Reported net debt is negative (net cash position), suggesting improved balance-sheet liquidity, but earlier quarters showed substantial debt—so trends should be monitored.

Shareholder Returns

Strong

1-year price momentum is strong (+22.27%). Dividends continue to be paid (yield ~1.0% from ratios), supporting total return despite some earnings volatility.

Analyst Sentiment & Valuation

Positive

Consensus target is $42.25 versus current price $39.75, implying modest upside (~6%). High valuation multiples per provided ratios (e.g., P/E ~34) temper the score.

Disclaimer:This analysis is AI-generated for informational purposes only. Accuracy is not guaranteed and this does not constitute financial advice.

Fundamentals Overview

Loading fundamentals overview...

STAG reported stabilizing industrial fundamentals in Q2 2026, emphasizing a peaked vacancy view supported by accelerated net absorption (69m sq ft in the quarter; 111m in the first half) and a contracted development pipeline (~2% under construction, ~55% pre-leased). Operating delivery remains strong: Core FFO per share was $0.65 (+3.2% YoY), same-store cash NOI rose 3.4% in Q2 (+3.9% YTD), and 36 leases totaling 5.6m sq ft generated 19.8% cash and 33.7% straight-line spreads with 75.7% retention. Guidance improved modestly: credit loss reduced 50→30 bps, occupancy raised by 25 bps to 96.25%–97.25%, cash same-store growth lifted to 3.0%–3.5%, and Core FFO guidance increased $0.01 at midpoint. Capital markets activity remains active via ATM ($131m gross proceeds) alongside refinancing (5 bps bank-debt savings). The key macro risk is rates volatility impacting acquisition cadence and a few regional pockets (notably port markets and Reno distribution softness).

AI IconGrowth Catalysts

  • Data center-related tenant demand: leased 2.3 million square feet since beginning of last year; weighted avg lease term ~7 years; tenants rolled up 33%
  • E-commerce as a demand tailwind (e-commerce share of retail sales hit record earlier this year)
  • Nearshoring/onshoring demand supporting warehouse rationalization and supply-chain diversification
  • Increased acquisition/lease activity positioning improved rent growth into 2027

Business Development

  • Build-to-suit: 343,000 sq ft in Rockwall, TX (Northeast of Dallas) closed April 2026; expected delivery Q2 2027; expected yield 7.5%
  • Build-to-suit: 184,000 sq ft in Chandler, AZ (Southeast Phoenix) closed April 2026; breaking ground targeted late Q3 2026; expected delivery Q3 2027
  • Lease execution: 35,000 sq ft (25% of Tampa development) to a fueling solutions provider; starts August 1
  • Lease executed after quarter end: 47,000 sq ft (62% of a Reno development) to an e-commerce company; starts September 1

AI IconFinancial Highlights

  • Core FFO per share: $0.65 (+3.2% YoY); leverage net debt/annualized run-rate adjusted EBITDA 5.2x (5.1x including unfunded $70m forward equity)
  • Liquidity: $614m at quarter end
  • Leasing spreads: 19.8% cash and 33.7% straight-line leasing spreads on 36 leases totaling 5.6 million sq ft
  • Retention: 75.7% in the quarter; guidance narrowed to 75%
  • Same-store cash NOI: +3.4% for the quarter; +3.9% YTD
  • Acquisition volume: $287.1m in Q2; 7 buildings; cash cap rates 6.1% and straight-line 6.8%
  • Development platform: 9 buildings / 2.3 million sq ft not in service; expected stabilized yields 7.1%
  • Guidance updates: credit loss reduced 50 bps to 30 bps (20 bps improvement); average same-store occupancy increased by 25 bps to 96.25%–97.25%
  • Cash same-store growth guidance increased to 3.0%–3.5% (up 25 bps at midpoint)
  • Core FFO guidance increased to $2.61–$2.65 per share (up $0.01 at midpoint)

AI IconCapital Funding

  • ATM: issued 3.4 million shares forward at gross average $39; gross proceeds $131m
  • Settlements: $59.8m proceeds related to forward ATM sales settled in Q2
  • Forward equity: $70m unfunded; management to use discretion to pay down revolver and match fund net acquisition/development pipeline
  • Debt actions: repaid $50m private placement Note B (matured July 1); refinanced $150m Term Loan A and $200m Term Loan F into a single $350m term loan
  • Refinancing: new term loan maturity January 16, 2032; fixed interest rate (incl. swaps) 3.53% until March 2027 then 4.79% thereafter
  • Repricing benefit: achieved 5 basis point savings across all bank debt; interest expense savings going forward

AI IconStrategy & Ops

  • Vacancy peaked nationally and within STAG portfolio; net absorption 69m sq ft in Q2 (up from Q1); 111m sq ft in first half (best start since 2022)
  • Supply discipline: development pipeline contracted ~half from 2022 peak; under construction product ~2% of total stock; ~55% pre-leased
  • Development execution: Dallas build-to-suit source internally; expected delivery Q2 2027 yield 7.5%; Chandler project design in progress with targeted late Q3 groundbreak
  • Leasing execution: 92% of forecasted 2026 leasing addressed at levels consistent with initial guidance
  • Occupancy dynamics: company frames Q2 as a trough; spot same-store occupancy in Q2 ~96% with average occupancy guided flat after slight pickup later in year

AI IconMarket Outlook

  • Industrial fundamentals stabilize; management constructive into back half 2026
  • Net absorption acceleration: 69m sq ft in Q2; 111m sq ft in first half
  • 2026 guidance midpoint occupancy revised to 96.75% (range 96.25%–97.25%)
  • 2026 leasing spreads expected 18%–20% (closer to high end)
  • 2026 leasing progress: 92% of forecasted leasing executed at guidance-consistent levels
  • Dispositions expected to continue in back half; company sold 3 assets YTD (2 noncore, 1 opportunistic); guidance implies more dispositions in H2

AI IconRisks & Headwinds

  • Macro/rates volatility: management cited volatility in rates and macro environment as a reason not to emphasize higher acquisition cadence in Q3/Q4
  • Reno exposure: Reno activity slower for distribution tenants; activity primarily concentrated in manufacturing/data center; remaining 284,000 sq ft North Valley submarket still unleased as of transcript
  • Port markets slower: Savannah and Charleston noted as somewhat slower; El Paso slower due to U.S.–Mexico relations
  • Occupancy recovery pattern: occupancy pickup expected later in year; average occupancy expected to stay relatively flat for remainder of 2026

Q&A: Analyst Interest

  • Acquisition cadence & pipeline: Management said there is ā€œnot much under contract or LOI,ā€ hence only ~$50m raise at midpoint. They expect Q4 historically largest but avoided confident Q3/Q4 cadence due to rate/macro volatility; if rates stabilize, pace can hold.
  • Leasing spreads & occupancy trajectory: Management reiterated 18%–20% leasing spreads for 2026, likely toward the high end. They explained Q1’s ~35%–36% new-lease spreads versus Q2 roll dynamics, and guided revised occupancy midpoint 96.75%, with average flat after a year-end pickup.
  • Development demand & in-process projects: Management described under-construction pool as 65% leased, boosted by build-to-suit skew. They cited strong tour activity in Kansas City (Lenexa) and timing constraints in Phoenix (groundbreak late Q3). For Reno, they confirmed the 47,000 sq ft lease post-quarter end but flagged distribution softness.

Sentiment: MIXED

Note: This summary was synthesized by AI from the STAG Q2 2026 earnings transcript. Financial data is complex; please verify all metrics against official SEC filings before making investment decisions.

šŸ“‹ Official Regulatory 10-K / 10-Q SEC Filings

Direct authenticated documentation links to audited SEC database reports for STAG.

SEC EDGAR Live Feed
Loading financial data and tables...
šŸ“

SEC Filings (STAG)

Ā© 2026 Stock Market Info — STAG Industrial, Inc. (STAG) Financial Profile