The Timken Company

The Timken Company (TKR) Market Cap

The Timken Company has a market capitalization of .

No quote data available.

CEO: Lucian Boldea

Sector: Industrials

Industry: Manufacturing - Tools & Accessories

IPO Date: 1922-01-01

Website: https://www.timken.com

The Timken Company (TKR) - Company Information

Market Cap: -|Sector: Industrials

Company Profile

The Timken Company designs, manufactures, and manages engineered bearings and power transmission products worldwide. It operates in two segments, Mobile Industries and Process Industries. The Mobile Industries segment offers a portfolio of bearings, seals, and lubrication devices and systems, as well as power transmission components, engineered chains, augers, belts, couplings, clutches, brakes, and related products and maintenance services to original equipment manufacturers (OEMs) and end-users of off-highway equipment for the agricultural, construction, mining, outdoor power equipment, and power sports markets; and on-highway vehicles, including passenger cars, light trucks, and medium- and heavy-duty trucks, as well as rail cars and locomotives. It also provides power transmission systems and flight-critical components for civil and military aircraft, which include bearings, rotor-head assemblies, helicopter transmission systems, turbine engine components, gears, and housings. This segment sells its parts through a network of authorized automotive and heavy-truck distributors to individual end-users, equipment owners, operators, and maintenance shops. The Process Industries segment provides industrial bearings and assemblies; power transmission components, such as gears and gearboxes; and linear motion products, couplings, seals, lubricants, chains, belts, and related products and services to OEMs and end-users in various industries. It also offers aftermarket sales and service needs through a network of authorized industrial distributors; and repair and service for bearings and gearboxes, as well as electric motor rewind, repair, and services to end-users. The company offers its products under the Timken, Philadelphia Gear, Drives, Cone Drive, Rollon, Lovejoy, Diamond, BEKA, and Groeneveld brands. The Timken Company was founded in 1899 and is headquartered in North Canton, Ohio.

Analyst Sentiment

69%
Buy

From 12 Active Polls

1Y Forecast: $138.33

▲ +0.0% Potential Upside

Consensus Target Metrics

Low Bound

$117

Median

$140

High Bound

$158

Average

$138

Price & Moving Averages

Loading chart...

🎯 Wall Street Analyst Intelligence Report

1-Year structural target targets, chart projections, and sentiment maps.

Average 1Y Target
$138.33
▲ +4.93% Upside
Low Target
$117.00
-11% Risk
Median Target
$140.00
6% Mid
High Target
$158.00
20% Max

Consensus Trend Projection

Trailing closures vs. 12-month metrics map.

Analyst Vote Distribution

Aggregate institutional coverage sentiment weights.

Sentiment volume allocation data unavailable.

Historical valuation matrix unavailable.

📘 Full Research Report

ℹ️

AI-Generated Research: This report is for informational purposes only.

📘 TIMKEN (TKR) — Investment Overview

🧩 Business Model Overview

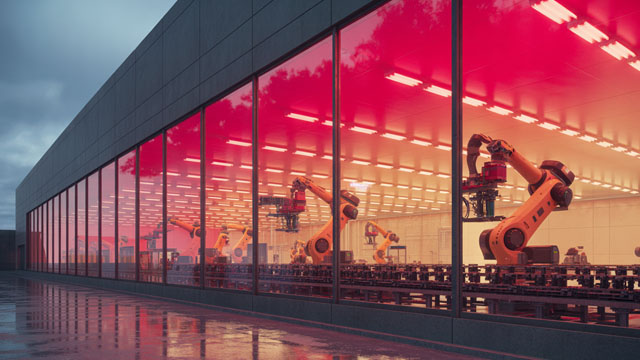
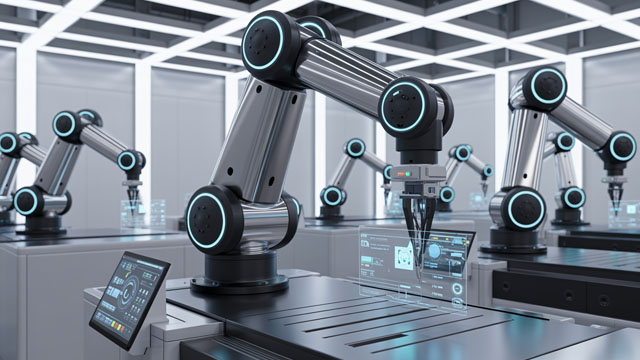
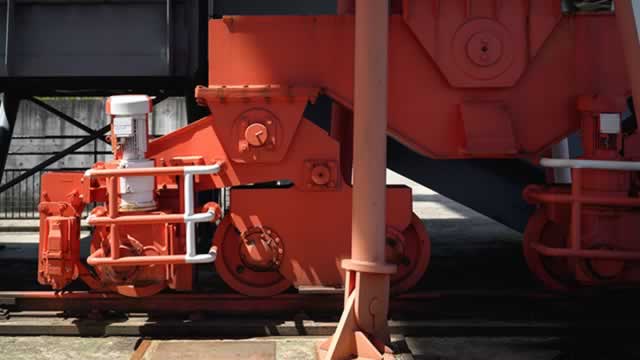
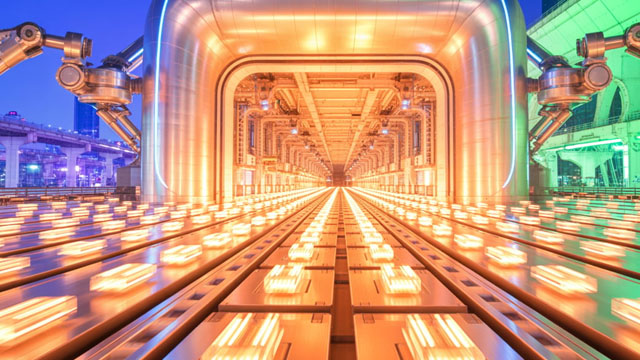
TIMKEN engineers and manufactures bearings, bearing-related components, and power-transmission products used to reduce friction and support high-load motion in demanding industrial environments. The value chain centers on (1) design and application engineering to match bearing geometry, materials, lubrication conditions, and life requirements to specific machine duty cycles, (2) precision manufacturing and heat-treatment/metallurgy capabilities that drive reliability, and (3) distribution and service support that helps customers select products, manage spares, and minimize unplanned downtime.

Customer stickiness is reinforced through qualification processes (OEM and industrial installed base), the operational cost of bearing failures, and the engineering collaboration required for performance verification—factors that make switching to an alternate supplier slower and more costly than in commoditized components.

💰 Revenue Streams & Monetisation Model

Revenue is primarily product-driven and monetizes through a blend of:

  • OEM sales (new equipment production): transactional orders with margins shaped by engineered content, customer-specific designs, and pricing discipline.
  • Aftermarket/installed-base sales: replacement demand that benefits from the long service life of industrial machinery and the need to maintain reliability over time.
  • Specialty and engineered solutions: higher value content where performance requirements and application engineering increase the amount of “customization-to-order” versus purely standardized product.

Margin drivers typically include mix shift toward engineered and specialty products, manufacturing efficiency, heat-treatment/material execution, and the ability to pass through input cost changes without losing pricing power. Because bearings are embedded in customer assets, aftermarket share can be a stabilizer during OEM downcycles, though overall demand remains tied to industrial production levels.

🧠 Competitive Advantages & Market Positioning

TIMKEN’s moat is strongest in switching costs and reliability/engineering differentiation—a “hard-to-qualify” proposition rather than a pure cost or scale story.

  • Switching costs (qualification + operational risk): Customers—especially in heavy industry and transportation—qualify bearing designs through testing and validation. Requalification can be time-consuming and carries downtime risk, particularly for critical rotating equipment.
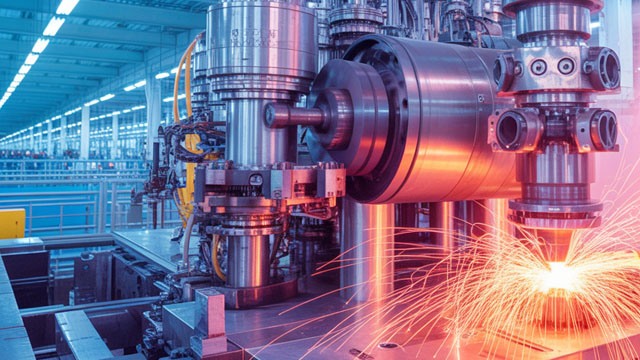
  • Performance differentiation (materials + process control): Bearing life and fatigue resistance depend on metallurgy, heat treatment, and precision manufacturing. These factors are difficult to replicate quickly and can be tied to proprietary process know-how and engineering depth.
  • Application engineering and service support: Margin durability improves when TIMKEN participates earlier in design for OEM programs and when it supports faster selection and spares management in aftermarket channels.

Competitive benchmarking:

  • SKF and Schaeffler: large, diversified bearing and motion-control competitors with strong global manufacturing and broad product coverage. They compete heavily on engineering content in industrial and transportation end markets.
  • NSK: another global bearing leader focused on precision and reliability across a range of demanding applications.
  • Contrast vs. TIMKEN: TIMKEN’s industry focus emphasizes engineered reliability in heavy-load, harsh-duty rotating applications where performance verification and qualification matter most—areas where supplier substitution tends to be slower and more engineering-intensive than in light-duty or highly commoditized categories.

🚀 Multi-Year Growth Drivers

A durable growth outlook over a 5–10 year horizon is supported by demand linked to the expansion and modernization of industrial infrastructure, plus replacement cycles in the installed base:

  • Industrial capacity additions and upgrades: Steel, mining, cement, chemicals, and other heavy industries require ongoing rotating equipment renewal and modernization, sustaining replacement demand.
  • Electrification and drivetrain evolution: Electric motors, wind/renewables, and electrified industrial equipment shift the bearing ecosystem toward designs optimized for new operating profiles (speed, thermal behavior, and load patterns).
  • Higher reliability requirements: Customers seek reduced downtime, improved energy efficiency, and longer service intervals, supporting engineered and specialty product content.
  • Geographic industrialization: Growth in industrial output across emerging markets expands the TAM for bearings and power-transmission components, particularly as local factories build new equipment and expand throughput.
  • Aftermarket installed-base tailwind: As equipment fleets age, replacement and overhaul cycles increase the addressable aftermarket opportunity and tend to provide resilience versus pure OEM-only exposure.

⚠ Risk Factors to Monitor

  • Industrial cyclicality: Bearings and motion products track industrial production, freight/rail volumes, and capital spending. Downcycles can pressure utilization and margins.
  • Input cost and supply constraints: Bearings depend on steel and alloy inputs and precision components. Sharp cost swings or supply disruptions can impact profitability if not managed through procurement and pricing actions.
  • Customer concentration and program timing: OEM awards and industrial projects can shift over time; delays in new equipment programs can affect near-term volumes.
  • Competitive dynamics and pricing pressure: Large global rivals can use capacity and scale to defend share, potentially compressing margins in certain categories.
  • Technology substitution risk in end markets: Changes in machine design (including drivetrain architectures) can alter bearing requirements. The risk is mitigated when suppliers maintain engineering breadth and can qualify new solutions effectively.

📊 Valuation & Market View

TIMKEN typically trades as a manufacturer in the industrial/precision components complex, where valuation frameworks often emphasize earnings durability and cycle-adjusted margins rather than purely asset-light growth. Common market approaches include:

  • EV/EBITDA or EV/EBIT for cyclical industrial platforms—sensitive to operating leverage and margin normalization assumptions.
  • P/E where investors forecast a return to normalized profitability and disciplined capital allocation (working capital and capex efficiency).

Key valuation drivers include: (1) ability to sustain engineered/specialty mix, (2) manufacturing and process execution that protects gross margin, (3) resilience from aftermarket and diversified end markets, and (4) returns on invested capital across the product footprint.

🔍 Investment Takeaway

TIMKEN’s long-term investment case rests on durable competitiveness in demanding bearing and motion applications, supported by switching costs from qualification, process- and metallurgy-driven reliability, and deep application engineering that makes supplier substitution difficult. While end-market cycles influence volumes, the installed-base aftermarket opportunity and engineered-content focus provide a foundation for sustained operating performance across an industrial modernization cycle.


⚠ AI-generated — informational only. Validate using filings before investing.

📊 AI Financial Analysis

Powered by StockMarketInfo
Earnings Data: Q Ending 2026-03-31

"TKR reported Q1 2026 revenue of $1.23B and net income of $105.9M (EPS: $1.41). On a YoY basis (vs. Q1 2025), revenue rose +7.9% ($1.23B vs. $1.14B) and net income increased +35.3% ($105.9M vs. $78.3M), with net margin expanding to 8.6% from 6.9%. QoQ (vs. Q4 2025), revenue increased +10.8% and net income jumped +69.9% ($105.9M vs. $62.3M). Profitability improved as operating margin rose to 13.7% (from 12.1% in Q4) and net margin also expanded materially. Cash generation was mixed quarter-to-quarter: operating cash flow was $39.3M in Q1 2026 (down from $183.3M in Q4) as working-capital/cash conversion dynamics moderated, and free cash flow was $0.5M after capex and acquisitions. However, balance-sheet resilience remains strong: total assets increased to $6.88B and equity was stable around $3.19B–$3.37B, while total debt was slightly higher to $2.17B (net debt $1.82B). Shareholder returns look highly positive given the market’s momentum—TKR is up 76.6% over the last year (total return supported primarily by capital appreciation), with dividend yield around 0.36%."

Revenue Growth

Positive

Revenue grew +7.9% YoY (Q1 2026: $1.23B vs. $1.14B) and +10.8% QoQ (vs. Q4 2025: $1.11B), indicating improving demand/throughput.

Profitability

Strong

Net income rose +35.3% YoY and +69.9% QoQ; net margin expanded to 8.6% from 6.9% YoY and from 5.6% QoQ. Operating margin also improved to 13.7%.

Cash Flow Quality

Fair

Operating cash flow declined QoQ ($39.3M vs. $183.3M), and free cash flow was near breakeven ($0.5M). Still, net income remains solid, but cash conversion is less supportive this quarter.

Leverage & Balance Sheet

Positive

Balance sheet remains resilient with equity largely stable (~$3.19B–$3.37B) and total assets up to $6.88B. Net debt increased modestly to ~$1.82B, but leverage does not appear stressed.

Shareholder Returns

Excellent

Strong total shareholder momentum: price is up 76.6% over the last year, well above the 20% threshold. Dividend yield is modest (~0.36%), so returns are driven mainly by capital appreciation.

Analyst Sentiment & Valuation

Neutral

Consensus price target ($115.33) is modestly above the current price (~$107.66). With a relatively high P/E (per provided ratios), upside may be more dependent on sustained earnings momentum.

Disclaimer:This analysis is AI-generated for informational purposes only. Accuracy is not guaranteed and this does not constitute financial advice.

Fundamentals Overview

Loading fundamentals overview...

Timken delivered a strong Q1 2026 with $1.23B revenue (+8% YoY) and adjusted EPS of $1.67 (+~20%). Core momentum was Industrial Motion: organic +7% and segment EBITDA margin expansion to 21.5% on favorable price/mix, higher volumes, and mix from more profitable platforms, partially offset by Engineered Bearings margin pressure (19.7% vs 20.9%). Despite tariffs as a $20M headwind, management highlighted a $32M pricing benefit and raised full-year guidance: organic revenue +3% (midpoint), total sales +4%-6%, and adjusted EPS $5.75-$6.25 (midpoint +$0.25). Portfolio execution under the 80/20 program is a central lever: Belts sale to Gates (announced May 1; close expected Q3) and Bijur Delimon acquisition (closed mid-March) reinforcing higher-margin lubrication and automation platforms. Risks remain mainly macro/tariff fluidity and inflation timing, with guidance explicitly assuming no IEPA refunds and embedding only known price actions.

AI IconGrowth Catalysts

  • Industrial Motion organic revenue growth >4% overall, driven by higher pricing and volume (Industrial Motion organic +7%); automation-related factory automation wins
  • Linear motion platform double-digit organic growth in The Americas, attributed to new business wins within factory automation
  • Portfolio optimization/80/20 execution intended to structurally improve Industrial Motion margin profile
  • Improved end-market demand and strengthening order activity/backlog (order book up sequentially and year over year)

Business Development

  • Divestiture: sale of Belts business to Gates (announced May 1; expected close in Q3 2026)
  • Acquisition: Bijur Delimon (closed mid-March 2026); scales automated lubrication systems platform to nearly $400M in total revenue (expected margin accretion to Industrial Motion)

AI IconFinancial Highlights

  • Total revenue: $1.23B, up 8% YoY; organic revenue up 4.3% YoY (+4.3% organic)
  • Adjusted EPS: $1.67, up nearly 20% YoY; EBITDA margins expanded to 18.8% (from 18.2% last year); segment Industrial Motion adjusted EBITDA margin 21.5% (up vs prior year)
  • EBITDA bridge: tariffs headwind of $20M; pricing positive $32M (nearly +3% top-line recovery of tariff margin impact); material/logistics costs lower; mix favorable
  • Operating cash flow: $39M; after CapEx, free cash flow slightly positive (seasonally lowest quarter); full-year FCF guide $350M-$375M (~105% conversion on GAAP net income at midpoint)
  • 2026 guidance raised: total net sales +4%-6% (vs prior 2%-4%); organic +3% at midpoint (up +1 point); adjusted EPS $5.75-$6.25 (midpoint +$0.25 vs prior); consolidated adjusted EBITDA margin ~18% midpoint (vs 17.4% in 2025)

AI IconCapital Funding

  • Share repurchases: repurchased ~280k shares in Q1 2026; returned $53M to shareholders via buybacks and dividends in the quarter
  • Balance sheet: net leverage 2.1x at quarter end (near middle of targeted range)
  • New capital authorization: board approved new five-year share repurchase authorization for 10 million shares

AI IconStrategy & Ops

  • 80/20 enterprise expansion: transformation office with dedicated 80/20 teams; nearly 300 Timken leaders fully trained
  • Operational emphasis: reorganized commercial teams into verticalized/regional teams with autonomy under a global framework
  • Industrial Motion margin improvement tied to higher volumes and favorable price/mix; Engineered Bearings margins pressured by higher operating costs
  • Expected seasonality: Q1 highest EPS; Q2 sequential decline expected from Q1 then normal step-down through Q4

AI IconMarket Outlook

  • Full-year 2026: organic revenue +3% at midpoint; total revenue +4%-6%; adjusted EPS $5.75-$6.25; EBITDA margin ~18% at midpoint; incremental margin ~30% full year
  • Tariff/guidance math: +$0.15 EPS tailwind from tariffs change (lower tariff on India; modest net positive impact from Section 232 changes on April 6)
  • Q2 outlook: organic revenue, adjusted EBITDA margins, and adjusted EPS all higher YoY; adjusted EPS modestly lower sequentially due to incremental inflation and customer activity pulled from Q2 related to Middle East uncertainty
  • Investor Day: Wednesday, May 20, NYC (virtual or in person)

AI IconRisks & Headwinds

  • IEPA/India tariff process unfolding: guidance assumes no IEPA refunds; management noted no refunds assumed in guidance
  • Additional tariff risk is “fluid”; management does not anticipate further February-sized impacts but acknowledged future administration changes could affect results
  • Cost inflation risk: ~$0.10 per share headwind placeholder for potential incremental cost inflation over the rest of the year (with region-by-region variability)
  • Middle East disruption: Iran-conflict uncertainty may pull down macro economies; management sees no demand destruction yet but remains cautious and expects some impact risk
  • Margin pressure in Engineered Bearings: adjusted EBITDA margin 19.7% vs 20.9% last year due to higher operating costs

Q&A: Analyst Interest

  • Topic: Tariff benefit assumptions and refund/extra-tariff scenarios (IEPA + Section 232). Management clarified the $0.15 EPS tailwind drivers (India IEPA change and April 6 Section 232 update), and stated guidance assumes no IEPA refunds. On further tariffs, they said the situation is fluid and would be communicated if impacted.
  • Topic: Organic cadence and pull-forward into Q1 from Q2; conservatism vs underlying demand. Management said they cannot precisely quantify exact pull-forward but estimated about 1% top-line was pulled from Q2 into Q1 versus normal seasonality expecting a couple-percent step up. They described cautious optimism: order book robust, no demand destruction yet, but Iran-related macro uncertainty remains.
  • Topic: Backlog pockets, April vs March order activity, and price/cost inflation embedding. Management said order book up significantly YoY with strongest contributions from off-highway, aerospace, rail, and wind; April was “about where we thought we would be” and continued March dynamics (more product sooner). For price/cost, they embedded only prices already in the guide; $0.10 inflation headwind reflects prudence on timing mismatch.

Sentiment: POSITIVE

Note: This summary was synthesized by AI from the TKR Q1 2026 earnings transcript. Financial data is complex; please verify all metrics against official SEC filings before making investment decisions.

Loading financial data and tables...
© 2026 Stock Market Info — The Timken Company (TKR) Financial Profile