Texas Pacific Land Corporation

Texas Pacific Land Corporation (TPL) Market Cap

Texas Pacific Land Corporation has a market capitalization of $27.77B.

Price: $402.58

8.33 (2.11%)

Market Cap: 27.77B

NYSE · time unavailable

CEO: Tyler Glover

Sector: Energy

Industry: Oil & Gas Exploration & Production

IPO Date: 1980-03-17

Website: https://www.texaspacific.com

Texas Pacific Land Corporation (TPL) - Company Information

Market Cap: 27.77B|Sector: Energy

Company Profile

Texas Pacific Land Corporation (TPL) operates in two core business segments: land and resource management, and water services. Its Land and Resource Management division oversees a vast land portfolio, spanning nearly 880,000 acres. This segment also holds significant oil and gas royalty interests. These include perpetual non-participating royalty interests (NPRIs) covering approximately 85,000 acres (at a 1/128th rate) and about 371,000 acres (at a 1/16th rate). Furthermore, it possesses around 4,000 additional net royalty acres, primarily located in West Texas. The segment grants various easements and commercial leases for purposes such as oil, gas, and hydrocarbon infrastructure, power and utility lines, and subsurface wellbores. It also leases its land for facilities like processing, storage, and compression plants, as well as roads, and sells materials such as caliche. The Water Services and Operations division provides comprehensive water solutions to energy operators throughout the Permian Basin. Its services encompass water sourcing, the gathering and treatment of produced water, infrastructure development, disposal solutions, water tracking, analytics, and well testing. This segment also generates royalty income from water extracted from its own lands. Founded in 1888, Texas Pacific Land Corporation maintains its headquarters in Dallas, Texas.

Analyst Sentiment

60%
Buy

From 2 Active Polls

1Y Forecast: $639.00

▲ +58.7% Potential Upside

Consensus Target Metrics

Low Bound

$639

Median

$639

High Bound

$639

Average

$639

Price & Moving Averages

Loading chart...

🎯 Wall Street Analyst Intelligence Report

1-Year structural target targets, chart projections, and sentiment maps.

Average 1Y Target
$639.00
▲ +58.73% Upside
Low Target
$639.00
59% Risk
Median Target
$639.00
59% Mid
High Target
$639.00
59% Max
Consensus
Buy
3 / 5 Buys

Consensus Trend Projection

Trailing closures vs. 12-month metrics map.

Analyst Vote Distribution

Aggregate institutional coverage sentiment weights.

📊 Historical Valuation Multiples

Real-time Trailing Twelve Month (TTM) momentum side-by-side with discrete quarterly metrics.

Fiscal QuarterTTMQ1 2026Q4 2025Q3 2025Q2 2025Q1 2025Q4 2024Q3 2024Q2 2024
Period EndingTrailing 12MMar 31, 2026Dec 31, 2025Sep 30, 2025Jun 30, 2025Mar 31, 2025Dec 31, 2024Sep 30, 2024Jun 30, 2024
Market Cap ($M)27,76832,72519,80421,47824,29530,50825,45320,36916,679
Enterprise Value ($M)27,53632,49319,69120,96323,75130,04825,08319,83515,784
Price to Earnings Ratio (P/E)55.1257.3140.1144.2152.3063.0953.6947.6736.39
Price/Earnings-to-Growth Ratio (PEG)4.809.595.3311.497.6266.84
Price to Sales Ratio (P/S)33.10138.1993.60105.76129.54155.67137.00117.3696.78
Price to Book Ratio (P/B)17.8421.0313.5715.7018.8525.2922.4819.3613.83
Price to Free Cash Flow Ratio (P/FCF)56.29211.59232.93157.92206.61206.47224.59-2121.74181.48
Enterprise Value to Sales (EV/Sales)137.2193.07103.22126.64153.32135.01114.2891.59
Enterprise Value to EBITDA (EV/EBITDA)39.49163.61118.73123.21145.99180.64154.41140.49114.95
Debt to Equity Ratio-0.330.010.020.010.00

📘 Full Research Report

ℹ️

AI-Generated Research: This report is for informational purposes only.

📘 TEXAS PACIFIC LAND CORP (TPL) — Investment Overview

🧩 Business Model Overview

Texas Pacific Land Corp is a land- and asset-management company with economic exposure to the development of hydrocarbons and water use in the Permian Basin. The value chain is relatively indirect: TPL’s returns are driven by (1) royalty-like economics from land and mineral interests, and (2) surface-linked revenues tied to the use of TPL’s extensive acreage for access, infrastructure, and water-related activities supporting nearby drilling operations. In practice, TPL benefits when operators expand drilling and completion activity because those activities require land/surface access and water logistics that are often constrained by geography, permitted infrastructure, and operating footprint.

This structure creates operator “stickiness” because replacing geographic access and permitted/operational arrangements typically requires time, capex, and regulatory effort—factors that favor incumbent landholders with established rights and working relationships.

💰 Revenue Streams & Monetisation Model

TPL monetizes its asset base through two primary channels:

  • Hydrocarbon-related economics: Land and mineral interests generate revenue that scales with regional activity levels (drilling and production). This component is largely variable and commodity-linked.
  • Water and land-use services: Revenues can also be tied to water sourcing, transfer, and logistics, along with surface access/usage economics associated with development on or near TPL-held acreage.

Margin drivers typically include the fixed vs. variable cost structure of land-related services, the extent to which water/land-use arrangements rely on TPL-controlled infrastructure or permissions, and the degree to which operating costs (including logistics and regulatory compliance) remain lower than alternatives within the same operating footprint.

🧠 Competitive Advantages & Market Positioning

TPL’s competitive position is best understood as a geographic and asset-rights moat rather than an operational scale advantage in commodity production. The durability of the moat comes from:

  • Geographic cost advantage: Concentrated Permian acreage and related rights reduce the cost and friction for operators seeking land/surface access and water logistics near drilling locations.
  • High friction to replicate: Competing land positions or water sourcing arrangements generally require new access, permitting, and the buildout of operational logistics—often creating delays and incremental cost.
  • Intangible asset—permitting/infrastructure footprint: Established operating relationships, local knowledge, and the historical development of permissions and surface arrangements can create an effective barrier even when commodity prices are the headline driver.
  • Customer stickiness (implicit switching costs): Once operators integrate land access and water logistics into their operating plans, switching to meaningfully different geography can add time, cost, and execution risk.

Competitive benchmarking: TPL’s closest “peers” are not identical business models, but they share exposure to Permian development economics through royalty/land interests and/or producer-adjacent land returns. Examples include:

  • Permian Basin Royalty Trust and Sabine Royalty Trust (royalty-focused structures tied to regional production)
  • Mesa Royalty Trust (royalty-focused exposure to basin production)

Compared with these royalty-focused competitors, TPL’s positioning is more closely tied to the surface-and-logistics layer of development (including water/land-use economics and operational access), whereas many royalty trusts are more purely tied to production volumes from underlying interests.

🚀 Multi-Year Growth Drivers

Over a 5–10 year horizon, growth depends less on market expansion for a product and more on the persistence of development activity in the Permian and the evolving demand for water and surface access. Key drivers include:

  • Permian development longevity: The basin’s inventory of drilling locations supports multi-year cycle depth, sustaining demand for land access and supporting services.
  • Water intensity and logistical constraints: As drilling and completion activity scales, water sourcing and transportation become central constraints. Assets that reduce logistical distance and friction can capture value.
  • Operational footprint compounding: Existing acreage rights and established arrangements tend to become more embedded as operators build multi-pad and multi-year operating plans.
  • Infrastructure-adjacent value capture: Where development concentrates near incumbent surface rights, incremental activity can convert into higher aggregate land-use and water-related utilization.

⚠ Risk Factors to Monitor

  • Commodity-linked variability: Hydrocarbon economics and regional activity levels remain sensitive to crude oil and natural gas pricing, affecting drilling pace and resource utilization.
  • Regulatory and permitting risk: Water sourcing, environmental compliance, and land-use rules can change with federal/state actions, impacting costs and the economics of service arrangements.
  • Operational concentration risk: Heavy exposure to one basin/geography increases the impact of localized regulatory, infrastructure, or water-supply constraints.
  • Counterparty and execution risk: TPL’s economics depend on operators’ ability and willingness to execute drilling and completions, as well as on the operational feasibility of water/logistics arrangements.
  • Capital intensity and infrastructure substitution: While TPL benefits from incumbent advantages, alternative water logistics or new acreage positions could partially offset the moat if they materially reduce operator friction or cost.

📊 Valuation & Market View

TPL is typically valued through frameworks that reflect its asset-backed economics and commodity-linked cash generation. Market participants often focus on cash-flow sensitivity to basin activity rather than traditional operating leverage alone. Drivers that tend to move valuation include:

  • Commodity price environment and the resulting effective drilling and production activity levels.
  • Water logistics utilization (volume and economics of land-linked water services).
  • Quality and durability of asset rights (extent of acreage control, enforceability, and longevity of monetization channels).
  • Cost to serve and compliance burden related to surface and water activities.

In general, the market can apply a premium or discount depending on perceived moat strength (geographic/logistics embedment), visibility into utilization, and how effectively the company converts basin activity into distributable cash flows relative to peers.

🔍 Investment Takeaway

TPL’s long-term appeal rests on a geographic and rights-based moat in the Permian Basin that translates basin development into land-linked and logistics-linked revenues. The key question for investors is not production growth in the traditional sense, but the durability of TPL’s surface access and water-logistics value capture as drilling activity persists and water constraints tighten. If those advantages remain embedded, TPL’s economics can compound with basin activity; if regulatory or infrastructure substitution reduces friction and incremental value capture, the moat would narrow.


⚠ AI-generated — informational only. Validate using filings before investing.
📰 Market News & Coverage

15 Stories Available

Real-time institutional reporting and market updates for TPL.

gurufocus.com2026-07-31

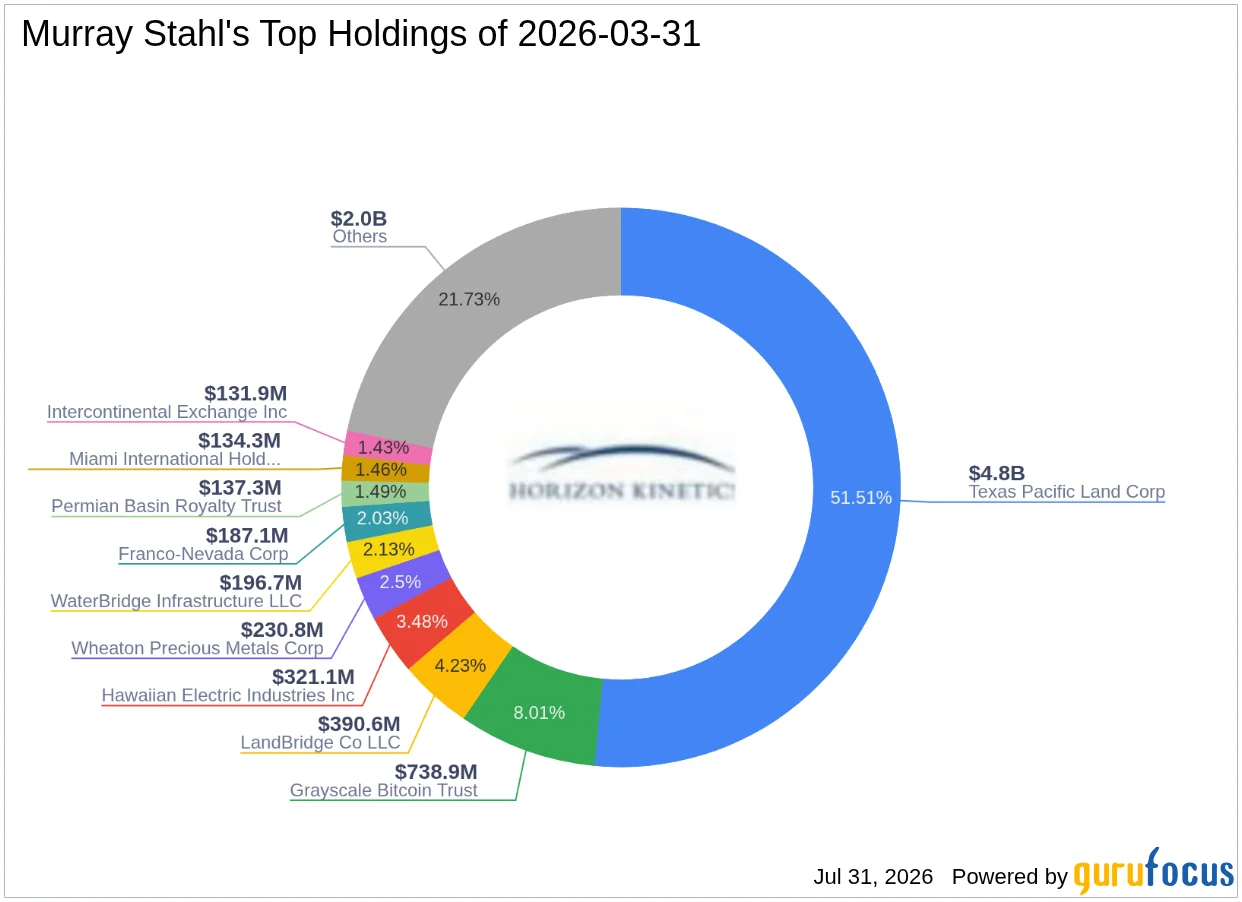
Murray Stahl Expands RENN Fund Inc (RCG) Stake in Value-Driven Move

On July 24, 2026, Murray Stahl (Trades, Portfolio), through Horizon Kinetics, increased the firm's position in RENN Fund Inc (NYSE: RCG) by purchasing 756 additi

seekingalpha.com2026-07-26

America's Most Powerful Banker Just Confirmed It: I Want These 5 Stocks, Not The Market

I prioritize a TOLL+M investment model—tangible assets, oligopoly advantages, low incremental CapEx, durable cash flows, and macro tailwinds—to build resilient portfolios. Jamie Dimon highlights that even with 2% inflation, 10-year yields should remain above 4.0-4.5% due to risk premiums, supporting my 'run-it-hot' thesis. The S&P 500 prices in a 'good outcome' with little margin of safety; I see greater opportunity in selective stock picking over broad index exposure.

defenseworld.net2026-07-26

First Trust Advisors LP Purchases 29,252 Shares of Texas Pacific Land Corporation $TPL

First Trust Advisors LP raised its position in Texas Pacific Land Corporation (NYSE: TPL) by 23.1% during the first quarter, according to the company in its most recent disclosure with the Securities and Exchange Commission. The institutional investor owned 155,810 shares of the financial services provider's stock after buying an additional 29,252 shares

defenseworld.net2026-07-26

Comparing Texas Pacific Land (NYSE:TPL) & Stabilis Solutions (NASDAQ:SLNG)

Stabilis Solutions (NASDAQ: SLNG - Get Free Report) and Texas Pacific Land (NYSE: TPL - Get Free Report) are both energy companies, but which is the superior business? We will compare the two companies based on the strength of their analyst recommendations, profitability, risk, valuation, earnings, institutional ownership and dividends. Insider and Institutional Ownership 3.8% of Stabilis

defenseworld.net2026-07-21

California Public Employees Retirement System Has $48.22 Million Holdings in Texas Pacific Land Corporation $TPL

California Public Employees Retirement System increased its holdings in Texas Pacific Land Corporation (NYSE: TPL) by 1.7% in the first quarter, according to its most recent Form 13F filing with the Securities and Exchange Commission. The institutional investor owned 101,608 shares of the financial services provider's stock after purchasing an additional 1,717 shares

defenseworld.net2026-07-19

Texas Pacific Land Corporation $TPL Shares Bought by Bank of New York Mellon Corp

Bank of New York Mellon Corp grew its holdings in Texas Pacific Land Corporation (NYSE: TPL) by 1.3% during the first quarter, according to the company in its most recent filing with the Securities and Exchange Commission. The firm owned 357,379 shares of the financial services provider's stock after acquiring an additional 4,570

businesswire.com2026-07-15

Texas Pacific Land Corporation Sets Dates for Second Quarter 2026 Earnings Release and Conference Call

DALLAS--(BUSINESS WIRE)--Texas Pacific Land Corporation Sets Dates for Second Quarter 2026 Earnings Release and Conference Call.

fool.com2026-07-13

Why Texas Pacific Land Corporation Rallied Over 50% in the First Half of 2026

Texas Pacific owns a large amount of land and royalty rights in West Texas in the Permian Basin. Aside from being a center for oil and gas development, West Texas is becoming a hub for AI infrastructure development.

seekingalpha.com2026-07-09

LandBridge & Texas Pacific Land: The Picks-And-Shovels Of The West Texas AI Boom

Texas Pacific Land is now primarily an AI infrastructure and data center land play, not just an oil royalty company. TPL's valuation implies an excessive amount of GW of future data center capacity. I rate TPL a SELL with a $250 price target, as its premium bakes in excessive data center growth; LandBridge is a BUY at $75, reflecting more realistic expectations.

seekingalpha.com2026-07-07

Here's Exactly How I'd Invest $1 Million In America Today

I present a $1 million 'All-American' portfolio blending 50% S&P 500 ETF with six sector-leading U.S. stocks. VOO anchors the portfolio for low-cost, broad exposure, while single-stock picks target finance (MA, CME), energy (TPL), agriculture (DE), aerospace/defense (RTX), and consumer (MCD). Each stock is selected for durable advantages: MA and CME for scalable, oligopolistic finance; TPL for energy royalties; DE for agricultural tech; RTX for balanced defense/commercial aerospace; MCD for global brand and real estate model.

seekingalpha.com2026-06-30

Texas Pacific Land: Why I've Decided To Initiate A 'Buy And Monitor' Position

I've decided to replace my existing Permian exploration and production exposure with Texas Pacific Land Corporation. The stock shows evidence of upside capture during bullish oil price cycles. Water services and toll-booth oil and gas royalties limit downside capture in down-cycles. I enjoy the idea of CapEx being spent on growth instead of maintenance, which is a feature distinct from oil and gas producers.

zacks.com2026-06-26

Implied Volatility Surging for Texas Pacific Land Stock Options

Investors need to pay close attention to TPL stock based on the movements in the options market lately.

businesswire.com2026-06-23

Texas Pacific Land Corporation Announces Agreement to Provide Land and Water Solutions to Chevron for a Large-Scale Power Project

DALLAS--(BUSINESS WIRE)--TEXAS PACIFIC LAND CORPORATION ANNOUNCES AGREEMENT TO PROVIDE LAND AND WATER SOLUTIONS TO CHEVRON FOR A LARGE-SCALE POWER PROJECT.

seekingalpha.com2026-06-05

Dividend Champion, Contender, And Challenger Highlights: Week Of June 7

A weekly summary of dividend activity for Dividend Champions, Contenders, and Challengers. Companies which changed their dividends. Companies with upcoming ex-dividend dates.

247wallst.com2026-06-03

Exxon SVP Warns Oil Could Spike to $150-160 Per Barrel in ‘Coming Weeks'

An Exxon senior vice president just told Tom Bilyeu's Impact Theory podcast that physical Brent cargoes are heading to $150 to $160 per barrel in the coming weeks as global inventories approach all-time lows.

📊 AI Financial Analysis

Powered by StockMarketInfo
Earnings Data: Q Ending 2026-03-31

"TPL reported Q1 2026 results of $236.8M revenue and $142.9M net income (EPS $2.07). On a YoY basis (vs. Q1 2025), revenue rose ~20.9% ($195.98M to $236.82M) and net income increased ~18.4% ($120.65M to $142.90M). QoQ (vs. Q4 2025), revenue grew ~11.9% ($211.58M to $236.82M) and net income improved ~16.0% ($123.35M to $142.90M). Profitability appears resilient: net margin was ~60.3% in Q1 2026, up from ~58.3% in Q4 2025 and ~61.6% in Q1 2025, suggesting overall stable high-margin earnings. Cash generation remained strong. Operating cash flow was $162.0M and free cash flow (FCF) $154.7M in Q1 2026. Shareholder returns via distributions are visible: dividends paid were $42.0M, and there were no buybacks reported this quarter. Balance sheet liquidity strengthened materially—cash & equivalents rose to $247.6M, while net debt stayed deeply negative (net cash) at about -$231.7M (i.e., substantial net cash vs. debt of $15.8M), with equity at $1.56B. Total shareholder return is supported by strong 6-month and YTD price gains (6m +35.1%, YTD +41.8%), although 1-year momentum is slightly negative (-0.77%). Analyst consensus valuation context shows a $639 target consensus vs. a $422.58 price, implying meaningful upside."

Revenue Growth

Strong

YoY revenue growth of ~20.9% in Q1 2026 ($236.8M vs. $196.0M). QoQ revenue increased ~11.9% ($236.8M vs. $211.6M), indicating accelerating top-line momentum.

Profitability

Good

Net income up ~18.4% YoY and ~16.0% QoQ. Net margin was ~60.3% in Q1 2026—slightly above Q4 2025 (~58.3%) and broadly consistent with prior quarters, suggesting stable profitability.

Cash Flow Quality

Good

Q1 2026 operating cash flow of $162.0M and FCF of $154.7M. Dividend payments of $42.0M were meaningful; payout ratio ~29% indicates generally sustainable cash distribution coverage.

Leverage & Balance Sheet

Strong

Strong balance-sheet resilience: total assets rose to $1.75B with equity of $1.56B. Net debt remained deeply negative (~-$231.7M), showing ample liquidity and limited leverage risk.

Shareholder Returns

Positive

Total return signals are mixed: price is up strongly over 6m (+35.1%) and YTD (+41.8%) but slightly down over 1Y (-0.77%). Dividends were paid (payout ratio ~29%); no buybacks reported in Q1.

Analyst Sentiment & Valuation

Positive

Consensus target price of $639 vs. $422.58 current implies substantial upside. Price multiples appear elevated (e.g., P/E ~57), so execution must remain strong to justify valuation.

Disclaimer:This analysis is AI-generated for informational purposes only. Accuracy is not guaranteed and this does not constitute financial advice.

Fundamentals Overview

Loading fundamentals overview...

TPL delivered a record Q1 2026 with ~$237m revenue (+12% sequential, +21% YoY), ~$181m adjusted EBITDA (+2% sequential, +7% YoY), and ~$136m free cash flow (+15% sequential, +8% YoY). The run-rate is primarily royalties benefiting from completion activity tied to Occidental, BP, Devon, and Exxon, with oil production averaging ~37,001 boe/d (+19% YoY). Management reiterated a fully unhedged posture, meaning upside sensitivity of roughly +$50m annual revenue per $10/bbl oil realization (using FY2025 volumes). Commercial momentum is accelerating: a first power/data-center land agreement totaled $43m paid over 20 years, and hyperscalers are increasingly prioritizing speed to power and behind-the-meter gas generation. On the operational side, Phase 2B produced-water desalination (10,000 bpd) is near completion with commissioning steps in late May/early June. Near-term guidance is largely timeline-based rather than numeric; key risk is commodity-supply-shock duration uncertainty and legacy-segment lumpiness.

AI IconGrowth Catalysts

  • Agreement to sell a small section of land for $43 million with annual payments over 20 years, tied to power generation/data center land opportunity
  • Phase 2B produced water desalination: 10,000-barrel-per-day facility nearly complete; refrigeration inspection planned for later this month and expect to begin flowing inlet water barrels in the coming weeks
  • Permian royalty acceleration via higher completion activity (Delaware and Midland) and management expectation that elevated crude could drive incremental rig/frac intensity over coming quarters
  • Higher-quality well inventory expansion: line-of-sight wells up 11% sequentially on a net normalized basis due to longer laterals (>13,000 feet)

Business Development

  • Royalty completion activity attributed to Occidental, BP, and Devon in Loving/northern Reeves (Delaware Basin)
  • Royalty completion activity attributed to Exxon in Martin County (Midland Basin)
  • Land-and-water power/data center project: explicitly stated to be not BOLT-related; discussions include potential progression from brackish water to produced water and possible desalinated water use later
  • Ongoing hyperscaler/AI lab evaluation of Texas large-scale power and compute projects (no named counterparties beyond generic descriptions)

AI IconFinancial Highlights

  • Total revenue: ~$237 million, quarterly all-time high; +12% sequential; +21% YoY
  • Adjusted EBITDA: ~$181 million; +2% sequential; +7% YoY
  • Free cash flow: ~$136 million; +15% sequential; +8% YoY
  • Oil and gas royalties: production averaged ~37,001 boe/d; ~flat sequentially; up ~19% YoY
  • Commodity revenue sensitivity (unhedged, FY2025 volumes illustrative): every +$10/bbl oil realization ≈ +$50 million annual revenue; every +$5/bbl NGL realization ≈ +$17 million annual revenue
  • No explicit bps margin changes, tax, or tariff impacts disclosed in the provided transcript

AI IconCapital Funding

  • No buyback/debt/cash runway amounts disclosed in the provided transcript

AI IconStrategy & Ops

  • Maintained fully unhedged oil and gas position to benefit directly from elevated oil prices
  • Well inventory metrics (quarter-end): 5.8 net permitted wells; 9.6 net drilled but uncompleted (DUCs); 5.2 net completed but not producing; 20.7 net line-of-sight wells (+6% sequential)
  • Permian drilling trend: operators pushing longer laterals; new permits and new spuds average >13,000 feet
  • Produced water desalination positioned as R&D at scale and pathway toward upstream/economic viability; also aimed to enable evaluation of waste heat capture, cooling colocation, and utilization of outlet freshwater and concentrated brine streams

AI IconMarket Outlook

  • Management expects oil-price-driven ramp in rig/frac activity over coming quarters if price signal persists
  • Produced water desalination timeline: refrigeration inspection later this month; begin flowing inlet water barrels in the coming weeks
  • Investor/field tour in Midland on May 18, 2026 (RSVP email details mentioned)

AI IconRisks & Headwinds

  • Permian and industry activity sensitivity to uncertainty around duration of global oil supply shock
  • Legacy segment revenue can be lumpy (SLEM), and reported quarter results may not reflect underlying trend
  • Water segment volumes and produced accruals may show noise, requiring multi-quarter trend viewing (management cited a three-quarter lens for produced water)

Q&A: Analyst Interest

  • Land and water agreement counterparty/structure: Management said the land-and-water deal is not BOLT-related, and they can’t discuss counterparty or scale beyond prior release details. They indicated it likely uses brackish water initially and are discussing produced water and possible desalinated water later for this and other projects.
  • Desalination program feasibility and funding: Management framed Phase 2B/scale as “R&D at scale,” targeting 10,000 bpd commercial sizing and demonstrating 24/7 operability for upstream economics before colocation. For colocation, they evaluate structures to reduce operator upstream costs, but provided no partner naming or funding commitments.
  • Legacy revenue volatility interpretation (SLEM and water): Management cautioned against over-interpreting single-quarter outcomes, noting SLEM is lumpy with potential big infrastructure hits within a quarter. For water, they emphasized produced should be viewed on a three-quarter trend due to contractual/functional volume drivers and possible accrual noise.

Sentiment: POSITIVE

Note: This summary was synthesized by AI from the TPL Q1 2026 earnings transcript. Financial data is complex; please verify all metrics against official SEC filings before making investment decisions.

📋 Official Regulatory 10-K / 10-Q SEC Filings

Direct authenticated documentation links to audited SEC database reports for TPL.

SEC EDGAR Live Feed
No recent 10-K available.
No recent 10-Q available.
Loading financial data and tables...
📁

SEC Filings (TPL)

© 2026 Stock Market Info — Texas Pacific Land Corporation (TPL) Financial Profile