Worthington Steel, Inc.

Worthington Steel, Inc. (WS) Market Cap

Worthington Steel, Inc. has a market capitalization of .

No quote data available.

CEO: Geoffrey G. Gilmore

Sector: Basic Materials

Industry: Steel

IPO Date: 2023-12-04

Website: https://www.worthingtonsteel.com

Worthington Steel, Inc. (WS) - Company Information

Market Cap: -|Sector: Basic Materials

Company Profile

Worthington Steel, Inc. operates as a steel processor in North America. It offers carbon flat-rolled steel and tailor welded blanks, as well as electrical steel laminations; and aluminum tailor welded blanks. The company serves various end-markets, including automotive, heavy truck, agriculture, construction, and energy. Worthington Steel, Inc. was incorporated in 2023 and is based in Columbus, Ohio.

Analyst Sentiment

67%
Buy

From 2 Active Polls

1Y Forecast: $46.00

▲ +0.0% Potential Upside

Consensus Target Metrics

Low Bound

$46

Median

$46

High Bound

$46

Average

$46

Price & Moving Averages

Loading chart...

🎯 Wall Street Analyst Intelligence Report

1-Year structural target targets, chart projections, and sentiment maps.

Average 1Y Target
$46.00
▲ +10.79% Upside
Low Target
$46.00
11% Risk
Median Target
$46.00
11% Mid
High Target
$46.00
11% Max

Consensus Trend Projection

Trailing closures vs. 12-month metrics map.

Analyst Vote Distribution

Aggregate institutional coverage sentiment weights.

Sentiment volume allocation data unavailable.

Historical valuation matrix unavailable.

📘 Full Research Report

ℹ️

AI-Generated Research: This report is for informational purposes only.

📘 WORTHINGTON STEEL INC (WS) — Investment Overview

🧩 Business Model Overview

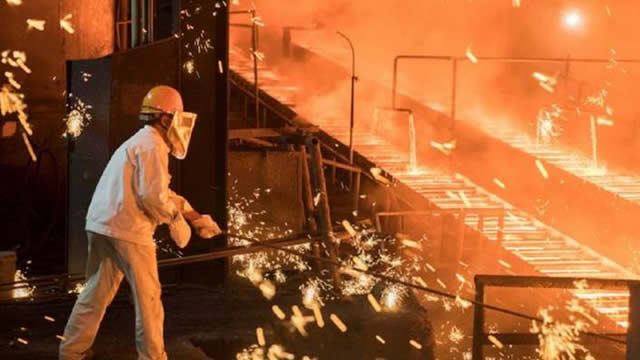
Worthington Steel operates in the steel value chain by converting raw steel inputs (typically sourced through a mix of scrap/ferrous inputs and purchased steel products) into higher-spec, customer-ready steel offerings used by industrial and energy-linked end markets. The economics depend on procurement discipline (input costs), plant/mill productivity (throughput, yields, and conversion costs), and execution in order fulfillment (service levels, quality conformity, and supply continuity).

Customer stickiness is reinforced through repeat ordering, product qualification, and standardized specifications. For buyers, switching suppliers can trigger requalification effort, changes to procurement qualification lists, and operational risk around material performance. That dynamic increases the value of stable production and consistent quality.

💰 Revenue Streams & Monetisation Model

Revenue is predominantly transactional and tied to order flow in steel and processed steel products, with margin driven by the relationship between realized selling prices and the cost of steel inputs plus conversion costs. While steel sales are not “recurring” like subscriptions, the business can exhibit quasi-repeat characteristics when customers maintain approved suppliers and consistent specification requirements.

Key margin drivers typically include:

  • Input cost capture: alignment of purchase costs (scrap/steel) with selling prices.
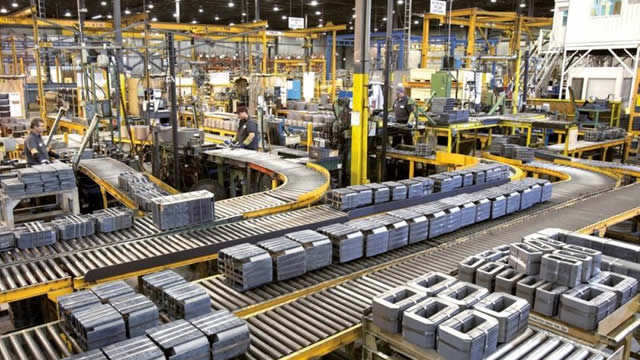
  • Operational leverage: plant utilization, yield management, and labor/energy efficiency.
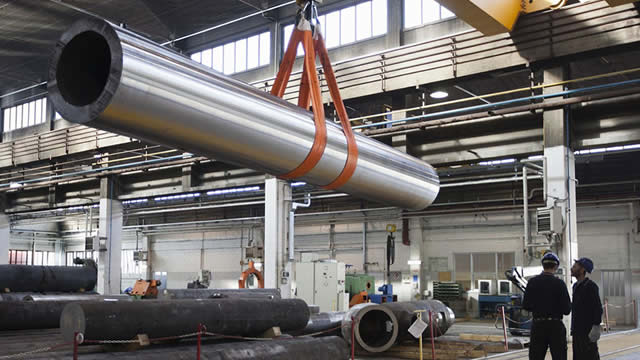
  • Product mix: higher-value grades/specifications generally carry better incremental margins.
  • Logistics and fulfillment: freight, loading efficiency, and the ability to meet delivery windows reduce customer demurrage/penalty risk and protect pricing.

🧠 Competitive Advantages & Market Positioning

The moat in this industry is less about proprietary technology and more about cost discipline and execution plus qualification-based switching costs.

  • Switching costs (quality + qualification): steel buyers often require approved suppliers and documented material compliance. Once qualified, customers prefer continuity to minimize revalidation and performance risk.
  • Cost advantage through procurement and logistics: in North American steelmaking, the ability to secure competitively priced inputs and manage transportation/freight is a durable advantage, especially during volatility in commodity inputs.
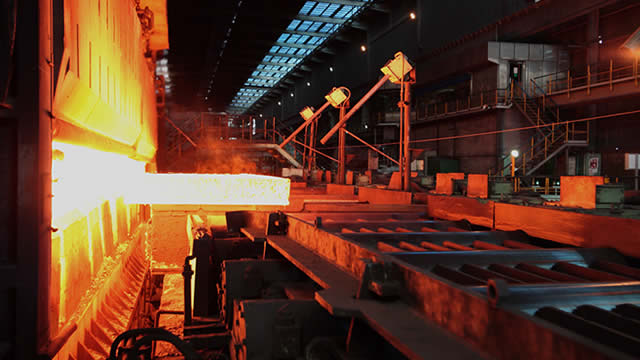
  • Operational know-how: throughput consistency, scrap/metal yield, and defect minimization improve unit economics across the cycle.

Competitive benchmarking: primary competitors include Nucor and Steel Dynamics (large North American steel producers with strong mini-mill economics) and Cleveland-Cliffs (a major iron-ore-based integrated producer). These rivals differ in structural cost position and product focus—large scale producers tend to compete more aggressively in broader commodity categories, whereas Worthington Steel’s positioning is typically anchored in supplying customer-qualified, ready-to-use steel products into industrial and energy-adjacent demand pockets where consistency, service, and spec adherence matter.

🚀 Multi-Year Growth Drivers

Over a 5–10 year horizon, growth is likely to be driven by a combination of end-market demand and structural sourcing advantages:

  • U.S. and North American infrastructure and industrial capex: transportation, construction, and industrial equipment spending supports steel consumption, with preference for dependable suppliers.
  • Energy-linked demand for pressure/structural applications: maintenance, expansions, and replacement cycles in energy infrastructure support ongoing steel replacement needs.
  • Specification complexity and grade mix: as industrial requirements tighten (strength, toughness, compliance), suppliers with execution capability and stable quality profiles can capture better pricing.
  • Localized supply chain dynamics: logistics and lead-time constraints often favor regional capacity and qualified suppliers over distant alternatives.
  • Input-cost resiliency from North American supply: broad access to ferrous feedstock (including scrap markets) and the ability to manage procurement timing can stabilize margins across the cycle.

⚠ Risk Factors to Monitor

  • Cyclicality and pricing volatility: steel is highly sensitive to global capacity additions, demand swings, and steel spreads.
  • Input cost swings: scrap/ferrous input pricing and energy costs can move faster than selling prices, pressuring margins.
  • Capital intensity and operating leverage: maintenance capex, productivity upgrades, and working-capital needs can be demanding during downturns.
  • Trade policy and protectionism: tariffs, import quotas, and anti-dumping actions can reshape competitive intensity and pricing.
  • Execution risk: quality nonconformance, production disruptions, and slower turnaround times can increase customer churn risk.

📊 Valuation & Market View

Markets generally value steel producers on earnings power through the cycle rather than long-duration growth narratives. Sector valuation is commonly framed around EV/EBITDA (or similar cash-flow-based multiples), with the key variables being:

  • Operating margins driven by spread between realized prices and input/conversion costs
  • Utilization and productivity (capacity discipline, yield, and energy efficiency)
  • Working capital intensity (inventory turns and receivables discipline)
  • Downside protection from balance-sheet resilience and flexibility in capex

Because the industry cycle can dominate reported performance, the market’s “multiple” tends to rise when durability of margins is perceived and compress when volatility and capacity risks intensify. Analysts often focus less on point-in-time earnings and more on cost structure credibility, procurement advantage, and maintenance of product mix through the cycle.

🔍 Investment Takeaway

Worthington Steel’s long-term investment case centers on qualification-driven switching costs and cost/operational execution in a commodity-volatile industry. The structural strengths to underwrite include stable procurement discipline and logistic effectiveness for North American sourcing, paired with consistent quality and service that sustain repeat business. The primary debate is not whether steel demand fluctuates—it does—but whether management can preserve competitive unit economics and protect margins through input volatility and cyclical downswings.


⚠ AI-generated — informational only. Validate using filings before investing.

📊 AI Financial Analysis

Powered by StockMarketInfo
Earnings Data: Q Ending 2026-02-28

"Latest quarter (2026-02-28) showed Revenue of $769.8M and Net Income of $10.4M (EPS $0.22). QoQ, Revenue fell from $871.9M to $769.8M (-11.7%), and Net Income dropped from $18.8M to $10.4M (-44.7%), indicating margin pressure. Net margin contracted to ~1.35% (from ~2.16% prior quarter), consistent with profitability deterioration over the last four reported quarters (net income peaked at $55.7M on 2025-05-31, then declined). Cash flow remains positive: Free Cash Flow (FCF) was $117.4M, down modestly QoQ (-7.9%) from $127.4M, with operating cash flow also weakening (to $63.3M from $98.0M). On the balance sheet, Total Assets increased to $2.32B (+7.6% QoQ), while Equity was broadly stable at $1.36B (+0.8% QoQ). Net debt rose to $262.6M (+38.9% QoQ), modestly reducing resilience. Shareholder returns have been strong: the stock is up 42.9% over 1 year, and the dividend yield is ~0.39% (low yield, but supported by earnings). Note: YoY growth rates are not computable from the provided dataset due to missing same-quarter prior-year figures."

Revenue Growth

Caution

Revenue declined QoQ by -11.7% (from $871.9M to $769.8M). YoY growth was not available because the same quarter last year is not included in the dataset.

Profitability

Neutral

Net income fell QoQ by -44.7% (from $18.8M to $10.4M) and net margin contracted to ~1.35% (from ~2.16%), signaling profitability deterioration.

Cash Flow Quality

Neutral

FCF stayed positive at $117.4M, down -7.9% QoQ. Dividends are paid (~$8.1M) with an implied recent payout ratio ~0.78, suggesting coverage is weaker than earlier quarters but still supported by positive FCF.

Leverage & Balance Sheet

Neutral

Total assets increased QoQ (+7.6%) and equity was stable (+0.8%). Net debt rose to $262.6M (+38.9% QoQ), a modest headwind to financial resilience.

Shareholder Returns

Good

Strong capital appreciation: +42.9% over 1 year. Dividend yield is low (~0.39%), so total returns are dominated by price momentum rather than income.

Analyst Sentiment & Valuation

Neutral

Consensus target is $38 versus price $34.4 (~10.5% implied upside). Valuation looks rich: P/E ~49.8 in the latest quarter (up from 22.6 prior), limiting the score despite upside.

Disclaimer:This analysis is AI-generated for informational purposes only. Accuracy is not guaranteed and this does not constitute financial advice.

Fundamentals Overview

Loading fundamentals overview...

Management delivered a “disciplined quarter” narrative with positives (automotive share gains; solid cash/free cash flow; confidence in hitting Kloeckner 57.5% threshold; AI/automation benefits). However, Q&A underscored operational and financial friction points. On automotive, analyst follow-up highlighted the mismatch between direct auto volume (+10% / Detroit Three +13% shipments) and broader direct volumes (+3%); Jeff attributed the gap largely to share gains but also cited a concrete supply-chain disruption from late-January Midwest weather impacting ~10,000–15,000 tons (and estimating ~15,000 more could have shipped). On Kloeckner, the question forced clarity on capital structure and liquidity: WS increased ABL by $126m and already deployed $101m to buy ~8.3m shares, but rising Kloeckner price halted further purchases because it moved above tender economics (price shut them out). Working capital risk is explicitly flagged: Q4 should see upward working-capital pressure tied to the higher share price, even as inventory-holding gains are guided at $15m–$20m for FY2026.

AI IconGrowth Catalysts

  • Automotive market share gains: direct shipments to Detroit Three +13% vs Detroit Three production +3% (Q3).
  • Ag ramping: secured new business with a key OEM customer; agriculture volume +9% YoY.
  • Construction/Infrastructure: expectation of data center growth and 2026 expansion as interest rates lower; heavy truck/trailer expected pickup in back half of 2026 (Class 8 and trailer).
  • Near-cycle trough view: management asserts Q3 was the trough and expects slow rebound beginning late calendar 2026.

Business Development

  • Kloeckner acquisition: voluntary public tender offer in Germany; confident to reach 57.5% minimum threshold; expected close in second half of calendar 2026 (subject to tender + regulatory approvals).
  • Ag OEM win (named as 'key customer' / 'key OEM customer in the ag sector'; no name provided).
  • Automotive OEM customer returning to more normal build schedule after curtailing production last fiscal year (customer not named).

AI IconFinancial Highlights

  • Reported EPS: $0.20 (earnings $10.4m) vs prior-year $0.27; adjusted EPS $0.27 vs $0.35 prior-year.
  • Net sales: $769.8m; adjusted EBITDA $41.6m.
  • Adjusted EBIT: $20.0m vs $25.3m prior-year (down $5.3m), mainly from lower toll volumes, higher SG&A, and unfavorable Europe results.
  • Toll processing volumes: -22% YoY (cyclical demand headwinds + impact from Cleveland Worthington Samuel facility consolidation in May 2025).
  • Total shipments: ~818k tons (-64k tons / -7% YoY). Mix shift: direct sale volume 63% vs 57% prior-year.
  • Direct spreads relatively flat YoY excluding CEDIM; inventory holding gains: Q3 pretax gains estimated vs losses in prior year.

AI IconCapital Funding

  • Borrowings on ABL increased $126.0m; used $101.0m to purchase ~8.3m Kloeckner shares (~8% of Kloeckner shares).
  • Cash: $90.0m at quarter end; net debt: $161.0m (up sequentially largely due to Kloeckner share purchases).
  • CapEx: $30.0m in quarter; FY2026 CapEx guidance $110m–$115m.
  • Dividend: quarterly dividend $0.16/share payable June 26, 2026.

AI IconStrategy & Ops

  • Electrical steel capacity move (Canada): shifted production to new facility; finish equipment transfer over next few months; sequencing startup to protect performance/service levels; sold >60% of increased capacity for the facility; expects to fill remaining balance relatively quickly as ramp proceeds.
  • Traction motor lamination expansion (Mexico): on track; begins shipping production parts this quarter; OEM delays pushed full production timing from fiscal 2028 to fiscal 2029; at full production targeted at 75% capacity based on current contracts.
  • Transformation / lean flow (Delta, Ohio): implemented lean flow pull model; results: 60% fewer coils in WIP bay; reduced inventory by 6 days over past 26 months; next step adds predictive AI tools for earlier problem detection and lower working capital.
  • Administrative automation: AI agent for daily cash posting expected to eliminate ~30 hours/month of analyst time; AP automation reducing manual interventions to remove ~150 hours/month as models improve; order-to-cash robotic automation reconciling shipping notices with customer portal data to accelerate cash collection and reduce past-due balances.
  • Europe operational hurdle: CEDIM EBIT prior to minority interest decreased $8.4m in the quarter due to weak electrical steel/auto demand and intensified competition (esp. China); management cited urgency to improve performance via cost actions and operational adjustments.

AI IconMarket Outlook

  • Automotive: outlook into CY2026 cautiously optimistic; moving toward more robust market later in year.
  • USMCA: growing confidence agreement will be completed in 2026 to reduce uncertainty.
  • Agriculture: nearing trough; slow rebound begins late CY2026; ramp from new business expected over next few quarters.
  • Construction: expects data center growth; with lower interest rates, expects some expansion in 2026 due to pent-up demand.
  • Heavy truck/trailer: market started slowly in early CY2026; more confident in back half with pickup in Class 8 and trailer.
  • Working capital: Q4 expected upward pressure on working capital due to rising Kloeckner share price (explicit working-capital direction given, not quantified).
  • Inventory holding gains: management estimates FY2026 pretax inventory holding gains range $15m–$20m.

AI IconRisks & Headwinds

  • Galvanized spreads compressed; holiday/winter weather dampened and delayed industrial activity.
  • Customer inventory discipline: sensitive to interest rates and uncertainty; volumes up but overall conditions stable-to-soft.
  • Europe underperformance: CEDIM EBIT (pre-minority interest) -$8.4m in quarter; demand weak in electrical steel/automotive; competition intensified (China cited).
  • Auto supply chain/fulfillment disruption: Midwest weather late January disrupted mills shipping/receiving/customer deliveries; impact ~10,000–15,000 tons; estimated could have shipped ~15,000 additional tons; backlog being made up in March.
  • OEM delays (traction motor lamination expansion): OEMs pushed out programs due to shifts in electrification strategy; full production levels pushed from fiscal 2028 to fiscal 2029; results in lower utilization assumption (75% capacity based on current contracts at full production).
  • Potential macro geopolitical risk (Iran / oil prices): management said current impact is not major but would be concerned if prolonged (higher energy prices could hurt both Europe and U.S.).

Sentiment: MIXED

Note: This summary was synthesized by AI from the WS Q3 2026 earnings transcript. Financial data is complex; please verify all metrics against official SEC filings before making investment decisions.

Loading financial data and tables...
© 2026 Stock Market Info — Worthington Steel, Inc. (WS) Financial Profile