
Allient Inc. (ALNT) Market Cap
Allient Inc. has a market capitalization of $1.49B.
Price: $87.46
▲ 1.25 (1.45%)
Market Cap: 1.49B
NASDAQ · time unavailable
CEO: Richard S. Warzala
Sector: Industrials
Industry: Electrical Equipment & Parts
IPO Date: 1980-10-20
Website: https://www.allient.com
Allient Inc. (ALNT) - Company Information
Market Cap: 1.49B|Sector: Industrials
Company Profile
Allient Inc., headquartered in Amherst, New York, and founded in 1962, is a global enterprise specializing in the engineering, production, and distribution of high-precision, specialized controlled motion components and integrated systems. The company, which rebranded from Allied Motion Technologies Inc. in August 2023, provides an extensive array of products. These offerings range from various types of motors, including brush, brushless DC, brushless servo, torque, and coreless DC motors, to integrated motor-drives, gearmotors, and gearing. Additionally, their portfolio encompasses advanced electronic solutions such as modular digital servo drives, motion controllers, optical encoders, active and passive filtering systems, input/output modules, industrial communication gateways, and light-weighting technologies, among other motion control-related innovations. Allient's sophisticated solutions cater to a diverse global clientele, serving both end-users and original equipment manufacturers (OEMs) across critical sectors like automotive, medical, aerospace, defense, and broader industrial markets. The company distributes its products through a multi-channel sales strategy, utilizing its internal sales team, a network of authorized manufacturers' representatives, and independent distributors.
Analyst Sentiment
From 5 Active Polls
1Y Forecast: $76.80
▼ -12.2% Potential Upside
Consensus Target Metrics
Low Bound
$70
Median
$79
High Bound
$80
Average
$77
Price & Moving Averages
🎯 Wall Street Analyst Intelligence Report
1-Year structural target targets, chart projections, and sentiment maps.
Consensus Trend Projection
Trailing closures vs. 12-month metrics map.
Analyst Vote Distribution
Aggregate institutional coverage sentiment weights.
📊 Historical Valuation Multiples
Real-time Trailing Twelve Month (TTM) momentum side-by-side with discrete quarterly metrics.
| Fiscal Quarter | TTM | Q1 2026 | Q4 2025 | Q3 2025 | Q2 2025 | Q1 2025 | Q4 2024 | Q3 2024 | Q2 2024 |
|---|---|---|---|---|---|---|---|---|---|
| Period Ending | Trailing 12M | Mar 31, 2026 | Dec 31, 2025 | Sep 30, 2025 | Jun 30, 2025 | Mar 31, 2025 | Dec 31, 2024 | Sep 30, 2024 | Jun 30, 2024 |
| Market Cap ($M) | 1,487 | 988 | 898 | 747 | 606 | 365 | 402 | 315 | 404 |
| Enterprise Value ($M) | 1,643 | 1,145 | 1,060 | 921 | 783 | 564 | 615 | 534 | 633 |
| Price to Earnings Ratio (P/E) | 61.16 | 46.16 | 35.36 | 28.69 | 26.70 | 26.17 | 33.72 | 36.52 | 87.86 |
| Price/Earnings-to-Growth Ratio (PEG) | — | — | 10.64 | — | 5.23 | 2.96 | — | — | — |
| Price to Sales Ratio (P/S) | 2.65 | 7.11 | 6.26 | 5.38 | 4.34 | 2.75 | 3.29 | 2.51 | 2.97 |
| Price to Book Ratio (P/B) | 4.78 | 3.23 | 2.98 | 2.54 | 2.10 | 1.34 | 1.52 | 1.15 | 1.52 |
| Price to Free Cash Flow Ratio (P/FCF) | 36.41 | 246.60 | 76.99 | 268.74 | 27.08 | 28.35 | 41.81 | 29.96 | 69.15 |
| Enterprise Value to Sales (EV/Sales) | — | 8.24 | 7.39 | 6.64 | 5.61 | 4.25 | 5.04 | 4.26 | 4.65 |
| Enterprise Value to EBITDA (EV/EBITDA) | 20.78 | 73.62 | 51.85 | 42.00 | 36.95 | 39.23 | 45.19 | 42.38 | 56.24 |
| Debt to Equity Ratio | 1.98 | 0.65 | 0.67 | 0.73 | 0.78 | 0.91 | 0.94 | 0.94 | 0.98 |
📰 Market News & Coverage
15 Stories AvailableReal-time institutional reporting and market updates for ALNT.
Analyzing CPS Technologies (NASDAQ:CPSH) & Allient (NASDAQ:ALNT)
CPS Technologies (NASDAQ: CPSH - Get Free Report) and Allient (NASDAQ: ALNT - Get Free Report) are both small-cap computer and technology companies, but which is the superior stock? We will contrast the two businesses based on the strength of their analyst recommendations, earnings, institutional ownership, risk, valuation, dividends and profitability. Insider and Institutional Ownership 11.2% of
Comparing Allient (NASDAQ:ALNT) & nVent Electric (NYSE:NVT)
nVent Electric (NYSE: NVT - Get Free Report) and Allient (NASDAQ: ALNT - Get Free Report) are both computer and technology companies, but which is the superior business? We will compare the two companies based on the strength of their analyst recommendations, risk, profitability, dividends, valuation, institutional ownership and earnings. Earnings and Valuation This table compares nVent

Allient Inc. Announces Second Quarter Fiscal Year 2026 Financial Results Conference Call and Webcast
BUFFALO, N.Y.--(BUSINESS WIRE)--Allient Inc. (Nasdaq: ALNT) Announces Second Quarter Fiscal Year 2026 Financial Results Conference Call and Webcast.
Allient Inc (ALNT) Stock Up 6.1% but GF Value Says Overvalued -- GF Score: 80/100
On May 29, 2026, Allient Inc (ALNT) shares rose 6.1%, bringing the current price to $79.17. The stock has seen significant price performance, with a 52-week ran
Do Options Traders Know Something About Allient Stock We Don't?
Investors need to pay close attention to ALNT stock based on the movements in the options market lately.
Allient Inc.: Recovery Is Still Not Clean Enough
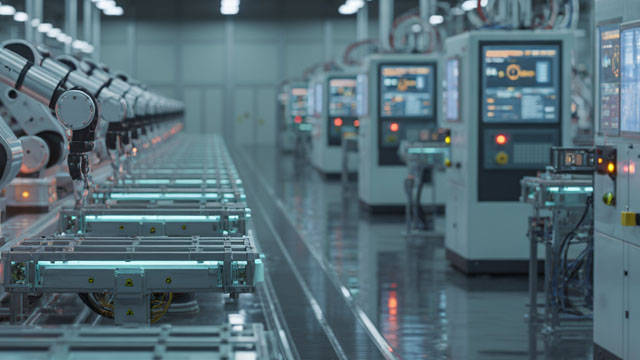
Allient Inc. remains hold-rated as improved orders and backlog have not yet translated into robust organic growth or margin expansion. Q1 2026 showed 4.6% revenue growth and stronger industrial/data center demand, but organic growth was only 0.8% and adj. EBITDA margin declined to 12.4%. Vehicle segment recovery is selective, with a shift to higher-margin applications, but broad segment strength remains unproven, and margin conversion is unclear.

Allient Inc. Elects Alex Collichio as Vice President
BUFFALO, N.Y.--(BUSINESS WIRE)--Allient Inc. (Nasdaq: ALNT) Elects Alex Collichio as Vice President.

Allient Inc. (ALNT) Q1 2026 Earnings Call Transcript
Allient Inc. (ALNT) Q1 2026 Earnings Call Transcript

Allient (ALNT) Q1 Earnings and Revenues Miss Estimates
Allient (ALNT) came out with quarterly earnings of $0.5 per share, missing the Zacks Consensus Estimate of $0.55 per share. This compares to earnings of $0.46 per share a year ago.

Allient Reports Revenue Growth, Margin Expansion and Strong Bookings for First Quarter 2026
BUFFALO, N.Y.--(BUSINESS WIRE)--Allient Inc. (Nasdaq: ALNT) Reports Revenue Growth, Margin Expansion and Strong Bookings for First Quarter 2026.

Allient Increases Quarterly Cash Dividend 33% to 0.04 per Share
BUFFALO, N.Y.--(BUSINESS WIRE)--Allient Inc. (Nasdaq: ALNT) Increases Quarterly Cash Dividend 33% to 0.04 per Share.

Allient Inc. Announces First Quarter Fiscal Year 2026 Financial Results Conference Call and Webcast
BUFFALO, N.Y.--(BUSINESS WIRE)--Allient Inc. (Nasdaq: ALNT) Announces First Quarter Fiscal Year 2026 Financial Results Conference Call and Webcast.

These Power Equipment Stocks Surge To New Highs
Power equipment stocks have risen sharply this year and hit new highs. These names broke out of bases and have outperformed 96% of stocks.
JPMorgan Chase & Co. Cuts Stock Position in Allient Inc. $ALNT
JPMorgan Chase and Co. lessened its stake in Allient Inc. (NASDAQ: ALNT) by 20.2% in the undefined quarter, according to the company in its most recent filing with the SEC. The institutional investor owned 39,616 shares of the company's stock after selling 10,056 shares during the quarter. JPMorgan Chase and Co. owned approximately
Allient (NASDAQ:ALNT) and Alps Electric (OTCMKTS:APELY) Head to Head Survey
Alps Electric (OTCMKTS:APELY - Get Free Report) and Allient (NASDAQ: ALNT - Get Free Report) are both computer and technology companies, but which is the better stock? We will compare the two businesses based on the strength of their analyst recommendations, valuation, earnings, dividends, institutional ownership, risk and profitability. Dividends Alps Electric pays an annual dividend
Related Companies in Industrials

ICF INTERNATIONAL INC (ICFI)
Industrials
$1.46B
Mkt Cap

TARGET HOSPITALITY CORP (TH)
Industrials
$1.51B
Mkt Cap

VOYAGER TECHNOLOGIES INC CLASS A (VOYG)
Industrials
$1.45B
Mkt Cap

GREENBRIER INC (GBX)
Industrials
$1.52B
Mkt Cap
ENERGIZER HOLDINGS INC (ENR)
Industrials
$1.44B
Mkt Cap
TENNANT (TNC)
Industrials
$1.43B
Mkt Cap
📊 AI Financial Analysis
Powered by StockMarketInfo"ALN Tech (ALNT) reported Q1 2026 revenue of $138.9M and net income of $5.36M (EPS $0.32). Revenue increased slightly QoQ (+2.4% vs. 2025-12-31) and rose modestly YoY (+4.7% vs. 2025-03-31). Net income improved sharply QoQ (+18.1% vs. 2025-12-31) and more than 50% YoY (+50.5% vs. 2025-03-31). Profitability strengthened: gross margin expanded to ~32.7% (up from ~30.2% in Q4 and ~32.2% in Q1 last year), and net margin rose to 3.86% (vs. 4.45% in Q4 and 2.68% in Q1 last year). Operating and EBITDA profitability remain positive, but the operating margin was lower than Q3/Q4 levels, signaling some cost pressure or mix shift. Cash flow quality is mixed quarter-to-quarter. Operating cash flow was $6.17M and free cash flow $4.01M in Q1 2026, down sharply from Q4’s elevated operating cash generation. The balance sheet remains resilient with $41.2M cash, $577.7M total assets, and $305.9M equity; net debt was ~$151.3M, improving from $199.2M a year ago. Total shareholder returns look very strong: the stock’s 1-year change is +251.8% (momentum >20%), and current dividend yield is ~0.05% with no meaningful buyback activity reported in the quarter. Analyst price target consensus (~$77) is below the current price ($74.4), implying limited upside versus strong momentum."
Revenue Growth
Q1 2026 revenue of $138.9M grew +2.4% QoQ (vs. $143.4M in Q4 2025) and +4.7% YoY (vs. $132.8M in Q1 2025). Growth is steady but not accelerating.
Profitability
Net income $5.36M: +18.1% QoQ and +50.5% YoY. Net margin improved vs. Q1’25 (3.86% vs. 2.68%) and gross margin improved vs. Q4’25 (~32.7% vs. ~30.2%). Operating margin softened vs. Q3/Q4 but remains above Q1’25.
Cash Flow Quality
Q1 2026 operating cash flow was $6.17M and free cash flow $4.01M, down materially from Q4’25 (operating CF $13.6M; FCF $43.8M). Dividend paid was $0 this quarter; buybacks were not reported.
Leverage & Balance Sheet
Total assets were $577.7M and equity $305.9M, relatively stable QoQ and up YoY. Net debt improved to ~$151.3M from ~$199.2M a year ago, indicating better leverage resilience.
Shareholder Returns
Total return momentum is exceptional: price is up +251.8% over 1 year (>20% threshold). Dividend yield is very small (~0.05%), and no buybacks were reported this quarter, so gains are primarily price-driven.
Analyst Sentiment & Valuation
Consensus price target (~$77) is modestly above current price ($74.4), while valuation metrics show high P/E (~46). Given the strong stock run-up, near-term valuation risk is elevated.
Disclaimer:This analysis is AI-generated for informational purposes only. Accuracy is not guaranteed and this does not constitute financial advice.
Fundamentals Overview
ALNT delivered Q1 2026 momentum with orders up 15% YoY (book-to-bill 1.14x) and revenue up 5% to $138.9M, driven by Industrial automation/power quality for data centers (+8% YoY) and Vehicle (+7%). Profitability improved structurally: gross margin expanded 50 bps to 32.7% and operating margin gained 10 bps despite elevated SG&A (+120 bps) tied to growth-related commissions and cloud/IT costs. Net income jumped 51% with a 21% effective tax rate. The main drag is near-term execution: Dothan transition and realignment costs are still elevated, with $2M–$3M expected in 2026 and benefits expected to show more in 2H (potentially better by end of Q3). Management also flagged tariff uncertainty (IEEPA refunds possible but unquantified; incremental tariffs expected to expire in July). Overall tone is constructive (especially defense replenishment and data center conversions), but investors should track transition cost timing and tariff pass-through risk.
 Growth Catalysts
- Industrial automation and power quality solutions tied to data center infrastructure (Industrial revenue +8% YoY; bookings strength emphasized as margin-accetive)
- Commercial automotive carryover supporting Vehicle orders (Vehicle revenue +7% in quarter; strength in Q1 orders led by Vehicle)
- Defense replenishment/munitions demand driving higher bookings and improved April momentum (A&D bookings characterized as strengthening and ongoing)
- STAN initiatives improving product/portfolio quality via higher-value engineered systems and platform solutions (shift away from commoditized programs)
Business Development
- OEM solutions partnership emphasis: deepening role as solutions partner via higher-value engineered systems/platforms for defense and medical (named none in transcript)
- Oshkosh technology acquisition leveraged for data-center delivery capacity; production capability in Mexico referenced
- Milwaukee facility expansion referenced to meet rising data center/power quality demand
Financial Highlights
- Revenue increased 5% to $138.9M (constant currency +1%); FX favorable impact $5.1M
- Orders $158.1M (+15% YoY, +9% sequential) with book-to-bill 1.14x
- Gross margin expanded 50 bps YoY to 32.7% (gross profit $45.4M), attributed to volume, improved mix, and Simplify to Accelerate NOW (STAN) operational benefits
- Operating income $9.3M (6.7% of revenue); operating margin expanded 10 bps YoY
- SG&A 16.1% of sales, up 120 bps YoY (driven by higher commissions/incentives, trade show/commercial activity, and elevated IT/cloud subscription and infrastructure costs)
- Net income +51% to $5.4M, $0.32 diluted EPS; adjusted net income $8.4M ($0.50 adjusted EPS) vs $0.46 prior year period
- Adjusted EBITDA $17.3M (12.4% of revenue), slightly below prior period due to elevated SG&A despite improving underlying margin structure
- Effective tax rate 21%; full-year tax rate expected 21%–23%
- Tariff/trade policy headwinds: evaluating eligibility to recover previously paid IEEPA-related tariffs after Supreme Court ruling (refund amount/timing uncertain); incremental tariffs expected to expire in July unless extended/replaced
Capital Funding
- Cash and cash equivalents: $41.2M at March 31, 2026
- Total debt: $177.3M; net debt: $136.1M (net debt declined; leverage ratio improved to 1.78x based on net debt / trailing 12-month adjusted EBITDA)
- Bank leverage ratio under credit agreement: 2.24x, comfortably within covenants
- Unused capacity under revolving credit facility: $158M
- Dividend increased (amount not provided in transcript)
- CapEx: $2.2M in quarter; full-year 2026 CapEx guidance $12M–$15M
Strategy & Ops
- STAN operational program: consolidating overlapping operations, focusing resources where scale/advantage exist, lean disciplines embedded into manufacturing and supply chain
- Dothan transition described as near-term cost headwind; management expects incremental investments $2M–$3M for full-year 2026
- Intelligent controls product initiative: shifting from project-based one-time revenue to scalable, market-facing products (near-term revenue/profitability reduction expected)
- Defense motor/controls development acceleration: compressing timeline into months; leveraging expertise from a newer acquisition plus existing scalable production units
- Vehicle strategy: avoiding low-margin commercial automotive projects with little value beyond price due to high upfront CapEx and long design-in cycle; emphasis on higher-margin/custom actuator applications
- Working capital: inventory modestly higher QoQ while targeting inventory discipline; DSO roughly 61 days vs ~57 days for full-year 2025
Market Outlook
- Orders/backlog support constructive view through balance of 2026; backlog $251M at quarter end with majority expected to convert to revenue in 3–5 months (Q&A corrected to 3–6 months)
- No formal forward earnings guidance given in transcript; management states April orders started “extremely strong” and Q2 momentum appears positive
Risks & Headwinds
- Dothan transition and realignment costs remain elevated (expected $2M–$3M incremental 2026 investment; optimization benefits expected to start in 2H and be better by end of Q3)
- Tariff policy uncertainty: evaluating IEEPA refunds post-Supreme Court; refund eligibility/amount/timing uncertain
- Incremental tariffs expected to expire in July unless extended/replaced; margin pressure possible if measures persist
- SG&A elevated YoY (up 120 bps) due to commissions/incentives, trade/commercial activity, and IT/cloud infrastructure costs
- Defense backlog/booking mechanics: bookings may be lower vs prior approach when demand is forecasted but firm production schedules are not yet secured (could limit near-term bookings visibility)
Q&A: Analyst Interest
- Data centers / power quality opportunity: Management linked accelerating data-center dollars to stronger Q1 bookings and expects continued conversion into orders/backlog. They cited capacity investments—acquisition with Mexico production capability in Oshkosh and Milwaukee expansion—and suggested retrofit could still drive demand if upgrades target throughput/performance improvements using their equipment.
- Dothan transition cost trajectory: Management quantified expected incremental investments of $2M–$3M across 2026 and indicated second-half concentration, with stabilization progress and improvements expected to become more apparent in 2H. They referenced requalification/customer support complexity and higher mix business as drivers of transition uncertainty.
- Defense momentum (including drones) and booking mechanics: Management confirmed replenishment demand is real and progressing, with April starting extremely strong. They highlighted positioning for U.S.-made defense applications and interest in high-end drone propulsion. They also explained bookings are recognized only with firm production schedules, meaning prior-quarter comparisons may understate demand when forecasts are booked earlier.
Sentiment: MIXED
Note: This summary was synthesized by AI from the ALNT Quarter and Year earnings transcript. Financial data is complex; please verify all metrics against official SEC filings before making investment decisions.
📋 Official Regulatory 10-K / 10-Q SEC Filings
Direct authenticated documentation links to audited SEC database reports for ALNT.