Advanced Micro Devices, Inc.

Advanced Micro Devices, Inc. (AMD) Market Cap

Advanced Micro Devices, Inc. has a market capitalization of $760.48B.

Price: $466.38

-56.82 (-10.86%)

Market Cap: 760.48B

NASDAQ · time unavailable

CEO: Lisa T. Su

Sector: Technology

Industry: Semiconductors

IPO Date: 1972-09-07

Website: https://www.amd.com

Advanced Micro Devices, Inc. (AMD) - Company Information

Market Cap: 760.48B|Sector: Technology

Company Profile

Advanced Micro Devices, Inc. operates as a semiconductor company worldwide. The company operates in two segments, Computing and Graphics; and Enterprise, Embedded and Semi-Custom. Its products include x86 microprocessors as an accelerated processing unit, chipsets, discrete and integrated graphics processing units (GPUs), data center and professional GPUs, and development services; and server and embedded processors, and semi-custom System-on-Chip (SoC) products, development services, and technology for game consoles. The company provides processors for desktop and notebook personal computers under the AMD Ryzen, AMD Ryzen PRO, Ryzen Threadripper, Ryzen Threadripper PRO, AMD Athlon, AMD Athlon PRO, AMD FX, AMD A-Series, and AMD PRO A-Series processors brands; discrete GPUs for desktop and notebook PCs under the AMD Radeon graphics, AMD Embedded Radeon graphics brands; and professional graphics products under the AMD Radeon Pro and AMD FirePro graphics brands. It also offers Radeon Instinct, Radeon PRO V-series, and AMD Instinct accelerators for servers; chipsets under the AMD trademark; microprocessors for servers under the AMD EPYC; embedded processor solutions under the AMD Athlon, AMD Geode, AMD Ryzen, AMD EPYC, AMD R-Series, and G-Series processors brands; and customer-specific solutions based on AMD CPU, GPU, and multi-media technologies, as well as semi-custom SoC products. It serves original equipment manufacturers, public cloud service providers, original design manufacturers, system integrators, independent distributors, online retailers, and add-in-board manufacturers through its direct sales force, independent distributors, and sales representatives. The company was incorporated in 1969 and is headquartered in Santa Clara, California.

Analyst Sentiment

78%
Strong Buy

From 51 Active Polls

1Y Forecast: $449.64

▼ -3.6% Potential Upside

Consensus Target Metrics

Low Bound

$260

Median

$450

High Bound

$665

Average

$450

Price & Moving Averages

Loading chart...

🎯 Wall Street Analyst Intelligence Report

1-Year structural target targets, chart projections, and sentiment maps.

Average 1Y Target
$449.64
▼ -3.59% Upside
Low Target
$260.00
-44% Risk
Median Target
$450.00
-4% Mid
High Target
$665.00
43% Max
Consensus
Buy
49 / 70 Buys

Consensus Trend Projection

Trailing closures vs. 12-month metrics map.

Analyst Vote Distribution

Aggregate institutional coverage sentiment weights.

📊 Historical Valuation Multiples

Real-time Trailing Twelve Month (TTM) momentum side-by-side with discrete quarterly metrics.

Fiscal QuarterTTMQ1 2026Q4 2025Q3 2025Q2 2025Q1 2025Q4 2024Q3 2024Q2 2024
Period EndingTrailing 12MMar 28, 2026Dec 27, 2025Sep 27, 2025Jun 28, 2025Mar 29, 2025Dec 28, 2024Sep 28, 2024Jun 29, 2024
Market Cap ($M)760,479329,446350,434259,282233,404167,216203,183266,247262,456
Enterprise Value ($M)758,765327,732349,367258,344232,848165,898201,608264,588260,588
Price to Earnings Ratio (P/E)151.8659.5557.9852.1566.9258.96105.3986.33247.60
Price/Earnings-to-Growth Ratio (PEG)5.242.5720.158.575.1237.43
Price to Sales Ratio (P/S)20.3032.1334.1228.0430.3722.4826.5339.0444.98
Price to Book Ratio (P/B)11.805.115.564.273.912.893.534.674.64
Price to Free Cash Flow Ratio (P/FCF)88.70128.39147.36136.39134.99230.01186.24536.79597.85
Enterprise Value to Sales (EV/Sales)31.9634.0227.9430.3022.3026.3338.8044.66
Enterprise Value to EBITDA (EV/EBITDA)93.84136.67122.11122.67322.95104.54119.01165.57238.42
Debt to Equity Ratio-0.210.060.070.060.070.080.040.040.04

AMD Growth Runway Model

Standard long term linear growth fade

Multi-Stage Discounted Cash Flow Sandbox

Market Price$466.38
Intrinsic Value$416.97
Market Alignment
Overvalued by 10.6%relative to calculated intrinsic value
9.00%
Exp: 22%22%
i

Growth runway slowdown

This value provides a time window for the growth rate to decline beyond Stage 1 toward the terminal rate. Longer windows are most useful for companies with high growth starting conditions or strong competitive advantages. This option stretches out the growth rate slowdown across 5, 10, or 15-year steps. A high-growth starting condition (exceeding a 25% initial growth rate) automatically applies a curve decay to simulate realistic, rapid market saturation.
i

Terminal growth rate

With long-term inflation between 3-5%, revenue must grow by that baseline to maintain flat real-world market share. This value sets the permanent terminal growth rate to factor into the valuation beyond the growth slowdown runway toward maturity.

3-Stage Financial Runway Horizon

🧠 Perpetuity Horizon Engine (Stage 3: Post-2035)

Terminal FCF Base$21.08B
Perpetuity TV Value$396.77B
Discounted TV (PV)$167.60B
TV Weighting %67.8%
⚠️
Financial Model Disclaimer & Risk Disclosure: This interactive scenario simulator is an educational sandbox provided strictly for informational and analytical research purposes. Core historical financial statements and consensus estimates are sourced directly via Financial Modeling Prep (FMP). All downstream outputs are entirely deterministic, hypothetical projections generated by combining automated mathematical formulas (including linear interpolation and Gaussian bell-curve decay models) with user-selected variables and third-party financial data inputs. Users assume all liability for trading decisions executed based on these sandbox calculations.

📘 Full Research Report

ℹ️

AI-Generated Research: This report is for informational purposes only.

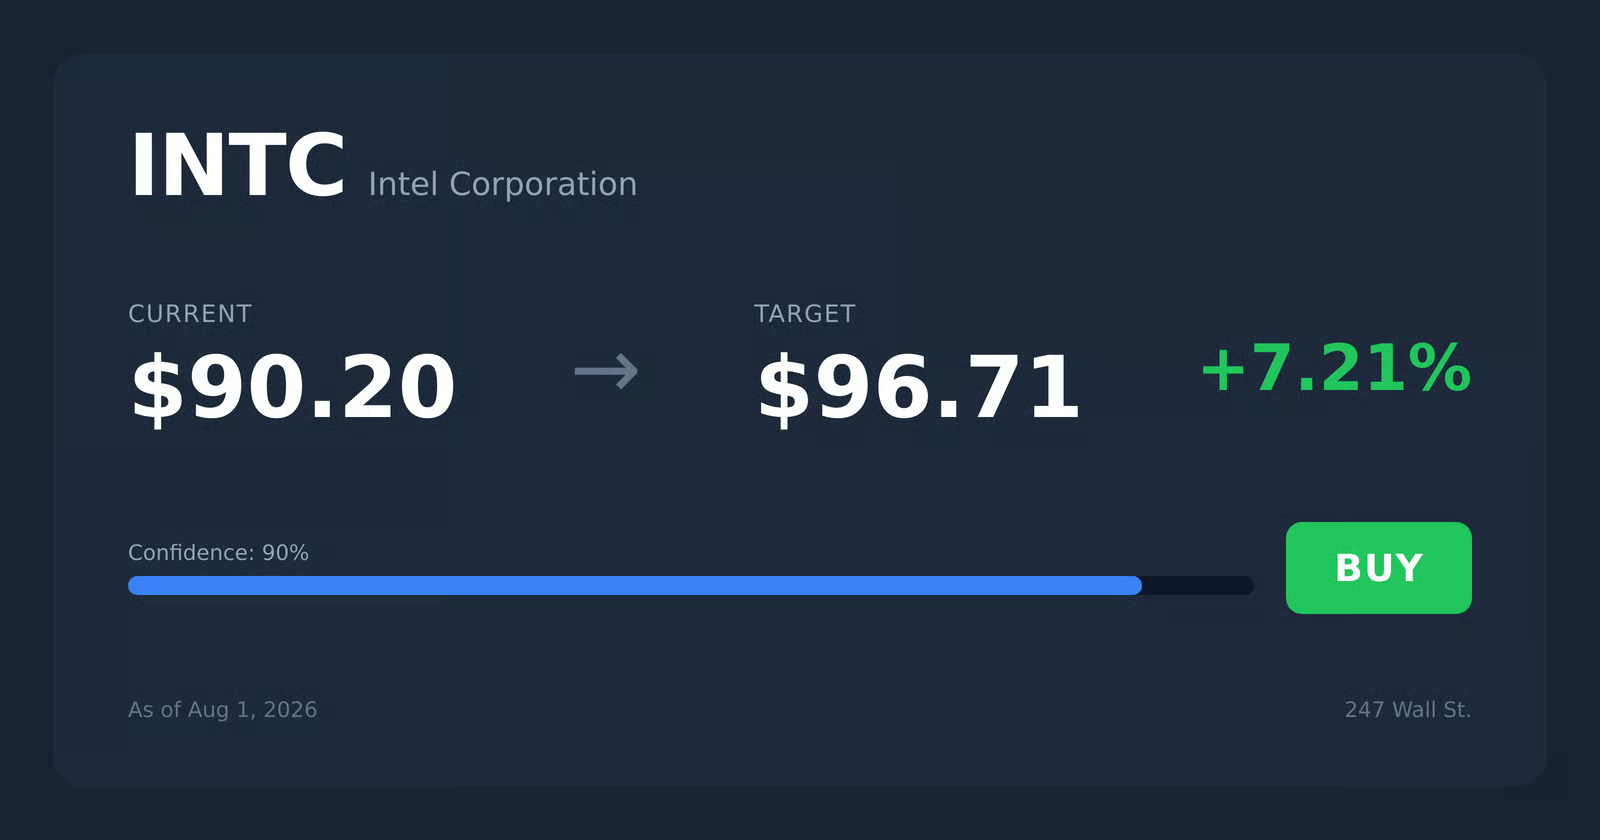
📘 ADVANCED MICRO DEVICES INC (AMD) — Investment Overview

🧩 Business Model Overview

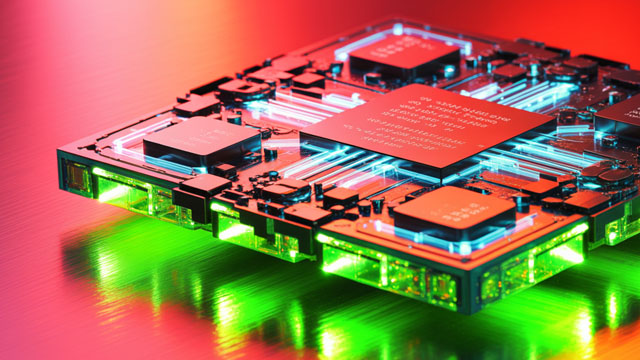
AMD designs high-performance computing (HPC) and data center processors, client CPUs, and (through its Xilinx acquisition) programmable logic and adaptive compute platforms (including FPGA-based acceleration). The business model is primarily “design-to-silicon” rather than fabrication: AMD creates the architecture, systems-level platform, and software-enablement stack, then relies on outsourced manufacturing and packaging ecosystems to produce chips.

Customer adoption is driven by system-level value: performance-per-watt, memory and I/O bandwidth characteristics, platform features (security, virtualization, networking interfaces), and the quality of software enablement (compilers, drivers, libraries, and OEM/server validation). Once design wins occur at the server, workstation, or embedded-system level, switching away from an established platform tends to be slow due to validation cycles and broader ecosystem integration.

💰 Revenue Streams & Monetisation Model

AMD monetises primarily through the sale of semiconductors (CPUs, GPUs, and programmable logic) to hyperscalers, OEMs, ODMs, channel partners, and embedded system customers. Revenue is largely transactional (unit sales) but exhibits durability when platform adoption creates follow-on refresh cycles in subsequent device generations.

Margin drivers typically include:

  • Product mix: higher-value compute components (especially where performance-per-watt leadership supports premium positioning) generally yield better gross margin than commodity-like segments.
  • Process and platform execution: advanced-node utilization, yield, packaging integration, and die/wafer economics affect cost of goods sold.
  • Software and systems enablement: strong platform enablement reduces customer “time-to-value,” supporting design wins and sustaining platform pricing/mix.
  • Programmable logic and acceleration content: recurring relevance in infrastructure acceleration workloads can support more stable demand patterns than pure CPU-only exposures.

🧠 Competitive Advantages & Market Positioning

AMD’s moat is best characterised as a blend of switching costs and ecosystem lock-in, reinforced by cost and performance advantages delivered through differentiated architecture and systems design.

  • Switching costs (platform validation and software enablement): After server and OEM designs incorporate an AMD platform, customers face validation, tooling, firmware, driver, and operational integration work. This creates friction against rapid platform swaps.
  • Ecosystem lock-in (software toolchain + OEM/server validation): AMD’s competitiveness depends not only on silicon but on the maturity of compilers, libraries, virtualization support, and partner ecosystem certification. This strengthens adoption durability for developers and enterprises.
  • Cost/performance delivery: Architectural efficiency and performance-per-watt positioning can improve total cost of ownership for data center buyers by reducing power and cooling requirements at the same workload throughput.

Competitive benchmarking:

  • Intel: Intel is the dominant incumbent in general-purpose compute CPUs, often competing on platform continuity and manufacturing scale. AMD’s differentiation centers on stronger compute-per-watt, faster architecture iteration cadence, and broader heterogeneous compute offerings (CPU + programmable acceleration).
  • NVIDIA: NVIDIA leads discrete GPUs and accelerators tied closely to CUDA-centric software ecosystems. AMD’s focus is on providing alternative acceleration and platform compute paths—particularly in data center systems where customers seek multiple sourcing and workload-appropriate price/performance tradeoffs.
  • Qualcomm: Qualcomm dominates mobile and edge compute. AMD’s competitive focus is not mobile-first; it targets servers, client/workstations, and embedded acceleration where performance-per-watt and software enablement matter more than mobile integration dominance.

🚀 Multi-Year Growth Drivers

  • Heterogeneous compute expansion: Growth in workloads that benefit from acceleration (data analytics, networking, security, storage acceleration, and AI-adjacent inference/training components) supports demand for CPUs plus programmable logic and specialized acceleration paths.
  • Server refresh cycles and platform mix shift: Data center modernization and infrastructure efficiency targets favor architectures delivering higher throughput per watt and improved total system efficiency—areas where competitive differentiation can translate into design wins.
  • Multi-sourcing and supply chain diversification: Hyperscalers and large enterprises increasingly treat vendor concentration as a material risk, creating structural willingness to qualify alternative platforms over multi-year horizons.
  • Software enablement as a compounding asset: Better tooling and platform maturity can reduce friction for developers and IT teams, supporting longer-lived customer relationships and increasing the likelihood of follow-on deployments across generations.
  • TAM expansion across cloud, enterprise, and embedded infrastructure: AI workload distribution across CPU/GPU/accelerator layers broadens the addressable compute stack beyond traditional CPU-only upgrades.

⚠ Risk Factors to Monitor

  • Execution and competitive intensity: Semi-competitive markets can change quickly through architectural leaps and software ecosystem advantages; failure to sustain performance-per-watt, reliability, or roadmap credibility can slow design wins.
  • Manufacturing dependency and supply-chain constraints: Reliance on outsourced manufacturing and advanced packaging requires operational discipline; yield, capacity allocation, and packaging execution can impact product ramp and margins.
  • Customer concentration and purchasing cyclicality: Large customer procurement cycles and broader semiconductor demand cyclicality can pressure unit volumes and mix.
  • Export controls and geopolitical constraints: Regulations affecting compute exports and end-market eligibility can constrain addressable demand and alter product qualification pathways.
  • Platform transition risk: Migration between architectures, node generations, or accelerator strategies can introduce timing mismatches between product readiness and customer roadmap alignment.

📊 Valuation & Market View

The market typically prices AMD within semiconductor frameworks that emphasize growth durability, gross margin trajectory, and credible platform leadership. Valuation often reflects:

  • Multiple sensitivity to gross margin and operating leverage: Higher-quality product mix and improving cost structure tend to expand valuation, while mix headwinds compress it.
  • Re-rating tied to design-win momentum: Evidence of sustained platform adoption by OEMs and hyperscalers can shift investor expectations for multi-year revenue mix.
  • AI/accelerated compute narrative impact: Investors commonly connect valuation to the company’s ability to deliver competitive compute alternatives and integrate acceleration into mainstream server platforms.

In practice, valuation is less anchored to a single ratio and more driven by whether the market perceives AMD as sustaining profitable share gains and converting roadmap investment into recurring platform adoption.

🔍 Investment Takeaway

AMD’s long-term investment case rests on a structural advantage set anchored by switching costs and ecosystem lock-in from platform validation and software enablement, strengthened by cost/performance delivery across CPU and accelerated-compute workloads. The key question across a multi-year horizon is execution: whether AMD can sustain roadmap alignment, manufacturing and packaging effectiveness, and customer qualification momentum in a highly competitive landscape.


⚠ AI-generated — informational only. Validate using filings before investing.

📰 Market News & Coverage

15 Stories Available

Real-time institutional reporting and market updates for AMD.

fool.com2026-06-06

AI Chip Stocks Sold Off This Week. Is AMD a Buying Opportunity or a Falling Knife?

The chipmaker's business is firing on all cylinders, but the recent pullback raises a familiar question for investors.

247wallst.com2026-06-06

SpaceX IPO Could Create More Wealth Than All IPOs in the Last 20 Years Combined. Here's Why Early Investors Are Banking On It

On a recent Earn Your Leisure segment, co-host Rashaad Bilal quoted investor Barry Atlas with a claim that stops you mid-scroll: “these companies are going to make more money than all of the IPOs in the last 20 years put together,” creating “a whole new class of billionaires” from just a handful of listings.

fool.com2026-06-06

Did Nvidia Just Say Checkmate to AMD and Intel?

Nvidia spotted a new multibillion-dollar market.

investors.com2026-06-05

Stock Market Hit Hard As Jobs Report Fuels Rate-Hike Fears; AMD, Intel Lead Chips Sell-Off

The stock market took a turn for the worse Friday as a sell-off in chip stocks weighed on the Nasdaq despite a good jobs report.

zacks.com2026-06-05

Why TSMC Is a Better AI Stock to Hold Right Now Than Broadcom

TSM is outperforming peers as rising AI demand, a higher 2026 outlook and capacity expansion support growth despite a broader chip-sector pullback.

fool.com2026-06-05

Market Indexes Tumble at Midday as Treasury Yields Spike on Hot Employment Report

The Nasdaq dropped nearly 3% after a stronger-than-expected hiring report. Strong employment data has traders bracing for a Fed rate hike.

invezz.com2026-06-05

Intel, AMD stocks slide again in aftermath of Broadcom's weak outlook

Shares of Intel Corp. and Advanced Micro Devices extended their declines on Friday as a sharp selloff across semiconductor stocks gathered pace, with investors continuing to react to Broadcom's weaker-than-expected artificial intelligence outlook. The broad-based retreat came after Broadcom's fiscal second-quarter earnings report, which beat headline expectations but failed to meet the market's lofty hopes for AI-related growth.

247wallst.com2026-06-05

The Chip ETF That Turned a $10k Bet Into Nearly $20k This Year

If you put $10,000 into Invesco PHLX Semiconductor ETF (NASDAQ:SOXQ) on the last trading day of 2025, you are sitting on about $19,400 this morning.

fool.com2026-06-05

Stock Market Today, June 5: Strong Jobs Data Drives Broad Sell-Off at Midday

AI chip leaders face renewed scrutiny as hot jobs data and rate hike fears jolt U.S. growth stocks, today, June 5, 2026.

247wallst.com2026-06-05

Good News for NVIDIA, Amazon, and Micron Investors: New Research Shows Trillion-Dollar Stocks May 10X

The All-In podcast (hosts Chamath Palihapitiya, Jason Calacanis, David Sacks, and David Friedberg) recently hosted Coatue's Thomas Laffont, surfacing an idea they called the “10X paradox.

247wallst.com2026-06-05

Micron, SanDisk, and Marvell Plummet as “Parabolic 7” Trade Unwinds

Shares of three of the most explosive semiconductor names of 2026 are sliding hard in Friday morning trading.

zacks.com2026-06-05

Advanced Micro Devices, Inc. (AMD) is Attracting Investor Attention: Here is What You Should Know

Advanced Micro (AMD) has been one of the stocks most watched by Zacks.com users lately. So, it is worth exploring what lies ahead for the stock.

barrons.com2026-06-05

AMD, Broadcom, Quantinuum, and More Stocks That Explain Today's Market

Investors are slamming the brakes on the AI rally, dragging down shares in Broadcom, AMD, and Nvidia.

seekingalpha.com2026-06-05

Buy The Chip Dip: 3 Top Semiconductor Stocks

The tech sector's blistering run came to a halt on Wednesday as renewed strikes in Iran and a sour response to Broadcom's earnings weighed on sentiment. Despite a stellar Q2 with record revenue and margins, Broadcom sank 15% Thursday, dragging chip stocks lower. This long-awaited rotation presents an opportunity for semiconductor names that pair strong forward earnings growth with durable profitability.

investopedia.com2026-06-04

Markets Rally, But Tech Stocks Get Left Behind as the AI Trade Falters

Could the AI trade be starting to lose its edge—or is it just primed for a break?

📊 AI Financial Analysis

Powered by StockMarketInfo
Earnings Data: Q Ending 2026-03-28

"AMD reported Q1 2026 revenue of $10.253B and net income of $1.383B (EPS $0.85). Revenue rose +0.93% QoQ ($10.27B in Q4’25 to $10.253B in Q1’26) and +37.8% YoY versus $7.438B in Q1’25. Net income declined -8.5% QoQ ($1.511B in Q4’25 to $1.383B) but increased +94.9% YoY versus $0.709B in Q1’25. Profitability improved on a year-over-year basis: gross margin was 52.8% in Q1’26 vs 50.2% in Q1’25, while net margin was 13.5% vs 9.5% (margin expansion). However, margins contracted sequentially: gross margin fell from 54.3% in Q4’25, and net margin also eased (14.7% to 13.5%), consistent with the QoQ net income decline. Cash flow quality remains strong. Operating cash flow was $2.955B and free cash flow was $2.566B, up meaningfully from Q1’25 (FCF $0.727B). The balance sheet is resilient with $12.347B cash & short-term investments against $3.871B total debt, keeping net debt negative (~-$1.714B). AMD returned capital via buybacks (repurchased $221M in Q1’26; dividends are $0). Total shareholder returns look highly favorable given price momentum: the stock is up +215.3% over 1 year, which should materially boost total return (price appreciation dominates yield). Valuation appears demanding (e.g., high P/E and P/FCF implied by the provided ratio set), aligning with optimistic growth expectations."

Revenue Growth

Strong

Revenue +37.8% YoY in Q1’26, while essentially flat sequentially (+0.9% QoQ vs Q4’25). Strong annual growth despite a softer quarter-over-quarter trend.

Profitability

Good

Net margin expanded YoY (13.5% vs 9.5%) and gross margin improved (52.8% vs 50.2%). Sequentially, margins contracted (gross margin 54.3%→52.8%; net margin 14.7%→13.5%), driving -8.5% QoQ net income.

Cash Flow Quality

Strong

Operating cash flow $2.955B and free cash flow $2.566B in Q1’26, both well above Q1’25 (FCF $0.727B). No dividends; buybacks continue, supported by strong profitability and cash generation.

Leverage & Balance Sheet

Strong

Net debt remains negative (net debt ~-$1.714B) with substantial liquidity (cash & ST investments $12.347B) vs total debt $3.871B. Equity has grown over the period (Q4’25 $62.999B → Q1’26 $64.462B).

Shareholder Returns

Excellent

1-year price momentum is very strong (+215.3%), indicating dominant capital appreciation. Buybacks of ~$221M in the quarter support shareholder returns; dividend yield is 0.

Analyst Sentiment & Valuation

Positive

Provided targets suggest some upside (consensus target $316 vs price $278.39), but valuation multiples appear elevated (high P/E/P/FCF in the ratio set), implying execution risk if growth/margins soften.

Disclaimer:This analysis is AI-generated for informational purposes only. Accuracy is not guaranteed and this does not constitute financial advice.

Fundamentals Overview

Loading fundamentals overview...

AMD’s Q1 2026 shows a structural shift toward data center as the primary growth engine: revenue rose 38% YoY to $10.3B and EPS jumped 43% YoY to $1.37, with gross margin up 170 bps to 55% and free cash flow tripling to a record $2.6B. The company tied the acceleration to AI infrastructure demand pulling CPU compute needs for inferencing and Agentic orchestration, with EPYC Turin ramp and continued strength in prior EPYC generations driving server growth. Management further raised the server CPU TAM outlook to >$120B by 2030 (>35% CAGR) and guided Q2 revenue to ~$11.2B (+46% YoY midpoint), including server CPU growth of >70% YoY. Risks remain concentrated in supply chain/data center build-out constraints and gross margin dilution expectations as MI450 ramps (below corporate average), though management expects offsets from server and client mix. Named catalysts include Meta’s up-to-6GW Instinct GPU deployment and ongoing OpenAI co-engineering.

AI IconGrowth Catalysts

  • Data center revenue up 57% YoY to $5.8B driven by EPYC CPUs and Instinct GPUs; server CPU ramp tied to 5th-gen EPYC Turin and continued strength of 4th-gen EPYC
  • EPYC-powered cloud instances up nearly 50% YoY to 1,600+ with broader availability across major cloud providers for AI workloads and head-node orchestration
  • Inflection from inferencing/Agentic AI increasing CPU orchestration demand; deeper long-term capacity planning engagements with customers
  • Instinct AI momentum improving from pilots to large-scale production, especially inference, leveraging Instinct memory bandwidth/capacity advantages
  • Client share gains and platform wins via latest Ryzen, Ryzen X3D for gaming/content, and Ryzen AI 400/AI Pro 400 desktop for AI PC expansion
  • Embedded return to momentum including increased adoption of embedded x86 and adaptive embedded/semi-custom design wins (double-digit % YoY)

Business Development

  • Expanded strategic partnership with Meta to deploy up to 6 gigawatts of AMD Instinct GPUs across several product generations; includes custom MI450-based GPU accelerator co-designed for Meta’s next-gen AI workloads
  • Previously announced OpenAI partnership (positioned as driving multiyear visibility and co-engineering for large-scale deployments)
  • Cloud partner expansion: major cloud providers expanding EPYC footprint; EPYC instance count >1,600 and nearly +50% YoY
  • Client/customer wins across financial services, health care, industrial, and digital infrastructure; plus sell-through growth with Dell, HP, and Lenovo broadening AMD offerings
  • Enterprise wins in gaming/graphics demand via Radeon 9000-series customers and FSR software updates improving performance/digital quality across workloads

AI IconFinancial Highlights

  • Revenue $10.3B (+38% YoY), exceeding high end of guidance; revenue +0% sequentially
  • Diluted EPS $1.37 (+43% YoY)
  • Free cash flow $2.6B, more than tripled YoY; driven by stronger EPYC/Instinct/Ryzen sales
  • Gross margin 55.0%, up 170 bps YoY
  • Q2 non-GAAP gross margin guide: ~56%
  • Operating margin 25% (operating income $2.5B) and operating expenses $3.1B (+42% YoY) reflecting R&D investment
  • Data center revenue $5.8B (+57% YoY; +7% sequential); Data Center operating income $1.6B (28% margin vs 25% prior year)
  • Client & Gaming revenue $3.6B (+23% YoY; -9% sequential); Embedded revenue $873M (+6% YoY; -8% sequential)
  • Gaming: second-half revenue expected to decline >20% vs first half due to higher memory/component costs
  • Q2 outlook revenue ~$11.2B +/- $300M; guide implies +46% YoY at midpoint and +~9% sequential at midpoint
  • Q2 non-GAAP operating expenses ~$3.3B; non-GAAP effective tax rate 13%; diluted share count ~1.66B

AI IconCapital Funding

  • Share repurchase: 1.1 million shares repurchased in the quarter; $221M returned to shareholders
  • Remaining authorization under repurchase program: $9.2B
  • Balance sheet: cash, cash equivalents, and short-term investments $12.3B at quarter end
  • Debt level not disclosed in provided transcript; no explicit debt/cash runway metric beyond cash and FCF

AI IconStrategy & Ops

  • Capacity/capability build: working with supply chain partners to increase wafer and back-end capacities to support server CPU growth >70% YoY in Q2
  • Helios execution plan: sampling MI450 series GPUs; ramp targeted for 2H (initial volume in Q3 and significant Q4 ramp discussed in Q&A)
  • ROCm software progress: improving performance/scalability; accelerated development cadence with increased software investments and agent-based coding workflows
  • Day-0 support expansion for open models including Google Gemma 4 family, Qwen, and Kimi
  • Client/gaming demand management: planning 2H PC and gaming impacts from higher memory/component costs while still targeting YoY client growth/outperformance

AI IconMarket Outlook

  • Server CPU TAM updated: expected to grow >35% annually, reaching >$120B by 2030 (and CPUs discussed as expanding TAM driven by Agentic AI/inferencing CPU orchestration demand)
  • Q2 server CPU growth: guided to over 70% YoY (Q&A) and continuing into 2H 2026
  • Data center AI ramp: Helios initial volume in Q3 with significant ramp in Q4 and continuing into Q1 2027 (Q&A)
  • Long-term Data Center AI revenue confidence: ability to deliver tens of billions of dollars in annual Data Center AI revenue in 2027; long-term growth target >80% CAGR reiterated
  • Q2 Data Center: guided up sequential double digits with double-digit growth in both server and Data Center AI
  • Long-term gross margin framework reiterated: Analyst Day range 55% to 58% for gross margin

AI IconRisks & Headwinds

  • Supply chain tightness and data center build-out constraints: management cited supply chain tightness and the need for visibility into GPU installation locations and data center power availability
  • China transition affected Data Center AI sequentially: sequentially more China revenue in Q4 vs less in Q1; Data Center AI described as down modestly sequentially due to China revenue timing
  • Q2/Q3 gross margin headwind risk: MI450 ramps below corporate average gross margin, creating dilution in Q4 unless offset by mix/tailwinds
  • Component/memory cost pressure: management expects 2H gaming revenue to decline >20% vs 1H due to higher memory/component costs
  • Competitive supply and platform execution risk: Q&A acknowledged x86 competitor improving supply and ARM merchant/custom momentum; management response leaned on broader CPU portfolio and workload-specific optimization

Q&A: Analyst Interest

  • CPU TAM inflection & >50% share confidence: Management linked TAM doubling to faster-than-expected Agentic/inferencing-driven CPU pull from hyperscalers and enterprise customers, using longer-term forecasts plus workload analysis. They emphasized CPU categories (general purpose, head nodes, Agentic tasks) and the Zen 6/Venice roadmap, citing Turin ramp and broader portfolio execution for share gains.
  • MI450/Helios pipeline & whether forecasts exceeded initial plans: Management clarified that MI450/Helios strengthening is based on overall customer visibility and forecasts across deployments (not just upsized named deals). They said forecasts are above initial 2027 plans, with breadth across customers/workloads, inference-led largest deployments, and engagement also on MI355 and MI500.
  • Gross margin puts/takes into Helios ramp: Management stated Q1 strength and Q2 gross margin guide to ~56%. They highlighted tailwinds (server CPU growth >70% YoY in Q2, client up the stack, embedded accretive, gaming down in 2H). They acknowledged MI450 ramp in Q3/Q4 below corporate average gross margin but argued overall 2026 gross margin setup remains strong with Analyst Day 55%-58% framing.

Sentiment: POSITIVE

Note: This summary was synthesized by AI from the AMD Q1 2026 earnings transcript. Financial data is complex; please verify all metrics against official SEC filings before making investment decisions.

📋 Official Regulatory 10-K / 10-Q SEC Filings

Direct authenticated documentation links to audited SEC database reports for AMD.

SEC EDGAR Live Feed
Loading financial data and tables...
📁

SEC Filings (AMD)

© 2026 Stock Market Info — Advanced Micro Devices, Inc. (AMD) Financial Profile