American Water Works Company, Inc.

American Water Works Company, Inc. (AWK) Market Cap

American Water Works Company, Inc. has a market capitalization of β€”.

No quote data available.

CEO: John C. Griffith

Sector: Utilities

Industry: Regulated Water

IPO Date: 2008-04-23

Website: https://www.amwater.com

American Water Works Company, Inc. (AWK) - Company Information

Market Cap: -|Sector: Utilities

Company Profile

American Water Works Company, Inc., through its subsidiaries, provides water and wastewater services in the United States. It offers water and wastewater services to approximately 1,700 communities in 14 states serving approximately 3.4 million active customers. The company serves residential customers; commercial customers, including food and beverage providers, commercial property developers and proprietors, and energy suppliers; fire service and private fire customers; industrial customers, such as large-scale manufacturers, mining, and production operations; public authorities comprising government buildings and other public sector facilities, such as schools and universities; and other utilities and community water and wastewater systems. It also provides water and wastewater services on various military installations; and undertakes contracts with municipal customers, primarily to operate and manage water and wastewater facilities, as well as offers other related services. In addition, the company operates approximately 80 surface water treatment plants; 480 groundwater treatment plants; 160 wastewater treatment plants; 52,500 miles of transmission, distribution, and collection mains and pipes; 1,100 groundwater wells; 1,700 water and wastewater pumping stations; 1,300 treated water storage facilities; and 76 dams. It serves approximately 14 million people with drinking water, wastewater, and other related services in 24 states. American Water Works Company, Inc. was founded in 1886 and is headquartered in Camden, New Jersey.

Analyst Sentiment

54%
Hold

From 13 Active Polls

1Y Forecast: $131.67

β–² +0.0% Potential Upside

Consensus Target Metrics

Low Bound

$124

Median

$131

High Bound

$140

Average

$132

Price & Moving Averages

Loading chart...

🎯 Wall Street Analyst Intelligence Report

1-Year structural target targets, chart projections, and sentiment maps.

Average 1Y Target
$131.67
β–² +5.78% Upside
Low Target
$124.00
-0% Risk
Median Target
$131.00
5% Mid
High Target
$140.00
12% Max

Consensus Trend Projection

Trailing closures vs. 12-month metrics map.

Analyst Vote Distribution

Aggregate institutional coverage sentiment weights.

Sentiment volume allocation data unavailable.

Historical valuation matrix unavailable.

πŸ“˜ Full Research Report

ℹ️

AI-Generated Research: This report is for informational purposes only.

πŸ“˜ AMERICAN WATER WORKS INC (AWK) β€” Investment Overview

🧩 Business Model Overview

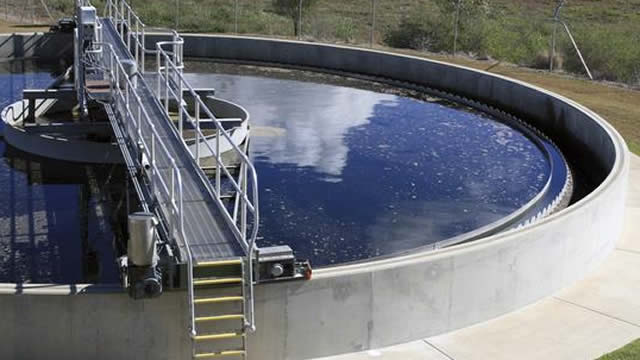
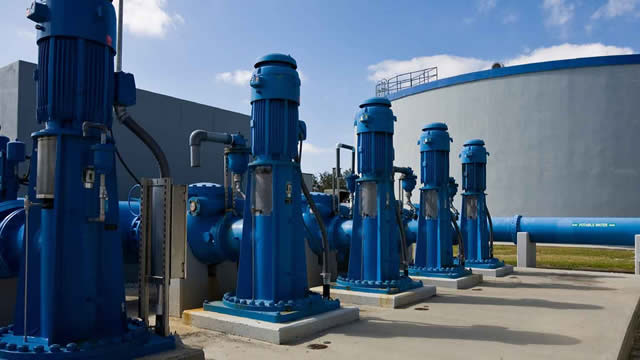
American Water Works is an investor-owned water utility that produces and delivers potable water and related services through regulated distribution networks. The value chain centers on (1) sourcing and treating raw water, (2) transporting water through owned infrastructure, (3) maintaining system reliability and water quality compliance, and (4) billing retail customers under state-regulated rate structures. Because these services operate within granted service territories and rely on extensive physical networks, the business functions as a long-lived infrastructure provider with customer stickiness driven by essential-service characteristics.

πŸ’° Revenue Streams & Monetisation Model

Revenue is primarily recurring and driven by regulated rates that determine what the utility can earn on its β€œrate base” (the invested capital in eligible assets). Monetisation typically reflects a combination of:

  • Customer bill revenue tied to metered consumption and customer charges.
  • Regulatory mechanisms that allow recovery of certain operating costs and capital expenditures over time (subject to regulatory approval), supporting visibility of cash generation.
  • Non-operating or supplemental items such as service-related fees and other permitted charges, with variability depending on jurisdiction.

Margin drivers are largely structural rather than cyclical: regulated allowed returns, the efficiency of operations, and the timing and prudence of capital investment that becomes eligible in rate proceedings. In practice, operating cost control and accurate forecasting of capital and compliance needs shape earnings durability more than volume growth alone.

🧠 Competitive Advantages & Market Positioning

AWK’s economic moat is best understood through Switching Costs and Regulatory Moats, supported by Cost Advantages from scale and operational capability. Once a territory is served, customers cannot practically switch providers, and service expansion depends on regulatory approval and infrastructure buildout rather than competitive churn.

  • Switching Costs / Essential-Service Stickiness: Water service is a necessity, delivered through a fixed network with high replacement costs for customers (and high barriers for alternative providers).
  • Regulatory Moat: Service territories and rate-setting processes create durable franchises. Competitors cannot simply β€œout-market” the utility; they must navigate permitting and rate regulation to gain service rights.
  • Asset and Execution Capability: Large-scale asset management, system reliability programs, and compliance execution reduce operational risk and improve the likelihood that investments are deemed prudent and eligible for recovery.
  • Scale and Cost Efficiencies: Procurement, engineering, operations, and shared services can lower unit costs versus smaller regional operators.

COMPETITIVE BENCHMARKING (examples):

  • Aqua America (WTRG): Focused on regulated utility services with a regional footprint. Compared with AWK’s broader platform and scale, smaller operators can face less diversified cost structure.
  • Essential Utilities (WTRG): Operates across multiple regulated jurisdictions. Competitive dynamics are jurisdiction-specific; the moat relies on regulatory approval and infrastructure performance rather than brand-based competition.
  • SJW Group (SJW): Primarily serves smaller regulated markets. Lower scale can limit cost leverage and limit breadth of operational best practices.

These rivals operate within the same fundamental regulatory framework but differ in footprint size, asset base composition, and execution scale. AWK’s positioning emphasizes breadth of regulated assets, operational scale, and a track record of capital planning and compliance-oriented investment.

πŸš€ Multi-Year Growth Drivers

Over a 5–10 year horizon, growth drivers are anchored in infrastructure necessity and regulatory policy rather than discretionary demand. Key drivers include:

  • Infrastructure renewal and modernization: Replacement of aging mains, treatment upgrades, and system resilience investments supported by regulatory capital programs.
  • Water quality and compliance requirements: Monitoring and treatment needs driven by contaminant risk management, including advanced treatment where required by standards.
  • Capacity expansion and reliability: Investments to address demand changes, system capacity constraints, and reliability improvements to meet health and service obligations.
  • Territory expansion and acquisitions: Selective acquisitions and expansions that can add regulated rate base, subject to prudence and regulatory acceptance.
  • Operational efficiency and asset management: Improved water-loss management, preventative maintenance, and data-driven system operations can support stable utility performance and earnings resilience.

The TAM expansion is less about new β€œmarkets” and more about expanding regulated rate base through needed capex and service territory additions permitted by regulators.

⚠ Risk Factors to Monitor

  • Regulatory outcomes: Rate-setting delays, disallowances of costs or capital, and changes in allowed returns can reduce earnings and cash conversion.
  • Capital intensity and execution risk: Large infrastructure programs carry construction risk, cost overruns, and schedule variability; prudence determinations matter.
  • Water quality and contamination events: Treatment requirements and compliance burdens can increase costs and accelerate capital needs.
  • Climate and resource risk: Drought conditions, source water variability, and extreme weather can pressure supply reliability and raise operating and capital costs.
  • Financing and interest rate risk: As a utility with meaningful leverage and ongoing capital needs, debt costs and access to capital markets influence total returns.
  • Operational and cybersecurity risk: Physical system integrity and cyber resilience are critical for safety and service continuity.

πŸ“Š Valuation & Market View

The market often values regulated utilities through frameworks tied to regulated earnings power and rate base growth, rather than purely discretionary growth metrics. Common valuation lenses include:

  • EV/EBITDA and earnings-based multiples that reflect perceived regulatory stability and earnings durability.
  • Utility-specific metrics linked to allowed returns on rate base, capital investment pace, and the quality of earnings (cost recovery and timing).
  • Credit quality considerations, where financing costs and credit spreads can act as a direct driver of shareholder returns.

Key factors that typically move the valuation multiple are regulatory confidence, visibility of capital plans, and the expected path of allowed returns relative to debt and equity market costs.

πŸ” Investment Takeaway

American Water Works presents a durable long-term thesis built on regulated essential-service economics. The core moat stems from customer switching costs and regulatory franchising, reinforced by scale-driven operational capability and execution in water quality and infrastructure compliance. Multi-year growth is supported by mandated capital needs and service reliability requirements that expand regulated rate base, while principal risks center on regulatory outcomes, capital execution, and water-related compliance and resource stress.


⚠ AI-generated β€” informational only. Validate using filings before investing.

πŸ“Š AI Financial Analysis

Powered by StockMarketInfo
Earnings Data: Q Ending 2026-03-31

"Headline (2026-03-31 Q1): Revenue $1.207B and Net Income $196M with EPS $1.01. YoY (vs 2025-03-31): Revenue +5.7% (from $1.142B) and Net Income -4.4% (from $205M); EPS -3.8%. QoQ (vs 2025-12-31): Revenue -5.0% (from $1.271B) and Net Income -17.6% (from $238M), with profitability softening. Over the last four quarters, AWK’s margins are choppy rather than steadily improving: net margin was ~18.0% in Q1’25, peaked ~26.1% in Q3’25, slipped to 18.7% in Q4’25, and is 16.2% in Q1’26. Operating margin is still solid but has contracted meaningfully from Q4’25 (31.9%) to Q1’26 (32.4%); the bigger issue is below operating income due to other income/interest dynamics. Cash flow quality weakened in Q1’26: operating cash flow was $305M, but heavy capex drove free cash flow to -$354M. Dividend payments were $162M, and leverage remains a watch item with net debt ~$15.7B and total equity ~$11.0B, broadly stable vs prior quarters. Total shareholder returns are muted: the stock is down 10.1% over 1 year (no momentum boost). However, the dividend yield is modest (~0.6%), and the analyst consensus target ($134.67) is below the current price (~$131.61), implying limited near-term upside."

Revenue Growth

Neutral

QoQ revenue fell -5.0% (Q1’26 vs Q4’25) while YoY revenue rose +5.7% (Q1’26 vs Q1’25). Trend across the 4-quarter set is uneven (Q3’25 peak, then decline).

Profitability

Fair

Net income declined -17.6% QoQ and -4.4% YoY. Net margin contracted to 16.2% in Q1’26 from 18.7% in Q4’25 and 18.0% in Q1’25; prior quarter strength in Q3’25 (~26.1%) did not persist.

Cash Flow Quality

Caution

Q1’26 operating cash flow was $305M, but free cash flow was -$354M due to capex. Dividends paid were steady ($162M), but ongoing capex pressure reduces near-term FCF coverage.

Leverage & Balance Sheet

Positive

Equity is fairly stable (~$11.0B in Q1’26 vs ~$10.8B in Q4’25). Leverage remains meaningful with total debt ~$15.7B and net debt ~$15.7B; no major balance-sheet deterioration is evident in the provided quarters.

Shareholder Returns

Caution

1-year price change is -10.1% (no >20% momentum). Dividend yield is modest (~0.6%), so total shareholder return is likely below the market’s best performers.

Analyst Sentiment & Valuation

Neutral

Consensus target ($134.67) is slightly above the current price (~$131.61), suggesting limited upside. Valuation metrics in the data imply higher multiples consistent with utilities, but without strong recent earnings acceleration.

Disclaimer:This analysis is AI-generated for informational purposes only. Accuracy is not guaranteed and this does not constitute financial advice.

Fundamentals Overview

Loading fundamentals overview...

American Water delivered Q1 2026 adjusted EPS of $1.01, matching expectations, and reaffirmed full-year 2026 guidance of $6.02–$6.12, implying 8% EPS growth. Management emphasized that rate-driven revenue catch-up will be concentrated in the second half, with Q3 new rates in key states. The quarter also highlighted financing discipline: debt-to-capital improved to 58% after a $795 million HOS repayment, and the company issued $700 million of 10-year debt at 5.2%. On the regulatory and affordability front, outcomes in West Virginia and Maryland were framed as reasonable while preserving ROEs alongside affordability constraints. A major PFAS cash/offset item added credibility to remediation cost recovery, with about $185 million of net payments from manufacturers. Q&A centered on Pennsylvania case balance, the Essential Utilities merger’s all-states approval requirement, and CAMT-related cash tax benefits (refund plus ~ $100 million/year tail). Overall tone is confident, but pending regulatory outcomes keep it mixed.

AI IconGrowth Catalysts

  • 8% EPS growth target for 2026 with majority of EPS growth weighted to the second half via authorized rate increases effective primarily in Q3
  • Infrastructure investments progressing across pipe replacement, aboveground treatment facilities, PFAS remediation, lead service line removal, and smart meters

Business Development

  • Essential Utilities merger: Kentucky approved; Virginia decision expected in June; merger close expected by end of Q1 2027
  • Acquisition: Nitro wastewater system in West Virginia for $20 million (4,600 customer connections); $40+ million planned capital investment over next 5 years
  • Acquisition pipeline: 105,000 customer connections under agreement from deals totaling $565 million
  • Nexus Water Group Systems: regulatory approval received in 7 of 8 required states; closing expected by June 30

AI IconFinancial Highlights

  • Adjusted EPS: $1.01 in Q1 2026, in line with expectations
  • 2026 adjusted EPS guidance affirmed: $6.02 to $6.12 (8% EPS growth vs 2025)
  • Debt-to-capital improved to 58% at March 31 after repayment of $795 million HOS note in February
  • Long-term debt issuance: $700 million 10-year at 5.2% on April 1, citing strong demand
  • Liqudity/financing: plan contemplates settling roughly $1 billion of equity forward proceeds in midyear
  • Capital/operations: majority of rate-driven revenue changes expected to flow through in Q3 and later (EPS growth weighted to 2H)
  • PFAS: secured approximately $185 million of net payments from PFAS manufacturers to be passed to customers or offset PFAS remediation costs
  • Regulatory outcomes: final orders received in West Virginia and Maryland with revenues/ROEs considered reasonable and balanced with affordability focus

AI IconCapital Funding

  • Quarterly cash dividend increased 8.2% to $0.8950 per share; dividend growth outlook 7% to 9% per year
  • Repayment of $795 million HOS note (February) referenced as driver of improved debt-to-capital
  • New long-term debt: $700 million issued April 1 at 5.2%
  • Equity forward: roughly $1 billion of proceeds expected to be settled midyear (modeled assumption)
  • Mentions of additional long-term debt issuance planned for later in year (timing: Q3/early Q4)

AI IconStrategy & Ops

  • Continued emphasis on controlling costs and keeping bills affordable while executing regulatory and capital plans
  • Focus areas for capex in Q1: pipe replacement, aboveground treatment facilities, PFAS remediation, lead service line removal, and smart meters
  • Regulatory/case execution: rate cases progressing in Virginia, California, and Illinois into key procedural phases; New Jersey next step set for Rate Counsel/intervenor testimony due June 22; Pennsylvania recommended decision expected in May; final order expected in July with new rates effective in August
  • Legislation: infrastructure recovery mechanism in Iowa effective July 1; Indiana power/chemical cost adjustment effective July 1 if changes exceed 3%

AI IconMarket Outlook

  • 2026 adjusted EPS guidance range reaffirmed: $6.02 to $6.12
  • Expect EPS and dividend growth to remain in a consistent 7% to 9% range through 2030 and beyond
  • Merger timing: next Essential Utilities state decision in Virginia expected in June; HSR notification planned for late summer; closing expected by end of Q1 2027

AI IconRisks & Headwinds

  • Regulatory execution risk: Pennsylvania rate case did not settle before procedural deadline (April 6), with settlement not reached before the deadline and outcomes pending ALJ recommended decision in May
  • Merger regulatory approval risk: requires approvals in all states where approvals are required prior to closing
  • Inflation/cost pass-through risk: increased O&M, depreciation, and financing costs expected; affordability focus could constrain realized ROE outcomes
  • Tax/regulatory timing risk: CAMT update timing affects cash tax flows; management indicated cash benefit but also referenced embedded forecast-period CAMT payments previously

Q&A: Analyst Interest

  • Topic: Pennsylvania ROE and rate-case fundamentals. Management cited confidence driven by the merits of the Pennsylvania case, including the need for water/wastewater and PFAS/lead/copper investments, and expected an ALJ recommended decision in May, plus broad stakeholder understanding around necessary environmental capital.
  • Topic: Merger procedural requirements across states. Management clarified that approvals are required in all states where approvals are required, with PUC approvals in 7 states. Kentucky approval was received; decisions in Virginia and Illinois are expected within the calendar year, but closing requires all required approvals.
  • Topic: CAMT guidance impact on earnings/cash flow. Management confirmed a cash benefit, citing a $84 million refund expected this year related to 2024 returns, and a roughly $100 million/year benefit across the forecast horizon with trailing-off later in the period; CAMT changes imply reduced cash tax outflows.

Sentiment: MIXED

Note: This summary was synthesized by AI from the AWK Q1 2026 earnings transcript. Financial data is complex; please verify all metrics against official SEC filings before making investment decisions.

Loading financial data and tables...
Β© 2026 Stock Market Info β€” American Water Works Company, Inc. (AWK) Financial Profile