AutoZone, Inc.

AutoZone, Inc. (AZO) Market Cap

AutoZone, Inc. has a market capitalization of $50.83B.

Price: $3105.48

-10.82 (-0.35%)

Market Cap: 50.83B

NYSE · time unavailable

CEO: Philip Daniele

Sector: Consumer Cyclical

Industry: Specialty Retail

IPO Date: 1991-04-02

Website: https://www.autozone.com

AutoZone, Inc. (AZO) - Company Information

Market Cap: 50.83B|Sector: Consumer Cyclical

Company Profile

AutoZone, Inc. operates as a leading retailer and distributor specializing in automotive replacement parts and accessories. The company's comprehensive inventory caters to a diverse range of vehicles, including cars, sport utility vehicles, vans, and light trucks. Their product offerings encompass both new and remanufactured critical hard parts, essential maintenance items, various accessories, and a selection of non-automotive goods. Key automotive components available include A/C compressors, batteries, bearings, belts, hoses, brake calipers, chassis parts, clutches, CV axles, engines, fuel pumps, fuses, ignition and lighting systems, mufflers, radiators, starters, alternators, thermostats, water pumps, and tire repair kits. For vehicle upkeep, AutoZone supplies antifreeze, windshield washer fluid, an extensive array of brake components (drums, rotors, shoes, pads), various automotive fluids (brake, power steering, oil, transmission), oil and fuel additives, and filters for oil, cabin air, engine air, fuel, and transmission. Other maintenance products cover oxygen sensors, paints, refrigerants, shock absorbers, struts, spark plugs, wires, and windshield wipers. Beyond functional parts, the company offers a wide assortment of accessories and general merchandise such as air fresheners, mobile phone accessories, snacks, drinks, floor mats, seat covers, interior and exterior styling products, mirrors, performance parts, protectants, cleaners, sealants, adhesives, steering wheel covers, car stereos, radios, various tools, and vehicle wash/wax supplies. Additionally, they provide towing services. AutoZone also extends its reach through several channels: a commercial program providing credit and delivery services for professional clients; sales of automotive diagnostic and repair software under the ALLDATA brand via alldata.com and alldatadiy.com; and online retail of its full product range (hard parts, maintenance, accessories, non-automotive items) through autozone.com. As of November 20, 2021, AutoZone maintained a significant operational footprint, with 6,066 stores in the United States, 666 stores in Mexico, and 53 stores in Brazil. The company was established in 1979 and is headquartered in Memphis, Tennessee.

Analyst Sentiment

85%
Strong Buy

From 45 Active Polls

1Y Forecast: $3909.09

▲ +25.9% Potential Upside

Consensus Target Metrics

Low Bound

$3200

Median

$3880

High Bound

$4800

Average

$3909

Price & Moving Averages

Loading chart...

🎯 Wall Street Analyst Intelligence Report

1-Year structural target targets, chart projections, and sentiment maps.

Average 1Y Target
$3909.09
▲ +25.88% Upside
Low Target
$3200.00
3% Risk
Median Target
$3880.00
25% Mid
High Target
$4800.00
55% Max
Consensus
Buy
33 / 45 Buys

Consensus Trend Projection

Trailing closures vs. 12-month metrics map.

Analyst Vote Distribution

Aggregate institutional coverage sentiment weights.

📊 Historical Valuation Multiples

Real-time Trailing Twelve Month (TTM) momentum side-by-side with discrete quarterly metrics.

Fiscal QuarterTTMQ2 2026Q1 2026Q4 2025Q3 2025Q2 2025Q1 2025Q4 2024Q3 2024
Period EndingTrailing 12MMay 9, 2026Feb 14, 2026Nov 22, 2025Aug 30, 2025May 10, 2025Feb 15, 2025Nov 23, 2024Aug 31, 2024
Market Cap ($M)50,83457,57564,24664,90770,24661,35359,64353,83654,181
Enterprise Value ($M)63,21169,95376,37276,66982,26373,27371,70865,79866,249
Price to Earnings Ratio (P/E)20.6422.4434.2630.5720.9825.2130.5623.8215.01
Price/Earnings-to-Growth Ratio (PEG)1.690.531.940.32
Price to Sales Ratio (P/S)2.5411.8915.0314.0211.2513.7415.0912.588.73
Price to Book Ratio (P/B)-18.37-20.68-22.09-20.10-20.57-15.44-13.38-11.52-11.41
Price to Free Cash Flow Ratio (P/FCF)31.12126.131749.81103.21137.43144.99204.9295.3274.89
Enterprise Value to Sales (EV/Sales)14.4517.8716.5613.1816.4118.1415.3710.68
Enterprise Value to EBITDA (EV/EBITDA)14.8264.5389.4282.2359.0372.4884.8967.5344.66
Debt to Equity Ratio2.90-4.54-4.27-3.73-3.60-3.07-2.77-2.62-2.60

AZO Growth Runway Model

Standard long term linear growth fade

Multi-Stage Discounted Cash Flow Sandbox

Market Price$3105.48
Intrinsic Value$1286.19
Market Alignment
Overvalued by 58.6%relative to calculated intrinsic value
9.00%
Exp: 1%1%
i

Growth runway slowdown

This value provides a time window for the growth rate to decline beyond Stage 1 toward the terminal rate. Longer windows are most useful for companies with high growth starting conditions or strong competitive advantages. This option stretches out the growth rate slowdown across 5, 10, or 15-year steps. A high-growth starting condition (exceeding a 25% initial growth rate) automatically applies a curve decay to simulate realistic, rapid market saturation.
i

Terminal growth rate

With long-term inflation between 3-5%, revenue must grow by that baseline to maintain flat real-world market share. This value sets the permanent terminal growth rate to factor into the valuation beyond the growth slowdown runway toward maturity.

3-Stage Financial Runway Horizon

🧠 Perpetuity Horizon Engine (Stage 3: Post-2035)

Terminal FCF Base$2.90B
Perpetuity TV Value$54.48B
Discounted TV (PV)$23.01B
TV Weighting %57.8%
⚠️
Financial Model Disclaimer & Risk Disclosure: This interactive scenario simulator is an educational sandbox provided strictly for informational and analytical research purposes. Core historical financial statements and consensus estimates are sourced directly via Financial Modeling Prep (FMP). All downstream outputs are entirely deterministic, hypothetical projections generated by combining automated mathematical formulas (including linear interpolation and Gaussian bell-curve decay models) with user-selected variables and third-party financial data inputs. Users assume all liability for trading decisions executed based on these sandbox calculations.

📘 Full Research Report

ℹ️

AI-Generated Research: This report is for informational purposes only.

📘 AUTOZONE INC (AZO) — Investment Overview

🧩 Business Model Overview

AutoZone operates a parts-focused retail distribution model serving the repair and maintenance needs of the installed vehicle base. The core value chain runs from sourcing and import/manufacturing relationships to centralized distribution, then to a dense network of stores that stock fast-moving categories (replacement parts, maintenance items, and accessories). Customers typically include DIY drivers and professional installers/repair shops, both of whom value immediate availability and knowledgeable counter support. The store footprint plus inventory replenishment cadence creates practical “on-demand” access to parts, which increases repeat visits across maintenance cycles.

💰 Revenue Streams & Monetisation Model

Revenue is predominantly transactional—sales of automotive parts and accessories at the store level, with monetisation driven by store traffic and the mix of products sold. While the purchases are not contractual or subscription-like, the underlying demand is recurrent because vehicle maintenance is recurring over a vehicle’s life. Margin drivers are primarily:

  • Product mix: higher-margin categories and services-like add-ons (e.g., batteries, alternators, filters, and maintenance bundles) tend to carry better profitability than commodity-heavy lines.
  • Private label/private assortment: own-brand penetration (where available) supports structurally higher gross margins and stronger pricing flexibility versus national brands.
  • Inventory discipline: turnover and availability reduce markdowns and support stable gross margin through cycles.
  • Commercial customer share: pro accounts can improve order frequency and basket size, supporting utilization of supply chain capacity.

🧠 Competitive Advantages & Market Positioning

AutoZone’s moat is best characterized as Scale/Distribution leverage with Private Brand resistance, reinforced by operational execution in inventory and store logistics.

  • Scale/distribution leverage: AutoZone’s logistics system and procurement scale improve cost per unit, enable efficient replenishment, and help maintain high fill rates. Higher availability reduces customer switching to competitors when parts are needed quickly.
  • Private label resistance: Own-brand and preferred brands can offer better economics and reduce direct price competition in categories where fitment and quality are proven. This supports margin durability and limits share loss on pure price.
  • Category depth and fitment capability: Extensive part coverage and counter support reduce “wrong part” friction, which strengthens customer trust and repeat purchasing.

Competitive benchmarking: AutoZone competes primarily with O’Reilly Automotive (ORLY) and Advance Auto Parts (AAP). Compared with these rivals, AutoZone’s business emphasis remains on fast-moving categories and supply chain execution that supports store-level availability. While competitors also pursue private label and distribution scale, sustained store-level fill rates and disciplined inventory management are key differentiators that influence share stability.

🚀 Multi-Year Growth Drivers

The multi-year opportunity is anchored in the size and aging of the on-road vehicle population, plus continued replacement/maintenance intensity for modern vehicle fleets. Key structural drivers:

  • Vehicle parc growth and aging: Older vehicles generally require more maintenance and replacement parts, supporting demand for batteries, brakes, sensors, filters, and other maintenance categories.
  • DIY and do-it-for-me durability: Even as vehicle complexity rises, consumers and independent installers still need accessible parts and knowledgeable counter support; that supports store traffic.
  • Category expansion into higher-margin systems: Continued mix shift toward components with better economics (e.g., batteries, charging, braking, and maintenance bundles) can lift profitability even without major unit growth.
  • Operational leverage: Scale in sourcing, distribution, and labor productivity can translate volume and mix improvements into operating margin over time.
  • EV and alternative powertrains as a transition market: EVs reduce certain traditional drivetrain parts, but they increase demand in areas such as batteries, tires, brakes, HVAC/thermal components, and sensors—allowing parts retailers to re-balance assortments rather than exit the market.

⚠ Risk Factors to Monitor

  • Competitive intensity and pricing pressure: Persistent promotions or accelerated private label adoption by peers can compress margins.
  • Inventory and supply chain disruptions: Parts availability and obsolescence risk rise when demand shifts faster than procurement and distribution systems.
  • Demand cyclicality: Vehicle miles driven, credit conditions, and discretionary maintenance timing can affect replacement rates.
  • Technology and fitment complexity: Faster vehicle model churn and more electronics can increase SKUs and improve fitment challenges, raising stocking and merchandising requirements.
  • Capital intensity and store economics: Maintaining network productivity and distribution efficiency requires ongoing investment; underperformance in store-level returns can weigh on capital allocation.

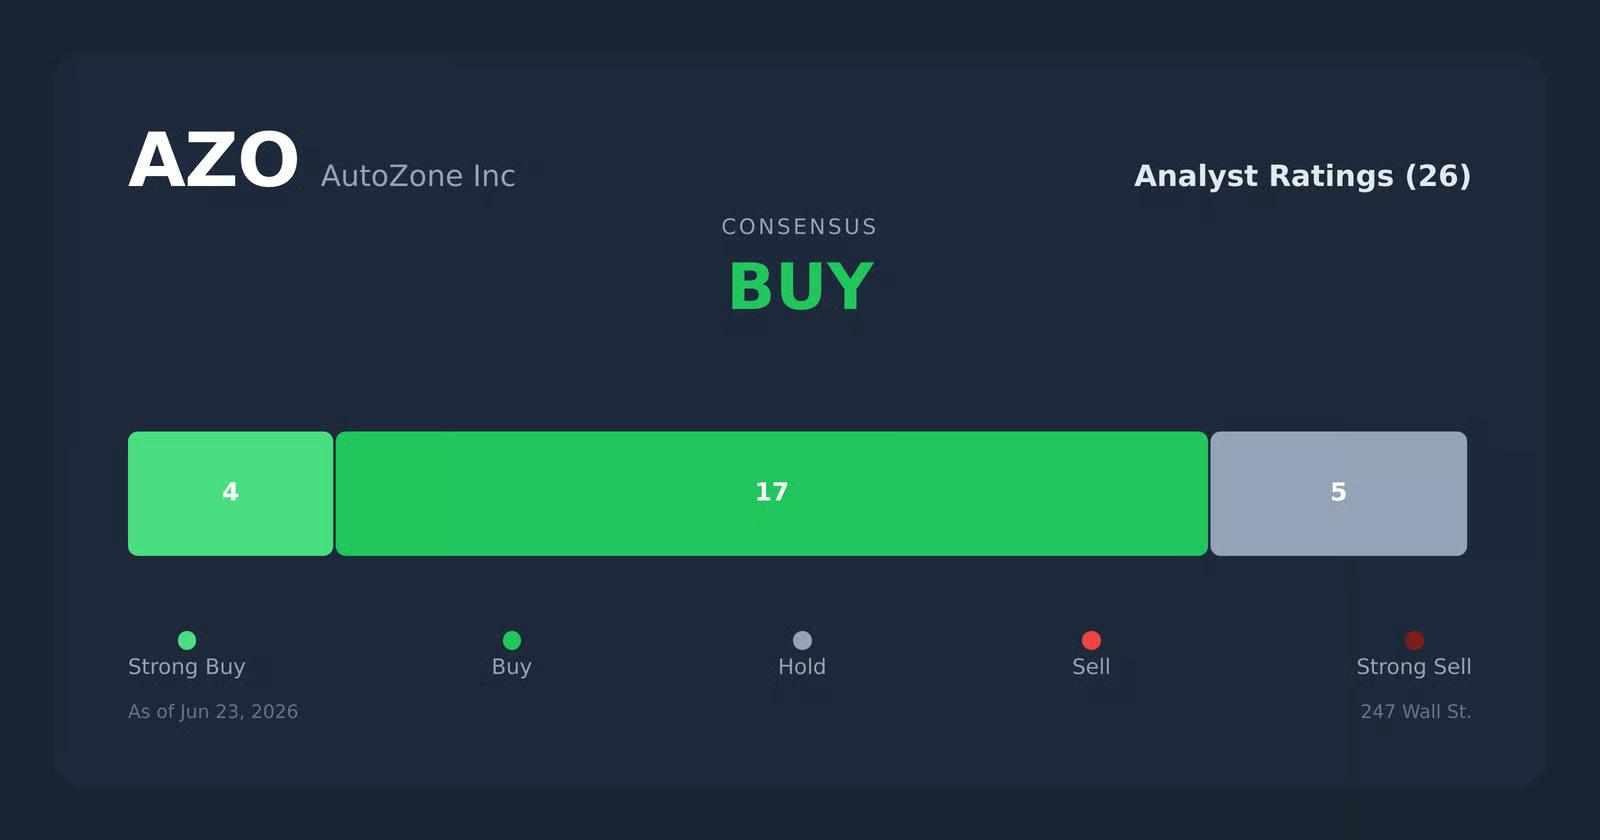
📊 Valuation & Market View

Equity valuation for auto parts retailers typically reflects a combination of cash generation durability, operating leverage, and return on incremental invested capital. The market often anchors on EV/EBITDA or EV/operating profit frameworks, with incremental reassessment driven by:

  • Gross margin durability (mix and private label penetration)
  • Inventory turns and shrink (working-capital efficiency)
  • Comparable store sales quality (traffic vs. price/mix)
  • Operating cost leverage from distribution and store productivity
  • Capital return capacity (buybacks/dividends as supported by free cash flow)

🔍 Investment Takeaway

AutoZone’s long-term attractiveness rests on a hard-to-replicate operating system: scale-driven distribution leverage paired with private brand economics and store-level availability. These elements support repeat demand from the installed vehicle base while limiting margin erosion during competitive and industry transitions. The primary debate for investors is less about the existence of demand and more about sustaining mix, inventory discipline, and store productivity as vehicle technology and competitive dynamics evolve.


⚠ AI-generated — informational only. Validate using filings before investing.

📰 Market News & Coverage

15 Stories Available

Real-time institutional reporting and market updates for AZO.

zacks.com2026-06-15

AutoZone, Inc. (AZO) is Attracting Investor Attention: Here is What You Should Know

AutoZone (AZO) has received quite a bit of attention from Zacks.com users lately. Therefore, it is wise to be aware of the facts that can impact the stock's prospects.

247wallst.com2026-06-08

Wall Street Slept on This Amazon-Proof Business Model. It's Now at a 5-Year Discount.

While the market obsesses over every NVIDIA earnings whisper, an unglamorous parts retailer in Memphis has quietly become one of the most interesting contrarian setups of 2026.

zacks.com2026-06-03

AutoZone, Inc. (AZO) Is a Trending Stock: Facts to Know Before Betting on It

Recently, Zacks.com users have been paying close attention to AutoZone (AZO). This makes it worthwhile to examine what the stock has in store.

globenewswire.com2026-06-03

AutoZone Vendor Summit Recognizes Contributions of Top Suppliers

MEMPHIS, Tenn., June 03, 2026 (GLOBE NEWSWIRE) -- AutoZone (NYSE: AZO) recognized 15 of its top suppliers at its annual Vendor Summit. The awards celebrate companies that achieved exceptional results while maintaining a strong focus on customer satisfaction over the past year.

247wallst.com2026-06-01

“Demand for Data Center Power Continues to Outpace Expectations” — Josh Brown's Case for Heavy Assets Over AI Hype

Josh Brown, CEO of Ritholtz Wealth Management and a fixture on CNBC's Halftime Report, has built a new ETF around a simple idea: own the businesses that artificial intelligence cannot replace.

feeds.benzinga.com2026-05-31

Zscaler, AutoZone, And Regencell Are Among Top 10 Large-Cap Losers Last Week (May 25-May 29): Are The Others In Your Portfolio?

Weak guidance, analyst target cuts and declining energy prices weighed on Zscaler, AutoZone, PDD Holdings and other large-cap stocks, making them last week's biggest losers.

fool.com2026-05-29

Why AutoZone Stock Slumped This Week

AutoZone released its quarterly earnings this week. Wall Street was disappointed by domestic and international same-store sales growth.

zacks.com2026-05-28

AZO Q3 Earnings Call Puts Focus on Commercial Momentum

AZO touts commercial share gains and faster store growth after 8.4% sales jump, dismissing late-quarter softness as weather-driven noise.

fool.com2026-05-28

AutoZone Fell Short of Wall Street's Expectations. Should You Buy the Dip?

AutoZone's net sales increased 8.4% year over year. While international growth slowed, AutoZone is still on track to open between 355 to 365 new locations this fiscal year.

zacks.com2026-05-27

AutoZone Q3 Earnings Beat Estimates on Strong Sales Growth

AZO tops Q3 earnings estimates as commercial sales jump 10.4%, driving the company's strongest yearly sales growth in over three years.

fool.com2026-05-27

These 3 Stocks Recently Hit New 52-Week Lows. Could They Be Bargain Buys?

Shares of AutoZone, Intuit, and PDD Holdings are all down this year, but their underlying businesses still look strong.

benzinga.com2026-05-27

AutoZone Analysts Slash Their Forecasts Following Q3 Results

AutoZone, Inc. (NYSE:AZO) on Tuesday reported stronger third-quarter revenue growth.

247wallst.com2026-05-27

4 High-Flying Stocks Stubbornly Resist Splits—Here's Which Might Crack First

The stock split is back in fashion. Yet a small club of high-priced names has refused to play along for decades, even as peers embrace splits to court retail investors.

feeds.benzinga.com2026-05-27

Nasdaq Jumps Over 300 Points On Micron's Rally, Investor Sentiment Improves, Fear Index Remains In 'Greed' Zone

U.S. stocks mixed, Nasdaq up 300 points on semiconductor rally. CNN Money Fear and Greed index remains in Greed zone at 60.7.

seekingalpha.com2026-05-26

AutoZone's Plunge Doesn't Mean To Rush In To Buy

AutoZone, Inc. reported strong EPS but missed on revenue and experienced gross margin contraction, prompting a cautious Hold rating despite the recent price drop. AZO benefits from the aging U.S. vehicle fleet and ongoing store expansion but faces weak DIY traffic and inflation-driven margin pressures. Commercial sales growth is robust, yet this segment carries lower margins, contributing to recent profitability headwinds and a mixed outlook.

📊 AI Financial Analysis

Powered by StockMarketInfo
Earnings Data: Q Ending 2026-05-09

"AZO (Q3’26 ended 2026-05-09) reported Revenue of $4.84B and Net Income of $641.5M, with EPS of $38.95. QoQ, Revenue rose to $4.84B from $4.27B (+13.2%) and Net Income increased to $641.5M from $468.9M (+36.8%). YoY, Revenue improved from $4.46B (Q3’25) to $4.84B (+8.4%), while Net Income grew from $608.4M (+5.4%). Profitability was stronger sequentially: gross margin ticked down slightly (52.15% vs. 52.49% in Q2), but operating margin expanded to 19.08% from 16.34% (+2.74pp QoQ) and net margin rose to 13.25% from 10.97% (+2.28pp QoQ). YoY, net margin was marginally lower (13.25% vs. 13.63% in Q3’25), suggesting some cost pressure despite top-line growth. Cash flow/returns data provided is limited (operating cash flow shown as zero in Q3’26), but capital allocation signals are mixed: recent quarters show meaningful share repurchases. Balance sheet quality appears pressured with negative total equity (about -$2.78B) and high leverage (long-term debt ~$12.3B; net debt ~$12.0B), though interest coverage remains healthy (8.36x). Total shareholder returns: the stock price is $3,572.38 with modest 1Y_change of +0.15% (low momentum), and dividend yield is shown as 0%. Net: solid sequential earnings acceleration, moderate YoY growth, but leverage/equity optics remain a key overhang, keeping the score below the highest tier."

Revenue Growth

Positive

Revenue improved QoQ (+13.2%) and grew YoY (+8.4%) to $4.84B, indicating a constructive demand/volume quarter.

Profitability

Positive

Operating margin expanded QoQ to 19.08% (from 16.34%) and net margin rose to 13.25% (from 10.97%). YoY net margin slightly contracted (13.25% vs. 13.63%).

Cash Flow Quality

Caution

Q3’26 operating cash flow is reported as 0 in the provided cash flow table, limiting conviction. Prior quarters showed positive operating cash flow, but current-quarter cash conversion is unclear.

Leverage & Balance Sheet

Fair

Negative total equity persists (about -$2.78B) with high net debt (~$12.04B) and meaningful long-term debt (~$12.29B). Interest coverage remains solid (8.36x), partially offsetting risk.

Shareholder Returns

Fair

1Y price change is only +0.15% (no momentum boost) and dividend yield is 0% per provided ratios. Repurchases appear active in earlier quarters, but total return impact is not quantified here.

Analyst Sentiment & Valuation

Good

Current price ($3,572) sits below the consensus target ($4,000), implying potential upside versus Street expectations; valuation multiples are not used as primary inputs but price target support is a positive.

Disclaimer:This analysis is AI-generated for informational purposes only. Accuracy is not guaranteed and this does not constitute financial advice.

Fundamentals Overview

Loading fundamentals overview...

AZO delivered accelerating momentum in Q3 2026: $4.8B revenue (+8.4% YoY) and EPS of $38.07 (+7.7%), with the key earnings headwind coming from a $20M non-cash LIFO charge. On an ex-LIFO basis, EPS would have risen +12.5%, and EBIT would have increased +11%. Margin was pressured 57 bps to 52.2% as LIFO contributed a 77 bps unfavorable comparison, though underlying gross margin was up 20 bps and SG&A leveraged 25 bps. Growth quality looks stronger than headline comps: domestic commercial surged +10.4% on DIFM and mega hub coverage (14 opened; 156 total), while DIY held +2.2% despite traffic -3.6% from unseasonably cool late-quarter weather. Management guided Q4 with mid-4% ticket expectations, continued reliance on mega hubs, FX tailwinds (~$0.78/share if rates hold), and explicit LIFO drag (~-$1.40/share EPS; -45 bps gross margin). International remains more cautious under softer macro.

AI IconGrowth Catalysts

  • Domestic commercial DIFM sales +10.4% driven by improved satellite store inventory availability and expanded hub/mega hub coverage
  • Mega Hub rollout: opened 14 mega hubs in Q3 (now 156) supporting faster speed-to-customer and expanded SKU access (100k SKUs typically)
  • Domestic DIY resilience: DIY comp +2.2% with share gains; ticket +5.6% offset by traffic -3.6% due to unseasonably cool weather
  • International expansion: opened 20 stores in Mexico (933 total) and 5 in Brazil (157 total); constant-currency same-store +1.6%

Business Development

  • Commercial program growth: opened 46 net new commercial programs; commercial program present in 94% of domestic stores
  • Commercial share gains with both smaller 'up-and-down-the-street' customers and national accounts (each grew double digits in Q3)

AI IconFinancial Highlights

  • Total sales: $4.8B, +8.4% YoY (largest increase in 3+ years)
  • EPS: $38.07, +7.7% YoY; excluding Q3 non-cash LIFO charge of $20M and prior-year $16M credit, EPS would have been up +12.5%
  • EBIT: $924M, +6.6% YoY; excluding unfavorable LIFO comparison, EBIT would have grown +11%
  • Gross margin: 52.2%, down 57 bps YoY; driven by $20M non-cash LIFO charge (77 bps unfavorable LIFO comparison); ex-LIFO gross margin +20 bps YoY
  • SG&A leverage: SG&A as % of sales leveraged 25 bps due to strong top-line growth and expense management
  • Tax rate: 21.1% (vs 19.4% prior-year quarter); excluding stock-option benefit, 21.6% vs 22.4% prior year; modeled Q4 all-in ~22%
  • FX tailwind: Mexico peso strengthened ~13% vs prior year, adding $74M sales, $20M EBIT, and $0.83/share EPS benefit
  • Free cash flow: $455M in Q3 vs $423M prior year; $1.1B year-to-date

AI IconCapital Funding

  • Share repurchases: $586M in the quarter
  • Remaining authorization: $800M at quarter end
  • Leverage: 2.5x EBITDAR
  • Debt: interest expense $110M in Q3, flat YoY; planning Q4 interest $152M vs $148M last year

AI IconStrategy & Ops

  • Store growth plan: opened 82 stores globally in Q3; US 6,770 stores, Mexico 33, Brazil 157; FY 2026 store openings expected ~365 vs 305 in FY25
  • Q4 store openings expectation: ~160 stores globally (141 last year)
  • Cadence/weather impact: domestic comp cadence 5% (first 4 weeks), 4.5% (second), 2.9% (last); last 2 weeks comps 1.3% due to unseasonably cool weather impacting heat-related categories
  • Margin drivers discussed in Q&A: core gross margin improved; shrink improving; supply chain productivity improving; commercial mix expected to create additional mixed drag

AI IconMarket Outlook

  • Domestic Q4: average ticket expected mid-4% range (management expectation to lap inflation ramp from beginning of Q4 prior year)
  • DIY inflation context: same-SKU inflation 'probably' ~4% range continuing into Q4 (per management)
  • International Q4: expect same-store sales 'similar range' to Q3 on constant currency; management remains 'cautious' due to pressured consumers/international markets
  • FX sensitivity: if Q4 spot rates hold, expected ~$62M revenue, ~$19M EBIT, and ~$0.78/share EPS benefit
  • LIFO outlook for Q4: ~$30M LIFO reduction to EBIT; gross margin negatively impacted by ~45 bps; EPS impact ~($1.40)/share
  • Mega Hub expansion: expects ~14 mega hubs in Q4 and 'another, you know, 14 or so mega hubs' next quarter (supporting DIY and commercial volume)

AI IconRisks & Headwinds

  • Unseasonably cool weather in late Q3 suppressed heat-related category volumes, pressuring DIY traffic (DIY traffic -3.6%)
  • Inflation remains an 'environment [that] will continue to be inflationary'; energy/oil and supplier input costs could increase; lubricants constraints mentioned as a potential factor but expected not to be 'material' (management)
  • LIFO: higher costs driving larger LIFO charges; Q4 expected LIFO drag (~$30M) and gross margin pressure (~45 bps)
  • International macro softness: slowed Mexico growth; management expects Q4 international comps similar to Q3 on constant currency and remains cautious
  • Tariff/energy/resin/steel-related cost pressure: tariffs on steel/auto parts in place; management expects cost ramp to be muted as they lap higher inflation from last year

Q&A: Analyst Interest

  • Same-SKU inflation trajectory & input-cost drivers: Management said inflation and ticket average rates should be in a “probably 4% range,” implying Q4 remains more muted than Q3. For lubricants, they deferred to oil specialists, acknowledging constraints but expecting limited material impact on AZO.
  • Q4 same-store sales outlook vs weather improvements: Management stated no major change from prior commentary. They expect a “normal summer” (cooler May not enough to change view) supported by mega hub openings (about 14 in Q4). Execution and store productivity were emphasized as key swing factors.
  • Gross margin outlook and LIFO/mix effects: Management indicated Q4 gross margin should remain solid, citing ~42 bps of gross margin improvement in Q3 offsetting ~22 bps commercial mix drag. They highlighted improving shrink and supply-chain productivity, but noted commercial growth should add mixed drag to manage.

Sentiment: MIXED

Note: This summary was synthesized by AI from the AZO Q3 2026 earnings transcript. Financial data is complex; please verify all metrics against official SEC filings before making investment decisions.

📋 Official Regulatory 10-K / 10-Q SEC Filings

Direct authenticated documentation links to audited SEC database reports for AZO.

SEC EDGAR Live Feed
Loading financial data and tables...
📁

SEC Filings (AZO)

© 2026 Stock Market Info — AutoZone, Inc. (AZO) Financial Profile