Boise Cascade Company

Boise Cascade Company (BCC) Market Cap

Boise Cascade Company has a market capitalization of $2.40B.

Price: $68.08

-0.40 (-0.58%)

Market Cap: 2.40B

NYSE · time unavailable

CEO: Jeffrey Robert Strom

Sector: Basic Materials

Industry: Construction Materials

IPO Date: 2013-02-06

Website: https://www.bc.com

Boise Cascade Company (BCC) - Company Information

Market Cap: 2.40B|Sector: Basic Materials

Company Profile

Boise Cascade Company manufactures wood products and distributes building materials in the United States and Canada. It operates through two segments, Wood Products and Building Materials Distribution. The Wood Products segment manufactures laminated veneer lumber and laminated beams used in headers and beams; I-joists for residential and commercial flooring and roofing systems, and other structural applications; structural, appearance, and industrial plywood panels; and ponderosa pine lumber products. This segment's products are used in new residential construction, residential repair-and-remodeling markets, light commercial construction, and industrial applications. It sells its products to wholesalers, home improvement centers, retail lumberyards, and industrial converters. The Building Materials Distribution segment distributes a line of building materials, including oriented strand boards, plywood, and lumber; general line items, such as siding, composite decking, doors, metal products, insulation, and roofing; and engineered wood products. This segment sells its products to dealers, home improvement centers, and specialty distributors. The company was founded in 2004 and is headquartered in Boise, Idaho.

Analyst Sentiment

72%
Buy

From 7 Active Polls

1Y Forecast: $94.50

▲ +38.8% Potential Upside

Consensus Target Metrics

Low Bound

$92

Median

$95

High Bound

$97

Average

$95

Price & Moving Averages

Loading chart...

🎯 Wall Street Analyst Intelligence Report

1-Year structural target targets, chart projections, and sentiment maps.

Average 1Y Target
$94.50
▲ +38.81% Upside
Low Target
$92.00
35% Risk
Median Target
$94.50
39% Mid
High Target
$97.00
42% Max
Consensus
Hold
5 / 12 Buys

Consensus Trend Projection

Trailing closures vs. 12-month metrics map.

Analyst Vote Distribution

Aggregate institutional coverage sentiment weights.

📊 Historical Valuation Multiples

Real-time Trailing Twelve Month (TTM) momentum side-by-side with discrete quarterly metrics.

Fiscal QuarterTTMQ1 2026Q4 2025Q3 2025Q2 2025Q1 2025Q4 2024Q3 2024Q2 2024
Period EndingTrailing 12MMar 31, 2026Dec 31, 2025Sep 30, 2025Jun 30, 2025Mar 31, 2025Dec 31, 2024Sep 30, 2024Jun 30, 2024
Market Cap ($M)2,3962,7242,7102,8913,2723,7294,5755,4774,638
Enterprise Value ($M)2,6092,9372,7552,9023,2983,6814,3785,2324,243
Price to Earnings Ratio (P/E)22.1638.1677.5833.2013.1923.1116.6015.0410.33
Price/Earnings-to-Growth Ratio (PEG)14.501.001.12
Price to Sales Ratio (P/S)0.381.821.861.731.882.432.923.202.58
Price to Book Ratio (P/B)1.211.351.311.351.521.752.132.582.01
Price to Free Cash Flow Ratio (P/FCF)62.08-48.8135.1845.70-71.30-45.656027.5648.5045.50
Enterprise Value to Sales (EV/Sales)1.961.891.741.902.402.793.052.36
Enterprise Value to EBITDA (EV/EBITDA)7.7941.7344.7036.9426.5737.7731.9931.7822.09
Debt to Equity Ratio0.640.270.250.240.240.240.240.240.23

BCC Growth Runway Model

Standard long term linear growth fade

Multi-Stage Discounted Cash Flow Sandbox

Market Price$68.08
Intrinsic Value$163.19
Market Alignment
Undervalued by 139.7%relative to calculated intrinsic value
9.00%
Exp: -2%-2%
i

Growth runway slowdown

This value provides a time window for the growth rate to decline beyond Stage 1 toward the terminal rate. Longer windows are most useful for companies with high growth starting conditions or strong competitive advantages. This option stretches out the growth rate slowdown across 5, 10, or 15-year steps. A high-growth starting condition (exceeding a 25% initial growth rate) automatically applies a curve decay to simulate realistic, rapid market saturation.
i

Terminal growth rate

With long-term inflation between 3-5%, revenue must grow by that baseline to maintain flat real-world market share. This value sets the permanent terminal growth rate to factor into the valuation beyond the growth slowdown runway toward maturity.

3-Stage Financial Runway Horizon

🧠 Perpetuity Horizon Engine (Stage 3: Post-2035)

Terminal FCF Base$0.45B
Perpetuity TV Value$8.40B
Discounted TV (PV)$3.55B
TV Weighting %56.4%
⚠️
Financial Model Disclaimer & Risk Disclosure: This interactive scenario simulator is an educational sandbox provided strictly for informational and analytical research purposes. Core historical financial statements and consensus estimates are sourced directly via Financial Modeling Prep (FMP). All downstream outputs are entirely deterministic, hypothetical projections generated by combining automated mathematical formulas (including linear interpolation and Gaussian bell-curve decay models) with user-selected variables and third-party financial data inputs. Users assume all liability for trading decisions executed based on these sandbox calculations.

📘 Full Research Report

ℹ️

AI-Generated Research: This report is for informational purposes only.

📘 BOISE CASCADE (BCC) — Investment Overview

🧩 Business Model Overview

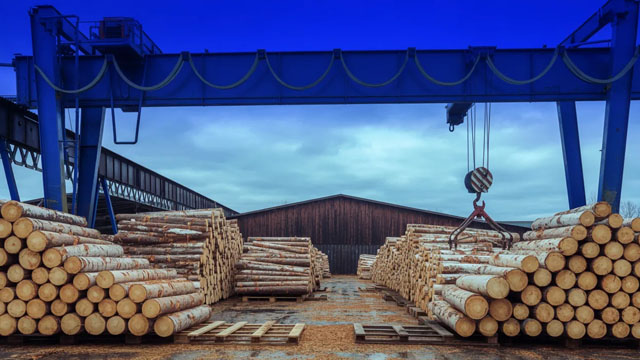
Boise Cascade operates across the wood-products value chain: it manufactures engineered and structural wood products (including panels and lumber-related offerings) and converts commodity fiber inputs into higher-value building components, then distributes building materials to end markets. The economic “engine” is conversion economics—turning low-cost fiber and logs (and purchased inputs where needed) into products with customer-specific qualification requirements—paired with distribution that monetizes delivery proximity, service capability, and product availability for builders and contractors.

The integrated manufacturing-and-distribution model reduces friction in the supply chain: mills benefit from scale and scheduling discipline to feed downstream demand, while distribution benefits from stable product supply, consistent specification capability, and localized logistics that lower delivered costs for customers.

💰 Revenue Streams & Monetisation Model

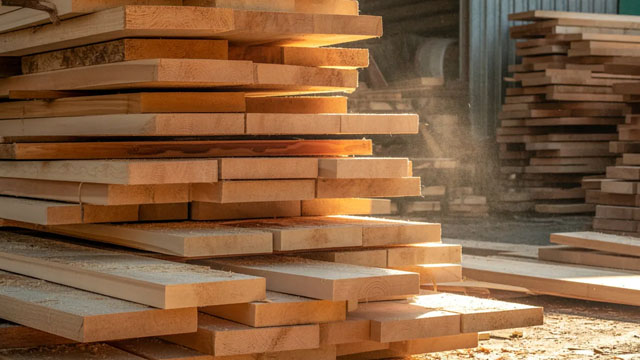
  • Manufactured wood products: Sales of structural and engineered wood products are primarily transactional and influenced by housing and construction cycles. Margins are driven by conversion efficiency (recovery rates, yields), plant cost structure, product mix (specification and grade), and the spread between fiber/log costs and selling prices.
  • Building materials distribution: Distribution revenue is also largely transactional, but monetization is more linked to logistics economics and service levels—delivering a defined set of products quickly and reliably to job sites. Margin drivers include delivery costs, inventory turns, purchasing scale, and the ability to source from appropriate plants and suppliers during demand swings.

Overall profitability tends to be most sensitive to (1) input-cost trends for fiber, (2) capacity utilization and operating discipline, and (3) product-mix discipline that supports pricing resilience during weak construction conditions.

🧠 Competitive Advantages & Market Positioning

BCC’s primary moat is a blend of geographic cost advantage, logistical infrastructure, and operational execution. Wood products are structurally cost- and logistics-sensitive: freight and delivered cost matter because inputs and finished goods are bulky with limited margin for inefficiencies. Boise’s manufacturing footprint and its downstream distribution presence allow it to reduce delivered-cost disadvantage versus less well-located producers.

  • Geographic cost advantage: Facilities located to access fiber supply and to serve major North American construction demand centers support lower average delivered costs and more effective plant-to-market matching.
  • Logistical infrastructure: Distribution operations create a closer physical and operational link to customer job sites, supporting faster fill rates and reducing “lost productivity” costs for contractors when alternatives are less available.
  • Specification and qualification: Many wood-product applications require consistent dimensions, grades, and performance characteristics. Qualification and repeat-ordering create practical stickiness, even when the underlying materials are commoditized.

Competitive benchmarking (industry peers):

  • Weyerhaeuser (timber + lumber/panels): larger scale and broad timber ownership can support cost competitiveness, but its mix and operating focus differ from BCC’s combination of manufacturing with building-material distribution economics.
  • Louisiana-Pacific (LP) (panels and engineered wood): strong engineered products focus and manufacturing scale compete directly in structural applications; however, BCC’s distribution-linked logistics and service model can change the customer value proposition at the job-site level.
  • West Fraser (lumber + engineered/panels): competes on commodity lumber and panel markets; BCC’s positioning emphasizes delivered-cost and product availability through distribution alongside manufacturing.

Against these rivals, BCC’s industry focus is distinctive in the extent to which distribution logistics and service capability can complement manufacturing cost structure—particularly in meeting contractors’ practical needs for speed, reliability, and specification consistency.

🚀 Multi-Year Growth Drivers

  • Housing repair-and-remodeling and rebuilding demand: Demand for structural and panelized wood products is supported by long-lived building stock turnover and ongoing renovation cycles.
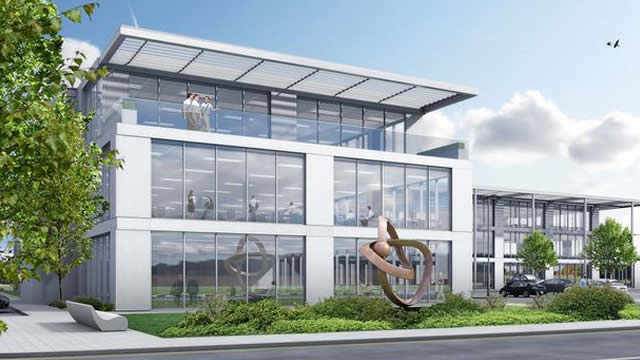
  • Non-residential construction and specialty building applications: Engineered wood applications benefit from design flexibility, faster construction timelines, and consistent performance standards.
  • Light-wood substitution and engineered product preference: Competitive advantages can shift toward engineered wood components when builders seek performance predictability, supply continuity, and design efficiency.
  • Distribution share gains through service density: Scale in purchasing and delivery coverage can enable incremental share capture within fragmented local markets, particularly when competitors are less able to balance inventory positioning across regions.
  • Operational and capacity discipline: Over a multi-year horizon, improvements in yields, recovery, and plant utilization expand earnings power even without fundamental market growth.

The total addressable market expands with construction activity and renovation demand, while BCC’s ability to convert that demand into returns depends on sustaining cost-competitive manufacturing and maintaining distribution service levels.

⚠ Risk Factors to Monitor

  • Commodity cycle exposure: Wood products can experience sharp swings due to housing starts, remodeling activity, and changes in broader construction demand.
  • Input-cost and fiber availability risk: Changes in log/fiber supply and cost competitiveness can compress spreads, especially when demand weakens faster than input costs adjust.
  • Capacity and operating leverage: Underutilization can materially impact margins in energy- and labor-intensive manufacturing operations.
  • Environmental and regulatory compliance: Permitting, emissions controls, and waste-handling requirements can increase sustaining capital expenditures.
  • Freight and logistics volatility: Fuel and transportation cost changes can erode delivered-cost advantages for both manufacturing and distribution.
  • Substitution risk: Incremental adoption of alternative building materials in specific applications can pressure pricing or volumes over time.

📊 Valuation & Market View

The market typically values companies like BCC using metrics that reflect cyclicality and operating leverage—most commonly EV/EBITDA and earnings power measures, with attention to working-capital needs due to inventory and demand swings. For wood-products businesses, valuation sensitivity is driven by expected capacity utilization, margin structure (fiber-to-product spreads and conversion efficiency), and the durability of distribution economics.

Key valuation “drivers that move the needle” tend to include: sustainable operating costs, product-mix improvements, the stability of delivered pricing versus input costs, and evidence of disciplined capital allocation through downturns rather than volume chasing.

🔍 Investment Takeaway

BCC offers a structurally competitive position in North American wood products through geographic cost advantage, logistics-enabled distribution, and manufacturing execution. The long-term thesis rests on the ability to convert fiber into specification-relevant products and to deliver those products efficiently to job sites—supporting resilience relative to less well-located or less service-oriented competitors, even as the underlying construction cycle varies.


⚠ AI-generated — informational only. Validate using filings before investing.

📰 Market News & Coverage

15 Stories Available

Real-time institutional reporting and market updates for BCC.

zacks.com2026-06-03

Why Is Boise Cascade (BCC) Down 4% Since Last Earnings Report?

Boise Cascade (BCC) reported earnings 30 days ago. What's next for the stock?

fool.com2026-05-24

Boise Cascade Stock Is Down 23%. One Investor Just Trimmed $27 Million

Boise Cascade supplies engineered wood products and building materials to construction markets across the U.S. and Canada.

seekingalpha.com2026-05-05

Boise Cascade Company (BCC) Q1 2026 Earnings Call Transcript

Boise Cascade Company (BCC) Q1 2026 Earnings Call Transcript

businesswire.com2026-05-04

Boise Cascade Company Reports First Quarter 2026 Results

BOISE, Idaho--(BUSINESS WIRE)--Boise Cascade Company ("Boise Cascade," the "Company," "we," or "our") (NYSE: BCC) today reported net income of $17.8 million, or $0.50 per share, on sales of $1.5 billion for the first quarter ended March 31, 2026, compared with net income of $40.3 million, or $1.06 per share, on sales of $1.5 billion for the first quarter ended March 31, 2025. “In the first quarter of 2026, our businesses delivered solid results despite the current demand environment, influenced.

businesswire.com2026-04-30

Boise Cascade Company Announces Quarterly Dividend of $0.22 Per Share

BOISE, Idaho--(BUSINESS WIRE)--Boise Cascade Company's (Boise Cascade or the Company) (NYSE: BCC) Board of Directors declared a quarterly dividend of $0.22 per share to holders of its common stock. The dividend will be paid on June 17, 2026 to stockholders of record on June 1, 2026. Future dividend declarations, including amount per share, record date and payment date, will be made by the board of directors and will depend upon, among other things, legal capital requirements and surplus, the Co.

gurufocus.com2026-04-29

A Look at Boise Cascade Co (BCC) After 4.4% Decline -- GF Value $99.07 vs Price $79.00

On April 29, 2026, Boise Cascade Co (BCC) shares fell 4.4% to a current price of $79.00. The stock has seen a 52-week range between $65.14 and $97.67, highlight

wsj.com2026-04-28

The Plywood Smuggling Ring That Ensnared a Building-Products Giant

Boise Cascade pleaded guilty to a federal charge of selling Chinese plywood that was sneaked into Florida to avoid duties.

businesswire.com2026-04-21

Boise Cascade Company First Quarter 2026 Earnings Webcast and Conference Call

BOISE, Idaho--(BUSINESS WIRE)--Boise Cascade Company (NYSE: BCC) will host a webcast and conference call to discuss first quarter 2026 earnings on Tuesday, May 5, 2026, at 11 a.m. Eastern. To join the webcast, go to the Investors section of our website at www.bc.com/investors and select the Event Calendar link. Analysts and investors who wish to ask questions during the Q&A session can register for the call here. The archived webcast will be available in the Investors section of Boise Casca.

businesswire.com2026-04-09

Boise Cascade Named One of the Most Trustworthy Companies in America in 2026

BOISE, Idaho--(BUSINESS WIRE)--Boise Cascade Company (NYSE: BCC) was recently named one of the Most Trustworthy Companies in America in 2026 by Newsweek. The list of winners spans 23 industries and recognizes 700 leading companies that have demonstrated exceptional trustworthiness in the eyes of consumers, employees, and investors. Boise Cascade ranked in the Top 12 within its industry. “It is an incredible honor to be recognized as one of the Most Trustworthy Companies in America,” said Jeff S.

defenseworld.net2026-04-04

SG Americas Securities LLC Has $2.57 Million Position in Boise Cascade, L.L.C. $BCC

SG Americas Securities LLC boosted its stake in shares of Boise Cascade, L.L.C. (NYSE: BCC) by 890.3% during the fourth quarter, according to the company in its most recent filing with the Securities and Exchange Commission (SEC). The firm owned 34,977 shares of the construction company's stock after acquiring an additional 31,445 shares

zacks.com2026-03-25

Why Is Boise Cascade (BCC) Down 15.1% Since Last Earnings Report?

Boise Cascade (BCC) reported earnings 30 days ago. What's next for the stock?

247wallst.com2026-03-17

Top Chemicals Stocks to Watch: ECL, EMN, and BCC

Not every chemicals and materials stock is created equal. Some are firing on all cylinders with record results and confident forward guidance.

defenseworld.net2026-03-16

Cinctive Capital Management LP Makes New $4.21 Million Investment in Boise Cascade, L.L.C. $BCC

Cinctive Capital Management LP purchased a new position in shares of Boise Cascade, L.L.C. (NYSE: BCC) during the third quarter, according to its most recent disclosure with the Securities and Exchange Commission. The institutional investor purchased 54,498 shares of the construction company's stock, valued at approximately $4,214,000. Cinctive Capital Management LP owned approximately

zacks.com2026-03-13

New Strong Sell Stocks for March 13th

ACIW, BCC and BCAL have been added to the Zacks Rank #5 (Strong Sell) List on March 13th, 2026.

defenseworld.net2026-03-10

Dimensional Fund Advisors LP Buys 58,131 Shares of Boise Cascade, L.L.C. $BCC

Dimensional Fund Advisors LP lifted its position in Boise Cascade, L.L.C. (NYSE: BCC) by 2.6% in the third quarter, according to its most recent Form 13F filing with the SEC. The firm owned 2,280,347 shares of the construction company's stock after purchasing an additional 58,131 shares during the period. Dimensional Fund Advisors LP

📊 AI Financial Analysis

Powered by StockMarketInfo
Earnings Data: Q Ending 2026-03-31

"BCC (as reported for 2026-03-31, Q1 2026) generated revenue of $1.50B and net income of $17.8M, translating to EPS of $0.50. Revenue was up +2.9% QoQ (vs. $1.46B in 2025-12-31) but down -2.4% YoY (vs. $1.54B in 2025-03-31). Net income improved +104.3% QoQ (from $8.7M in Q4 2025) but fell -55.8% YoY (from $40.3M in Q1 2025). Profitability softened: net margin declined to 1.19% from 1.90% QoQ and from 2.63% YoY, indicating margin contraction despite higher top-line QoQ. Cash flow deteriorated materially in the quarter: operating cash flow was -$16.0M and free cash flow was -$16.0M, alongside a decline in cash balance to $338.7M (from $477.2M). Financing cash flow was also negative (notably share repurchases of -$65.5M and dividends of -$10.4M), consistent with shareholder-return activity even as earnings weakened. Shareholder returns: the stock price is $83.04 with 1-year change of -10.41% (no momentum boost). With a small dividend yield (~0.38%) and recent negative price performance, total shareholder return is likely below peers/market recently. Analyst consensus targets ($103) imply upside of ~24% from $83.04."

Revenue Growth

Fair

Revenue +2.9% QoQ but -2.4% YoY, indicating a mild sequential improvement that is not translating into sustained year-over-year growth.

Profitability

Caution

Net income +104.3% QoQ but -55.8% YoY; net margin contracted to 1.19% (from 0.60% in Q4 2025 is higher QoQ, but from 2.63% YoY is lower). Overall profitability trend is weaker YoY.

Cash Flow Quality

Neutral

Operating cash flow turned negative (-$16.0M) and free cash flow was -$16.0M in Q1 2026, and cash declined to $338.7M despite ongoing capital returns.

Leverage & Balance Sheet

Neutral

Balance sheet appears stable in leverage terms: total debt is lower QoQ ($91.4M vs. $522.2M) and equity remains substantial ($2.02B). Liquidity weakened as cash fell QoQ.

Shareholder Returns

Caution

Capital returns continued (repurchases -$65.5M; dividends -$10.4M), but market performance is negative over 1Y (-10.41%). Dividend yield is modest (~0.38%).

Analyst Sentiment & Valuation

Positive

Consensus target is $103 vs. $83.04 current (~+24% upside). Despite weaker earnings, the valuation/expectations backdrop appears supportive.

Disclaimer:This analysis is AI-generated for informational purposes only. Accuracy is not guaranteed and this does not constitute financial advice.

Fundamentals Overview

Loading fundamentals overview...

BCC’s Q1 2026 results show sharp earnings compression despite modest sales declines (-2% consolidated; -1% BMD; -4% Wood Products) as margins were hit by EWP pricing pressure and unfavorable cost/margin leverage. Gross margin fell 30 bps YoY to 14.4%, while BMD EBITDA margin dropped to 3.5% (down 100 bps YoY). Wood Products EBITDA also fell to $32M as EWP sales prices declined ~7% YoY and per-unit conversion costs rose, partially offset by lower OSB costs. The company remains operationally adaptive: weather-driven distribution closures (35 days in Jan-Feb) created fixed-cost pressure and surcharge timing delays. Management guided Q2 with broad EBITDA ranges—BMD $65M-$80M and Wood Products $32M-$47M—explicitly tying the midpoint to sustaining daily pace and cost/margin assumptions. Key risks are uneven rate-sensitive demand, EWP competitiveness, and freight/logistics constraints, with import/tariff dynamics (Brazil and IEEPA) potentially shifting plywood supply and pricing.

AI IconGrowth Catalysts

  • Restart of operations at the Oakdale mill in Q4 2025 driving higher Q1 plywood volume (+10% YoY to 373 million feet) and improved plywood pricing vs sequential (+4%)
  • Seasonal demand improvements and channel restocking ahead of spring increasing sequential I-joists (+16% volume) and LVL (+8% volume)
  • EWP order file strength with continued sequential volume growth expected (mid-single digits) and strong “2 solid week” order file carried through April/May
  • BMD initiatives: home center special order business grew double digits, Door segment gaining market share and pushing into manufactured housing (double-digit Q1 growth)
  • Digital/e-commerce: e-commerce sales up 57% in Q1

Business Development

  • No named customers/partners explicitly disclosed; management references ongoing direct-vs-warehouse shifts with channel partners and homebuilders, plus supplier price actions across multiple general line categories
  • Brazilian plywood/wood inflows expected to resume with port arrivals showing incremental movement already, though delayed by a phenol disruption at a Brazilian manufacturing site

AI IconFinancial Highlights

  • Reported net income of $17.8 million ($0.50 EPS) vs $40.3 million ($1.06 EPS) in Q1 2025; consolidated sales $1.5 billion (-2% YoY)
  • BMD Q1 sales $1.4 billion (-1% YoY); Wood Products segment sales $398.2 million (-4% YoY) with Wood Products EBITDA $32.0 million (-$8.2 million vs $40.2 million YoY)
  • BMD gross margin 14.4% (-30 bps YoY) driven by EWP competitive pricing pressure and lower general line margins
  • BMD EBITDA margin 3.5% (-100 bps vs 4.5% YoY; -60 bps vs 4.1% sequentially) impacted by lower gross margins and reduced operating expense leverage from branch closures
  • EWP sales price -7% YoY in Q1; flat sequentially; EWP conversion costs higher per unit offset partially by lower OSB costs
  • Weather-related distribution disruptions: Southeast/Northeast distribution centers closed 35 combined days in Jan-Feb impacting sales pace (daily ~$21M Jan/Feb vs rebounding to ~$24M in March)
  • Brazil import dynamics: Brazilian imports -60% YoY in Q1; management expects increased imports after late-Feb Supreme Court decision validating IEEPA tariffs

AI IconCapital Funding

  • Capex $40 million in Q1 (BMD $23M; Wood Products $17M); full-year capex range maintained at $150 million to $170 million
  • Shareholder returns: dividends $10 million in Q1; Board approved $0.22/share quarterly dividend paid mid-June
  • Share repurchases: ~$91 million through first 4 months 2026, including ~$66 million in Q1
  • Repurchase authorization remaining: ~$148 million as of today
  • No new debt figures disclosed in the transcript; management emphasized utilization of cash for seasonal working capital, planned capex, and shareholder returns

AI IconStrategy & Ops

  • Branch closure and weather disruption: acknowledged fixed-cost pressure from 38 days of closures (Q&A) and timing delays in fuel surcharge recovery
  • Freight optimization: management described daily load optimization and spreading freight load via operational planning on the BMD side
  • Channel strategy: described BMD’s reliance on warehouse/direct and noted macro uncertainty driving more reliance on distribution (warehouse business continuing to be “very strong”)
  • EWP channel/inventory posture: channel partners increased inventory but are still below the high end of target range; continuing reliance on “2-step” distribution
  • Thorsby production ramp: Thorsby line in Q2 for product testing and certifications; sellable product expected beginning of Q3; production volume to be throttled by demand

AI IconMarket Outlook

  • Q2 2026 EBITDA guidance: BMD $65M to $80M; Wood Products $32M to $47M
  • BMD assumptions/guidance details: current daily sales pace ~15% above Q1 pace ($22M/day reference); gross margins expected 14.25% to 15%; if sales pace sustained, management expects healthy sequential improvement in EBITDA margin
  • Wood Products assumptions: EWP order files showing seasonal strength; EWP volumes expected to increase mid-single digits sequentially; EWP pricing flat to low single-digit decline sequentially
  • Plywood assumptions: sequential plywood volume increases mid-single digits; quarter-to-date plywood realizations 8% above Q1 average with remaining quarter dependent on market

AI IconRisks & Headwinds

  • Demand uncertainty from volatile mortgage rates and geopolitical turmoil; limited 2026 visibility; builder “thoughtful approaches” to starts, home sizes, location, and inventory
  • Single-family starts muted; rate-sensitive and uneven end-demand conditions risk continued pricing pressure and reduced operating leverage
  • EWP competitive pricing pressure: management cited regional competitive chatter and that pricing stability is “strategic” rather than reflecting absence of pressure
  • Freight/cost inflation and logistics constraints: diesel rose significantly; truck/driver shortages tied to tight immigration policies; resin price increases in the ~10% range late Q1 activity
  • Import/tariff dynamics risk: expected higher import volumes following late-Feb Supreme Court decision could influence plywood market dynamics; Brazilian imports already declined YoY but management expects more inflow later

Q&A: Analyst Interest

  • Topic: Brazilian plywood/wood import timing and whether port activity has started influencing pricing; Management's detailed response: Management confirmed port activity is beginning (“quotes show up,” and some product has appeared) but not enough yet to move markets materially. They attributed delays to a phenol disruption in Brazil and expected incremental arrivals in coming months.
  • Topic: Why EWP pricing was flat sequentially in Q1 despite peer mid-single-digit declines; Management's detailed response: Management said pricing stability since Q3 is not due to weaker demand or no competitive pressure. They emphasized regional pricing pressure, homebuilder affordability concerns, and using selective quoting backed by strong order files while leaning into service rather than price.
  • Topic: Q2 EBITDA range drivers (top vs bottom end) and linkage to daily sales pace/midpoint margins; Management's detailed response: Management highlighted two months remaining with uncertain end-market vs channel replenishment and volatile input costs. For BMD, if the current sales pace is sustained and margins land near the midpoint, EBITDA should reach the midpoint range, translating to low-70s EBITDA and mid-4% EBITDA margin.

Sentiment: CAUTIOUS

Note: This summary was synthesized by AI from the BCC Q1 2026 earnings transcript. Financial data is complex; please verify all metrics against official SEC filings before making investment decisions.

📋 Official Regulatory 10-K / 10-Q SEC Filings

Direct authenticated documentation links to audited SEC database reports for BCC.

SEC EDGAR Live Feed
Loading financial data and tables...
📁

SEC Filings (BCC)

© 2026 Stock Market Info — Boise Cascade Company (BCC) Financial Profile