Beazer Homes USA, Inc.

Beazer Homes USA, Inc. (BZH) Market Cap

Beazer Homes USA, Inc. has a market capitalization of $877.4M.

Price: $32.10

-0.49 (-1.50%)

Market Cap: 877.42M

NYSE · time unavailable

CEO: Allan Merrill

Sector: Consumer Cyclical

Industry: Residential Construction

IPO Date: 1994-02-23

Website: https://www.beazer.com

Beazer Homes USA, Inc. (BZH) - Company Information

Market Cap: 877.42M|Sector: Consumer Cyclical

Company Profile

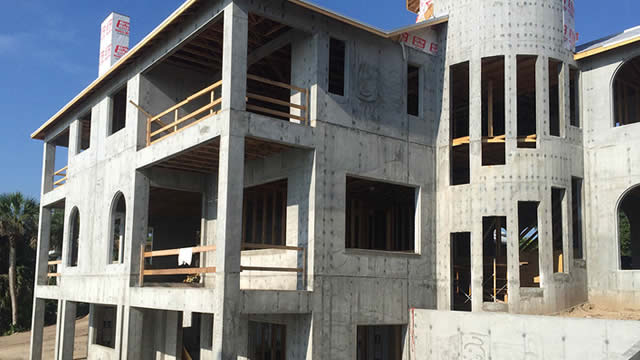
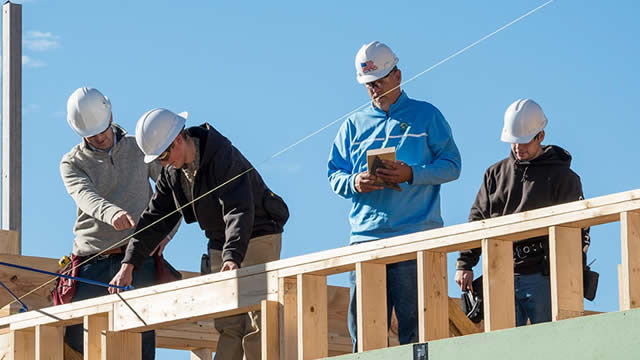
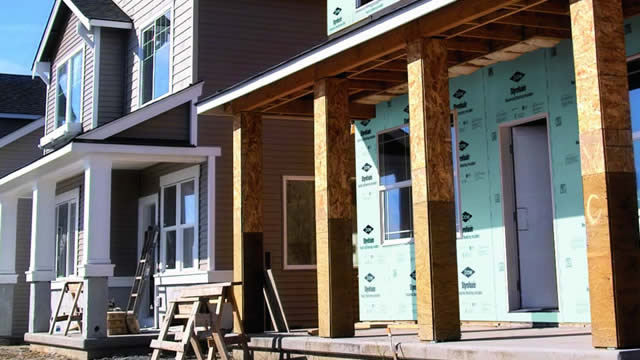
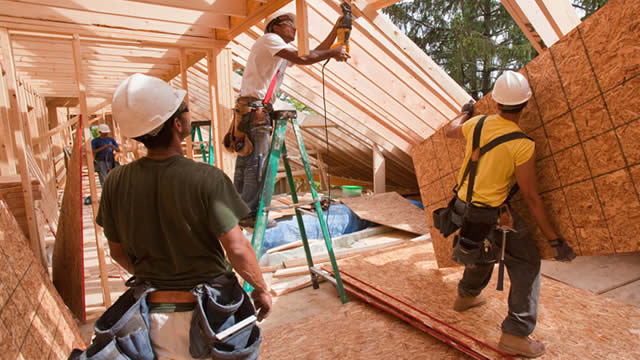
Beazer Homes USA, Inc. operates as a residential property developer and builder across the United States. The company is responsible for the planning, construction, and marketing of both detached and attached dwellings, which are sold under its distinct brands: Beazer Homes, Gatherings, and Choice Plans. Its properties are marketed through commissioned in-house sales consultants and external real estate agents. Beazer Homes' operational footprint covers a wide geographical area, including Arizona, California, Nevada, Texas, Delaware, Maryland, Indiana, Tennessee, Virginia, Florida, Georgia, North Carolina, and South Carolina. Founded in 1985, the company maintains its corporate headquarters in Atlanta, Georgia.

Analyst Sentiment

77%
Strong Buy

From 2 Active Polls

1Y Forecast: $41.00

▲ +27.7% Potential Upside

Consensus Target Metrics

Low Bound

$37

Median

$41

High Bound

$45

Average

$41

Price & Moving Averages

Loading chart...

🎯 Wall Street Analyst Intelligence Report

1-Year structural target targets, chart projections, and sentiment maps.

Average 1Y Target
$41.00
▲ +27.73% Upside
Low Target
$37.00
15% Risk
Median Target
$41.00
28% Mid
High Target
$45.00
40% Max
Consensus
Hold
8 / 21 Buys

Consensus Trend Projection

Trailing closures vs. 12-month metrics map.

Analyst Vote Distribution

Aggregate institutional coverage sentiment weights.

📊 Historical Valuation Multiples

Real-time Trailing Twelve Month (TTM) momentum side-by-side with discrete quarterly metrics.

Fiscal QuarterTTMQ1 2026Q4 2025Q3 2025Q2 2025Q1 2025Q4 2024Q3 2024Q2 2024
Period EndingTrailing 12MMar 31, 2026Dec 31, 2025Sep 30, 2025Jun 30, 2025Mar 31, 2025Dec 31, 2024Sep 30, 2024Jun 30, 2024
Market Cap ($M)8775395867136596148351,044814
Enterprise Value ($M)2,0121,6731,6381,5741,7301,6301,8461,8851,831
Price to Earnings Ratio (P/E)-224.01-148.92-4.485.96-508.4112.1468.65-2.977.49
Price/Earnings-to-Growth Ratio (PEG)-11.680.130.59-0.080.75
Price to Sales Ratio (P/S)0.421.311.610.901.211.091.781.291.37
Price to Book Ratio (P/B)0.770.460.490.570.540.500.680.850.69
Price to Free Cash Flow Ratio (P/FCF)-12.59-7.55-3.432.94-9.38-139.23-5.085.81-9.19
Enterprise Value to Sales (EV/Sales)4.084.511.993.172.883.942.343.07
Enterprise Value to EBITDA (EV/EBITDA)1224.81-115.80-60.6249.33154.4787.90255.6428.6656.13
Debt to Equity Ratio690.781.070.980.860.950.900.880.850.93

📘 Full Research Report

ℹ️

AI-Generated Research: This report is for informational purposes only.

📘 BEAZER HOMES INC (BZH) — Investment Overview

🧩 Business Model Overview

Beazer Homes is a U.S. residential homebuilder that creates housing inventory by acquiring or controlling land, performing land development, and constructing homes for sale to end customers. The value chain spans (1) land sourcing and entitlement, (2) development and infrastructure build-out, (3) construction and procurement, and (4) sales and closing.

Homebuilding economics are driven by the relationship between production pace, selling prices, and cost discipline. Revenue is largely transactional—driven by closings—so operating leverage depends on maintaining construction throughput and managing incentives and material/labor costs across the housing cycle.

💰 Revenue Streams & Monetisation Model

The company’s monetisation model is primarily transactional through home closings. Profitability reflects the spread between home selling prices and (a) land and development costs, (b) construction/material and labor costs, and (c) selling and overhead.

Key margin drivers include:

  • Gross margin sensitivity to pricing and incentive levels: when demand softens, builders often increase incentives, compressing margins.
  • Construction efficiency: faster absorption, shorter build times, and standardized execution can improve cost per home.
  • Land cost basis and write-down discipline: land strategy and inventory management strongly influence downside protection.

🧠 Competitive Advantages & Market Positioning

Homebuilders do not typically exhibit classic “switching costs” or durable network effects. Beazer’s structural edge is better characterized as cost and execution moats, reinforced by land control and operating focus—advantages that can persist through cycles when capital and execution discipline are consistent.

  • Land and Lot-Position Advantage: controlled land positions and development timing can reduce uncertainty versus builders that rely more heavily on spot acquisitions at unfavorable pricing.
  • Operational Cost Advantage: procurement scale, construction process discipline, and repeatable floorplans can lower per-home costs.
  • Local Market Execution: focusing on specific geographies can improve subcontractor relationships, permitting familiarity, and sales efficiency.

Competitive benchmarking (primary rivals):

  • Lennar
  • PulteGroup
  • D.R. Horton

Compared with larger diversified peers such as Lennar, PulteGroup, and D.R. Horton, Beazer is generally viewed as a more execution- and risk-management-oriented operator. Larger rivals often benefit from broader footprint and scale in land purchasing and overhead absorption, while Beazer’s positioning hinges on managing local inventory quality, maintaining cost discipline, and matching product to demand segments within targeted markets.

🚀 Multi-Year Growth Drivers

Over a 5–10 year horizon, growth in housing is supported by demographic and affordability dynamics, but profitability hinges on cycle management. Sustainable drivers include:

  • U.S. household formation and housing replacement needs: long-run demand support for new construction and modernization.
  • Affordability-driven product strategy: the ability to align home design, community locations, and financing partnerships to buyer demand.
  • Operating leverage from process improvements: reducing construction friction, improving schedule reliability, and tightening cost controls can compound through cycles.
  • Geographic and lot selection discipline: selective land control can support better margins by managing land basis and avoiding overbuilt neighborhoods.

⚠ Risk Factors to Monitor

  • Housing cycle volatility: demand swings can force incentive increases and reduce selling velocity.
  • Construction cost inflation (materials and labor): rapid cost increases may not fully pass through to selling prices.
  • Land and inventory risk: mis-timed land purchases or impaired inventory can lead to margin dilution via write-downs.
  • Interest-rate and mortgage availability sensitivity: homebuyer affordability and demand can shift with credit conditions.
  • Regulatory and permitting constraints: changes to building codes, land-use rules, or local permitting capacity can affect build schedules and costs.

📊 Valuation & Market View

Equity valuation in homebuilding typically centers on earnings power rather than long-duration growth assumptions. Market participants often anchor on metrics such as EV/EBITDA and P/E tied to cyclical profitability, and also consider price-to-earnings sensitivity to housing starts and margins.

Drivers that can move valuation multiples include:

  • Gross margin trajectory: pricing power versus incentive levels and cost containment.
  • Balance-sheet and liquidity strength: ability to absorb down-cycle pressure without forced land liquidation.
  • Quality of land pipeline: inventory mix, land basis discipline, and risk-managed development timing.
  • Return profile (through-cycle): consistency in converting revenue into durable cash flow despite cycle swings.

🔍 Investment Takeaway

Beazer Homes’ long-term investment case rests on its ability to sustain cost and execution discipline—not on durable product switching or network effects. The core thesis is that land control, construction process efficiency, and disciplined inventory management can preserve margins and cash flow through housing cycles better than less disciplined competitors, supporting attractive compounding when demand conditions normalize.


⚠ AI-generated — informational only. Validate using filings before investing.

📰 Market News & Coverage

15 Stories Available

Real-time institutional reporting and market updates for BZH.

businesswire.com2026-07-20

Beazer Homes USA, Inc. to Webcast Its Fiscal Third Quarter Results Conference Call on Monday, August 10, 2026

ATLANTA--(BUSINESS WIRE)--Beazer Homes (NYSE: BZH) (www.beazer.com) has scheduled the release of its financial results for the quarter ended June 30, 2026 on Monday, August 10, 2026 after the close of the market. Management will host a conference call on the same day at 5:00 PM ET to discuss the results.The public may listen to the conference call and view the Company's slide presentation on the "Investor Relations" page of the Company's website, www.beazer.com. In addition, the conference call.

zacks.com2026-07-13

Landmark Housing Affordability Bill Becomes Law: ETFs in Focus

The new U.S. housing law could boost homebuilding and housing stocks, putting homebuilder ETFs like ITB and XHB in focus.

zacks.com2026-07-10

Beazer (BZH) Moves 13.1% Higher: Will This Strength Last?

Beazer (BZH) was a big mover last session on higher-than-average trading volume. The latest trend in earnings estimate revisions might not help the stock continue moving higher in the near term.

fool.com2026-07-10

Why Beazer Homes Stock Was Zooming Higher This Week

Although this was rejected, Beazer revealed that there are other would-be buyers in the mix. This is a takeover story that has been developing for months.

globenewswire.com2026-07-09

Donerail, One of the Largest Stockholders of Beazer Homes, Issues Open Letter to Board on DFH's Revised Offer

Urges the Board to Engage with DFH and Other Bona Fide Prospective Acquirors Following DFH's Revised $32.00 Per Share All-Cash Offer

businesswire.com2026-07-08

Beazer Homes Responds to Dream Finders Homes' Latest Public Statements

ATLANTA--(BUSINESS WIRE)--Beazer Homes USA, Inc. (NYSE: BZH) (“Beazer” or the “Company”) today issued the following statement in response to a press release issued by Dream Finders Homes (NYSE: DFH) (“Dream Finders”): Following Dream Finders' proposal to acquire Beazer for $25.75 per share in cash, made public on May 11, 2026, the Company has received interest from additional parties regarding a range of potential transactions. Beazer's Board of Directors, in consultation with its financial and.

barrons.com2026-07-08

Beazer Stock Soars as Dream Finders Makes Fifth Bid for Home Builder

Dream Finder Homes raises its offer for smaller rival Beazer Homes to $32 a share after several failed attempts.

businesswire.com2026-06-23

Beazer Homes Announces Closing of Offering of $400 Million Senior Unsecured Notes due 2032

ATLANTA--(BUSINESS WIRE)--Beazer Homes USA, Inc. (NYSE: BZH) (the “Company”) announced today the completion of its previously-announced offering of $400 million aggregate principal amount of 8.000% Senior Unsecured Notes due 2032 (the “Notes”). The Notes were offered in a private offering that was exempt from the registration requirements of the Securities Act of 1933, as amended (the “Securities Act”). The net proceeds of the offering will be used to finance the redemption of the Company's 5.8.

businesswire.com2026-06-15

Beazer Homes Announces Pricing of Offering of $400 Million of Senior Unsecured Notes due 2032

ATLANTA--(BUSINESS WIRE)--Beazer Homes USA, Inc. (NYSE: BZH) (the “Company”) today priced an offering of $400 million aggregate principal amount of 8.000% Senior Unsecured Notes due 2032 (the “Notes”) at par. The Notes are being offered in a private offering that is exempt from the registration requirements of the Securities Act of 1933 (the “Securities Act”). The Company is offering the Notes to qualified institutional buyers in accordance with Rule 144A or outside the United States to non-U.S.

businesswire.com2026-06-15

Beazer Homes Announces Proposed Offering of $400 Million of Senior Unsecured Notes Due 2032

ATLANTA--(BUSINESS WIRE)--Beazer Homes USA, Inc. (NYSE: BZH) (the “Company”) announced today that it is proposing to issue $400 million aggregate principal amount of Senior Unsecured Notes due 2032 (the “Notes”) in a private offering that is exempt from the registration requirements of the Securities Act of 1933, as amended (the “Securities Act”). The Company intends to offer the Notes to qualified institutional buyers in accordance with Rule 144A or outside the United States to non-U.S. person.

businesswire.com2026-05-21

Dream Finders Homes Releases Investor Presentation to Reaffirm Acquisition Proposal for Beazer Homes and Opportunity to Create Value for Shareholders

JACKSONVILLE, Fla.--(BUSINESS WIRE)--Dream Finders Homes, Inc. (“Dream Finders”, “DFH”) (NYSE: DFH), today made available an investor presentation in connection with its proposal to acquire Beazer Homes USA, Inc. (“Beazer”, “Beazer Homes”) (NYSE: BZH). The investor presentation is available at announcement.dreamfindershomes.com and will be filed with the U.S. Securities and Exchange Commission. On May 5, 2026, Dream Finders submitted a proposal to acquire Beazer Homes in an all-cash transaction.

prnewswire.com2026-05-19

Beazer Homes Redefines Housing Affordability by Lowering the Total Cost of Homeownership

New analysis shows Beazer homeowners could save up to $479 per month through lower utility bills, mortgage rates and insurance premiums ATLANTA, May 19, 2026 /PRNewswire/ -- Beazer Homes is redefining what affordability means for today's homebuyer by focusing on the total cost of homeownership – not just the purchase price. As rising interest rates, insurance premiums and utility costs continue to pressure household budgets, Beazer has built its business around helping homeowners spend less every month after they move in.

fool.com2026-05-12

Stock Market Today (LIVE): Inflation Roars Back as Tech Retreats; eBay Shoots Down GameStop Offer

Top insights from the latest market news from Tuesday, May 12, from The Motley Fool analysts on Team Rule Breakers and Team Hidden Gems.

businesswire.com2026-05-11

Beazer Homes Announces Rejection of Unsolicited Proposals from Dream Finders Homes

ATLANTA--(BUSINESS WIRE)--Beazer Homes USA, Inc. (NYSE: BZH) (“Beazer” or the “Company”) today confirmed that its Board of Directors (the “Beazer Board”), with the assistance of its financial and legal advisors, has evaluated and rejected multiple unsolicited, non-binding proposals from Dream Finders Homes, Inc. (NYSE: DFH) (“Dream Finders”) to acquire all of the outstanding shares of Beazer. In evaluating the proposals, the Beazer Board determined that they significantly undervalued the Compan.

gurufocus.com2026-05-11

Beazer Homes (BZH) Surges on Dream Finders Homes (DFH) Acquisition Proposal

Beazer Homes (BZH) is experiencing a significant increase in its stock price following an unsolicited, all-cash acquisition proposal from Dream Finders Homes (D

📊 AI Financial Analysis

Powered by StockMarketInfo
Earnings Data: Q Ending 2026-03-31

"BZH reported Q2 2026 (ended 2026-03-31) revenue of $409.8M and net income of $32.6M. Despite an EPS figure reported as negative (-$0.03), net income was positive with a net profit margin of ~7.9% (operating margin remained negative at ~-4.6%), indicating a non-operating swing drove the quarter’s bottom line. QoQ, revenue rose from $363.5M (2025-12-31) to $409.8M (+12.8%). Net income swung from a loss of -$32.6M in Q1 2026 to +$32.6M in Q2 2026 (turnaround of $65.2M). YoY, revenue declined versus $565.3M (2025-03-31) (-27.5%), while net income increased from $12.8M in the year-ago quarter to $32.6M (+154.7%). Over the four reported quarters, profitability was volatile: Q4 2025 and Q2 2025 were profitable, but Q1 2026 and parts of mid-2025 were loss-making; Q2 2026 shows improved bottom-line momentum even as operating results remain weak. Cash flow quality was inconsistent: operating cash flow was -$63.5M and free cash flow was -$71.3M in Q2 2026, with cash down slightly QoQ (-3.2%). On balance sheet, equity is solid at ~$1.17B and net debt is negative (net cash position of ~$-116M), supporting resilience. From a shareholder returns standpoint, the stock is up +23.4% over the past year (1y_change), and no dividend is indicated; without reliable buyback/dividend totals to quantify, total return appears driven primarily by capital appreciation. Analyst consensus targets ($41) are below the ~$22.13 current price reference, implying conservative expectations rather than overvaluation risk."

Revenue Growth

Neutral

QoQ revenue rose +12.8% ($363.5M to $409.8M) but YoY revenue fell -27.5% ($565.3M to $409.8M), showing a weakening annual trend despite a near-term rebound.

Profitability

Neutral

Net income turned positive QoQ (from -$32.6M to +$32.6M) and improved YoY (+154.7% from $12.8M). However, operating margin stayed negative in Q2 2026 (~-4.6%), indicating profitability is not yet consistently strong at the operating level.

Cash Flow Quality

Fair

Q2 2026 operating cash flow was -$63.5M and free cash flow -$71.3M, a deterioration vs Q1 2026 (-$165.3M) but still negative. Cash declined slightly QoQ, suggesting earnings are not fully translating into cash in the near term.

Leverage & Balance Sheet

Good

Equity improved/stabilized around ~$1.17B and the company is in a net cash position (net debt ~- $116M). Total debt is reported as 0 and liabilities remain manageable relative to equity, supporting balance-sheet resilience.

Shareholder Returns

Good

Capital appreciation looks supportive: 1y_change is +23.36% (>20% threshold). No dividend is indicated; buybacks are present but not quantified here, so total return is likely momentum-led.

Analyst Sentiment & Valuation

Positive

Consensus target ($41) vs current price context (~$22.13) implies meaningful upside. However, valuation ratios are not straightforward given negative/unstable cash flow and operating margins across the period.

Disclaimer:This analysis is AI-generated for informational purposes only. Accuracy is not guaranteed and this does not constitute financial advice.

Fundamentals Overview

Loading fundamentals overview...

Beazer (BZH) delivered Q2 execution broadly in line with expectations despite weakening demand signals. Sales pace recovered to 2.1 per community per month, and critical mix levers improved: to-be-built reached 43% of gross sales (highest since early 2024) and spec mix fell to 57%, positioning margins to improve in 2H. Management’s gross margin was 15.6% and SG&A came in lower, while GAAP interim tax accounting produced a near-$18 million benefit (no Q3 tax guidance). The key change is guidance caution: management reduced the likelihood of prior full-year EBITDA growth, now targeting sales pace >2 for the balance of the year and margin expansion of 200–300 bps by Q4 (vs earlier 300 bps). Q3 guidance calls for >1,000 home sales, ASP $535k–$540k, and adjusted EBITDA $5M–$10M, with full-year land sales still ~$150M. Capital strategy remains aggressive and accretive: $30M repurchased in Q2, ~$400M liquidity, and a revolver upsized to $525M.

AI IconGrowth Catalysts

  • To-be-built sales mix expanded to 43% of gross sales (highest since 2024), up from 34% of gross sales for new communities starting after March (seq from 24% last quarter), supporting higher ASPs and margins in 2H
  • Spec sales mix continued to move lower to 57% in the quarter (down from 61% in Q1 and well below mid-/high-70% seen in 2025), improving margin trajectory
  • Houston improvement noted as up nicely year-over-year
  • Operational momentum: sales pace recovered to 2.1 per community per month (Q2), with pace increasing from January to February and plateauing in March

Business Development

    AI IconFinancial Highlights

    • Q2 homebuilding revenue: $397.7 million on 757 closings at $525,000 average price
    • Q2 sales pace: 2.1 sales per community per month
    • Homebuilding gross margin: 15.6% (essentially in line with Q1); guided Q4 margin expansion shifted from prior 300 bps to now 200–300 bps as sales environment weakened
    • SG&A: $64 million, ~ $4 million below prior year period
    • Taxes: nearly $18 million benefit due to adjustment in quarterly interim tax treatment (variable GAAP interim taxes; no GAAP tax/earnings guidance for Q3)
    • Diluted loss per share: $(0.03); adjusted EBITDA: $2.6 million
    • Backlog ASP: over $580,000, expected to accelerate ASP trend

    AI IconCapital Funding

    • Repurchases: executed $30 million in Q2; on completion of existing $72 million authorization expected nearly 20% of shares bought back since early fiscal 2025; bought back >1 million shares at ~60% of book value
    • Revolver: upsized and expanded by $160 million to $525 million; extended maturity by two years to March 2030
    • Liquidity: ~$400 million total liquidity including $116 million unrestricted cash and $285 million revolver availability; no maturities until October 2027

    AI IconStrategy & Ops

    • Balance sheet/land efficiency: improve efficiency of land spend, sell non-strategic assets at or above book value, and buy back stock at a meaningful discount to book value while preserving community count growth
    • Controlled-lot strategy: maintained robust lot pipeline with ~60% controlled by options
    • Growth plan: 169 communities at quarter end; targeting >200 active communities by end of fiscal 2027 (sales pace in existing communities + attractiveness of incremental land purchases will determine path)

    AI IconMarket Outlook

    • Macro impact: higher mortgage rates and surging energy costs reduced consumer sentiment; management now expects sales pace >2 for balance of year (instead of earlier 2.5+ objective) and margin expansion between 200 and 300 bps by Q4
    • Q3 guidance: sell >1,000 homes (~+20% vs prior year third quarter) implying sales pace roughly in line with Q2; ~170 active communities (flat to slightly up sequentially); close ~900 homes with ASP $535,000–$540,000 (NY communities higher share)
    • Q3 margin: adjusted homebuilding gross margins up >50 bps sequentially (direct cost savings + mix benefits); SG&A dollars ~flat vs prior year third quarter
    • Q3 land: generate ~$30 million land sale revenue; still expect ~$150 million full-year land sale revenue
    • Q3 adjusted EBITDA: $5 million to $10 million
    • Interest amortization % of homebuilding revenue: ~3%
    • Full-year tax: energy efficiency tax credits expected to drive net tax benefit >$10 million and minimal cash taxes for several years
    • Book value per share: expect further growth in Q3

    AI IconRisks & Headwinds

    • Demand softness: March lacked normal sequential traffic/leads lift; April similar to March, increasing caution on pace and full-year EBITDA growth likelihood
    • Higher mortgage rates and higher energy costs: reduce consumer sentiment and increase mortgage buy-down costs; management expects buy-down cost headwind affecting Q3 and Q4
    • Incentive/spec-start risk: increasing spec starts/incentives could spike revenue temporarily but could burn through valuable option position and undermine payment/efficient-home progress
    • Cancellation rate not a major issue: business typically runs 15%–20% cancellation; no big change observed

    Q&A: Analyst Interest

    • Topic: Long-run and near-term to-be-built mix targets and whether 43% can rise. Management: longer-term desire is majority to-be-built, but not expected immediately; near term focus is steady quarter-over-quarter improvement, excluding typical Q4 spec uptick. 43% is highest since early 2024 and up over 10 points YoY.
    • Topic: Backlog support for margin expansion guidance (200–300 bps) and how specs impact it. Management: backlog margins are supportive for the next two quarters. Shift from prior 300 bps framing reflects expected spec behavior and closures in coming quarters; Q3 has more visibility since it is mid-quarter.
    • Topic: Q3 EBITDA guide ($5M–$10M) and what could drive Q4 ramp / onetime items. Management: no full-year EBITDA guide and no major changes beyond outlined script. Lower sales pace in Q3/Q4 makes operating leverage work against results. Land sales guidance remains ~$150M full year.

    Sentiment: CAUTIOUS

    Note: This summary was synthesized by AI from the BZH Q2 2026 (ended March 31, 2026) earnings transcript. Financial data is complex; please verify all metrics against official SEC filings before making investment decisions.

    📋 Official Regulatory 10-K / 10-Q SEC Filings

    Direct authenticated documentation links to audited SEC database reports for BZH.

    SEC EDGAR Live Feed
    Loading financial data and tables...
    📁

    SEC Filings (BZH)

    © 2026 Stock Market Info — Beazer Homes USA, Inc. (BZH) Financial Profile