Chatham Lodging Trust

Chatham Lodging Trust (CLDT) Market Cap

Chatham Lodging Trust has a market capitalization of $534M.

Price: $11.44

0.14 (1.24%)

Market Cap: 534.03M

NYSE · time unavailable

CEO: Jeffrey H. Fisher

Sector: Real Estate

Industry: REIT - Hotel & Motel

IPO Date: 2010-04-16

Website: https://www.chathamlodgingtrust.com

Chatham Lodging Trust (CLDT) - Company Information

Market Cap: 534.03M|Sector: Real Estate

Company Profile

Chatham Lodging Trust is a self-advised, publicly traded real estate investment trust focused primarily on investing in upscale, extended-stay hotels and premium-branded, select-service hotels. At September, 30, 2020, The company owns interests in 86 hotels totaling 12,040 rooms/suites, comprised of 40 properties it wholly owns with an aggregate of 6,092 rooms/suites in 15 states and the District of Columbia and a minority investment in the Innkeepers joint ventures that owns 46 hotels with an aggregate of 5,948 rooms/suites.

Analyst Sentiment

67%
Buy

From 4 Active Polls

1Y Forecast: $12.50

▲ +9.3% Potential Upside

Consensus Target Metrics

Low Bound

$12

Median

$13

High Bound

$13

Average

$13

Price & Moving Averages

Loading chart...

🎯 Wall Street Analyst Intelligence Report

1-Year structural target targets, chart projections, and sentiment maps.

Average 1Y Target
$12.50
▲ +9.27% Upside
Low Target
$12.00
5% Risk
Median Target
$12.50
9% Mid
High Target
$13.00
14% Max
Consensus
Buy
8 / 13 Buys

Consensus Trend Projection

Trailing closures vs. 12-month metrics map.

Analyst Vote Distribution

Aggregate institutional coverage sentiment weights.

📊 Historical Valuation Multiples

Real-time Trailing Twelve Month (TTM) momentum side-by-side with discrete quarterly metrics.

Fiscal QuarterTTMQ1 2026Q4 2025Q3 2025Q2 2025Q1 2025Q4 2024Q3 2024Q2 2024
Period EndingTrailing 12MMar 31, 2026Dec 31, 2025Sep 30, 2025Jun 30, 2025Mar 31, 2025Dec 31, 2024Sep 30, 2024Jun 30, 2024
Market Cap ($M)534372329328342349438417409
Enterprise Value ($M)964802655674696732845854869
Price to Earnings Ratio (P/E)58.66-21.6017.8323.2415.8856.82-64.0724.5014.92
Price/Earnings-to-Growth Ratio (PEG)0.9330.360.57
Price to Sales Ratio (P/S)1.825.514.864.194.255.095.834.784.73
Price to Book Ratio (P/B)0.750.510.440.440.450.460.580.540.53
Price to Free Cash Flow Ratio (P/FCF)8.3627.8826.8512.8326.8683.3233.838.6316.37
Enterprise Value to Sales (EV/Sales)11.889.678.608.6710.6711.259.8010.05
Enterprise Value to EBITDA (EV/EBITDA)10.4148.6226.2027.8625.8045.2740.9131.0529.64
Debt to Equity Ratio4.640.610.480.480.490.530.560.600.61

CLDT Growth Runway Model

Standard long term linear growth fade

Multi-Stage Discounted Cash Flow Sandbox

Market Price$11.44
Intrinsic Value$11.42
Market Alignment
Overvalued by 0.1%relative to calculated intrinsic value
9.00%
Exp: -1%-1%
i

Growth runway slowdown

This value provides a time window for the growth rate to decline beyond Stage 1 toward the terminal rate. Longer windows are most useful for companies with high growth starting conditions or strong competitive advantages. This option stretches out the growth rate slowdown across 5, 10, or 15-year steps. A high-growth starting condition (exceeding a 25% initial growth rate) automatically applies a curve decay to simulate realistic, rapid market saturation.
i

Terminal growth rate

With long-term inflation between 3-5%, revenue must grow by that baseline to maintain flat real-world market share. This value sets the permanent terminal growth rate to factor into the valuation beyond the growth slowdown runway toward maturity.

3-Stage Financial Runway Horizon

🧠 Perpetuity Horizon Engine (Stage 3: Post-2035)

Terminal FCF Base$0.11B
Perpetuity TV Value$2.13B
Discounted TV (PV)$0.90B
TV Weighting %57.0%
⚠️
Financial Model Disclaimer & Risk Disclosure: This interactive scenario simulator is an educational sandbox provided strictly for informational and analytical research purposes. Core historical financial statements and consensus estimates are sourced directly via Financial Modeling Prep (FMP). All downstream outputs are entirely deterministic, hypothetical projections generated by combining automated mathematical formulas (including linear interpolation and Gaussian bell-curve decay models) with user-selected variables and third-party financial data inputs. Users assume all liability for trading decisions executed based on these sandbox calculations.

📘 Full Research Report

ℹ️

AI-Generated Research: This report is for informational purposes only.

📘 CHATHAM LODGING TRUST REIT (CLDT) — Investment Overview

🧩 Business Model Overview

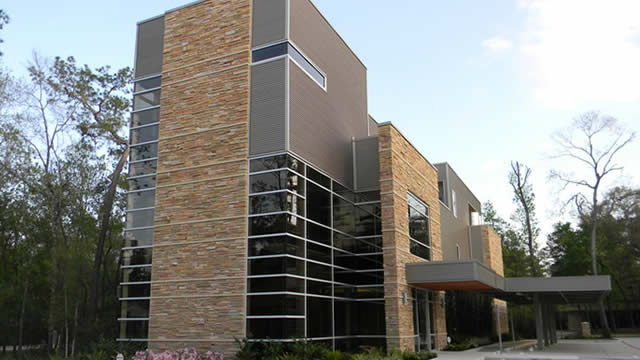
Chatham Lodging Trust is a hotel-focused REIT that owns and manages a portfolio of lodging properties through long-term lease structures with experienced hotel operators. The investment value chain is relatively direct: (1) acquire and develop/renovate hotel real estate in demand-supportive locations, (2) underwrite cash-flow durability through lease terms (often including fixed rent and, in certain cases, revenue-linked components), and (3) monetize the properties primarily through lease payments, with additional rent recovery mechanisms tied to operational performance and reimbursements where applicable. This structure shifts day-to-day operating exposure to third-party tenants while keeping CLDT primarily exposed to property-level fundamentals and tenant credit quality.

💰 Revenue Streams & Monetisation Model

CLDT’s monetisation is dominated by recurring rental income derived from its hotel real estate. Revenue typically includes:

  • Base rent: contractual rent that provides a floor to cash flow.
  • Variable / supplemental rent: where lease structures include participation in hotel revenue streams (commonly tied to metrics such as room revenue or other operating indicators), which can enhance upside during demand expansions.
  • Reimbursements: expense pass-throughs and recoveries that can mitigate inflationary cost pressures depending on lease specifics.
  • Ancillary income: limited supplemental revenues tied to the properties, which generally remain secondary to rent.

Margin drivers in hotel REITs are largely rental yield and the stability of tenant cash flows. When lease terms share upside and when tenant operating leverage improves (via stronger occupancy and pricing power at the property level), AFFO-style cash generation can scale without proportional increases in rent expense—supporting dividend capacity and reinvestment flexibility.

🧠 Competitive Advantages & Market Positioning

For a lodging REIT, the moat is usually less about customer “switching costs” and more about structural cash-flow durability, asset selection, and access to capital. CLDT’s advantages tend to center on:

  • Intangible assets (operator + underwriting relationships): sourcing and structuring hotels with established operating partners can improve lease performance and reduce the probability of prolonged downtime upon lease transitions.
  • Cost advantages (asset management and procurement scale): REIT ownership can standardize renovation planning, operational capital budgeting, and vendor relationships across a portfolio.
  • Durability of income (lease structure + tenant credit discipline): long-duration lease commitments can limit direct exposure to operational execution risk and help stabilize cash flows through cycles—provided tenant balance sheets remain healthy.

Competitive benchmarking (public lodging REITs):

  • Host Hotels & Resorts: broader, higher-profile full-service exposure than CLDT in many markets; competes on scale and brand-adjacent asset base.
  • Park Hotels & Resorts: large, branded portfolio with different market mix and lease/tenant profiles; often competes via premium assets and stronger international/major-market footprints.
  • Pebblebrook Hotel Trust: higher concentration in lifestyle/upscale segments and different geographic and operator dynamics.

CLDT’s positioning is defined by its lodging portfolio construction and underwriting approach—seeking cash-flow stability through leaseable asset quality and tenant structures rather than relying solely on aggressive value-add leverage or concentrated exposure to the most supply-constrained luxury segments.

🚀 Multi-Year Growth Drivers

Over a 5–10 year horizon, growth is typically driven by a mix of macro demand, supply discipline, and reinvestment returns:

  • Travel demand normalization and long-duration demand base: business travel, group events, and leisure travel cycles tend to create recurring room-night demand, supporting rent-linked upside where lease structures participate in revenue.
  • Supply constraints in select markets: hotel supply growth can be slower than demand growth when permitting, construction costs, and financing hurdles rise; this can support occupancy and pricing power at the property level.
  • Renovation and repositioning cycle: capex programs can lift room quality, amenities, and brand alignment—improving market competitiveness and supporting stronger operating metrics that flow through to supplemental rent mechanisms.
  • Lease escalators and contractual rent adjustments: where present, these features create a structural tailwind independent of new acquisition volume.
  • Capital recycling and disciplined reinvestment: redeploying capital from mature assets into better-performing or higher-yield opportunities can improve portfolio-level cash yield.

⚠ Risk Factors to Monitor

  • Hotel cyclicality and operating volatility: even with lease protections, property cash flows can weaken during demand downturns, pressuring tenant ability to meet obligations.
  • Tenant credit risk: concentration in a limited set of operators or markets increases the impact of operator-specific leverage, labor cost inflation, or brand strategy changes.
  • Lease rollover and re-leasing risk: periods with significant lease expirations can create uncertainty in renewal economics and downtime costs.
  • Interest rate and refinancing risk: higher rates can compress property valuations and increase the cost of debt financing for capex and refinancing.
  • Capital intensity and execution risk: lodging assets require ongoing reinvestment; execution delays or cost overruns can reduce returns.
  • Regulatory and environmental liabilities: REIT tax compliance and property-level environmental or permitting constraints can affect operating expenses and capex needs.

📊 Valuation & Market View

Hotel REIT valuation is typically anchored to cash-flow metrics and asset yield assumptions rather than earnings growth expectations. Investors often focus on:

  • P/FFO or P/AFFO: reflects durable cash generation after maintenance and interest considerations.
  • EV/EBITDA (sector-relative): used for comparability across lodging capital structures.
  • Implied cap rates and property-level net operating income trends: drives how the market prices real estate cash flows.
  • Dividend sustainability: influenced by AFFO coverage, capital expenditure needs, and debt maturity ladders.

Key valuation drivers in lodging REITs include property-level occupancy and pricing durability, lease protection quality (fixed vs. variable rent participation), the cost of capital, and the perceived likelihood of stable or improving tenant credit performance through the cycle.

🔍 Investment Takeaway

CLDT’s long-term investment case rests on owning hotel real estate that can be underwritten for leaseable cash-flow stability, supported by disciplined asset selection, tenant/operator relationships, and reinvestment-driven competitiveness. The core debate for investors centers on whether the portfolio’s lease structure and tenant credit profile can sustain cash generation through lodging cycles while maintaining prudent capital allocation amid interest-rate and re-leasing uncertainty.


⚠ AI-generated — informational only. Validate using filings before investing.

📰 Market News & Coverage

15 Stories Available

Real-time institutional reporting and market updates for CLDT.

gurufocus.com2026-06-05

Chatham Lodging Declares Quarterly Common, Preferred Dividend

Chatham Lodging Trust (NYSE: CLDT), a hotel real estate investment trust (REIT) focused on investing in upscale, extended-stay hotels and premium-branded, sele

businesswire.com2026-06-05

Chatham Lodging Declares Quarterly Common, Preferred Dividend

WEST PALM BEACH, Fla.--(BUSINESS WIRE)--Chatham Lodging Declares Quarterly Common, Preferred Dividend.

zacks.com2026-05-29

Is Chatham Lodging Trust REIT (CLDT) Stock Undervalued Right Now?

Here at Zacks, our focus is on the proven Zacks Rank system, which emphasizes earnings estimates and estimate revisions to find great stocks. Nevertheless, we are always paying attention to the latest value, growth, and momentum trends to underscore strong picks.

247wallst.com2026-05-21

Want $400 in Ultra-Reliable Passive Income? Invest $5,000 Into This High-Yield Dividend Titan Under $20

With the market chasing AI hyperscalers, income investors are getting an unusual gift: high-quality, asset-backed REITs trading in the single digits.

zacks.com2026-05-15

5 Value Stocks With Impressive EV-to-EBITDA Ratios to Own Now

The price-to-earnings (P/E) multiple enjoys widespread popularity among investors seeking stocks trading at a bargain. In addition to being a widely used tool for screening stocks, P/E is a popular metric for working out the fair market value of a firm.

zacks.com2026-05-12

What Makes Chatham Lodging (CLDT) a New Strong Buy Stock

Chatham Lodging (CLDT) might move higher on growing optimism about its earnings prospects, which is reflected by its upgrade to a Zacks Rank #1 (Strong Buy).

zacks.com2026-05-12

Is Chatham Lodging Trust REIT (CLDT) a Great Value Stock Right Now?

Here at Zacks, our focus is on the proven Zacks Rank system, which emphasizes earnings estimates and estimate revisions to find great stocks. Nevertheless, we are always paying attention to the latest value, growth, and momentum trends to underscore strong picks.

zacks.com2026-05-11

What Makes Chatham Lodging (CLDT) a Strong Momentum Stock: Buy Now?

Does Chatham Lodging (CLDT) have what it takes to be a top stock pick for momentum investors? Let's find out.

marketbeat.com2026-05-09

Chatham Lodging Trust Q1 Earnings Call Highlights

Chatham Lodging Trust NYSE: CLDT executives said the hotel REIT delivered a stronger-than-expected first quarter, supported by improving demand in Silicon Valley, expense controls, a recently closed acquisition and ongoing share repurchases.

seekingalpha.com2026-05-08

Chatham Lodging Trust (CLDT) Q1 2026 Earnings Call Transcript

Chatham Lodging Trust (CLDT) Q1 2026 Earnings Call Transcript

zacks.com2026-05-07

Chatham Lodging (CLDT) Beats Q1 FFO and Revenue Estimates

Chatham Lodging (CLDT) came out with quarterly funds from operations (FFO) of $0.2 per share, beating the Zacks Consensus Estimate of $0.16 per share. This compares to FFO of $0.14 per share a year ago.

businesswire.com2026-05-07

Chatham Lodging Announces First Quarter 2026 Results

WEST PALM BEACH, Fla.--(BUSINESS WIRE)--Chatham Lodging Announces First Quarter 2026 Results.

zacks.com2026-04-29

4 Hotel REITs to Watch for Potential Upside This Earnings Season

CLDT, HST, PK and DRH enter earnings season as hotel demand, occupancy and RevPAR rise, setting up potential upside as investors hunt for positive surprises.

zacks.com2026-04-29

Coastal Financial Corporation (CCB) Misses Q1 Earnings Estimates

Coastal Financial Corporation (CCB) came out with quarterly earnings of $0.78 per share, missing the Zacks Consensus Estimate of $1.02 per share. This compares to earnings of $0.63 per share a year ago.

zacks.com2026-04-28

2026 Stock Market Winners: 3 Breakout Picks With Big Upside

SHIP, ITUB and CLDT screen as breakout candidates near resistance, backed by price momentum, support levels and projected earnings growth in 2026.

📊 AI Financial Analysis

Powered by StockMarketInfo
Earnings Data: Q Ending 2026-03-31

"CLDT reported Q1 2026 revenue of $67.5M and net income of -$4.4M (EPS -$0.0935). YoY, revenue declined 1.6% (from $68.6M in Q1 2025), while net income swung from +$1.5M to -$4.4M (down ~$5.9M). QoQ, revenue was essentially flat (-0.35% vs $67.7M in Q4 2025), but profitability deteriorated: net income dropped from +$4.6M in Q4 to -$4.4M in Q1. Profitability contracted meaningfully. Operating income fell to $1.6M (operating margin 2.4%) from 5.8% in Q4, and net margin turned negative at -6.5%. Cash flow remained positive despite the loss: operating cash flow was $13.3M and free cash flow was $13.3M in Q1. Capital deployment appears limited in this quarter (no capex shown), while financing drove cash: the company repurchased $6.6M of common stock and recorded other financing inflows (net effect improving cash availability). Balance sheet resilience is mixed for a non-bank: total assets fell to $1.24B (from $1.17B in Q4), but liabilities increased sharply and equity remains solid at ~$761.9M. Total shareholder return looks supportive given strong price momentum (+27.0% 1y_change) and a modest dividend yield (~1.1%), though near-term earnings are deteriorating."

Revenue Growth

Fair

Revenue was flat QoQ (-0.35% vs Q4) and slightly down YoY (-1.6% vs Q1 2025: $67.5M vs $68.6M). Directionally weak with no clear acceleration entering Q1 2026.

Profitability

Neutral

Net income deteriorated sharply: -$4.4M in Q1 2026 vs +$1.5M in Q1 2025 (YoY swing down ~$5.9M) and vs +$4.6M in Q4 2025 (QoQ). Margins contracted from Q4 net margin +6.8% to Q1 net margin -6.5%, and operating margin fell to 2.4%.

Cash Flow Quality

Positive

Despite the loss, operating cash flow was +$13.3M and free cash flow +$13.3M in Q1 2026. This is an improvement vs the net income trend, suggesting non-cash/proceeds and working-capital effects partially supported cash generation.

Leverage & Balance Sheet

Neutral

Total assets increased to ~$1.24B in Q1 2026. Equity remains substantial at ~$761.9M, but liabilities are also elevated and retained earnings are deeply negative. Leverage appears structurally heavy historically, but the quarter does not show immediate balance-sheet distress.

Shareholder Returns

Positive

Strong market momentum: price up +27.0% over 1 year. Dividend yield is modest (~1.1% per Q1 ratios). Q1 cash flow included buybacks (-$6.6M), supporting shareholder returns even as earnings weakened.

Analyst Sentiment & Valuation

Caution

No upside/downside vs consensus targets can be inferred from the data beyond a $11 consensus target; with the provided price at $8.74, implied upside exists. However, trailing earnings are negative (P/E -21), which typically pressures valuation multiples despite price strength.

Disclaimer:This analysis is AI-generated for informational purposes only. Accuracy is not guaranteed and this does not constitute financial advice.

Fundamentals Overview

Loading fundamentals overview...

CLDT delivered a strong Q1 2026 with clear operating leverage: GOP margin rose 60 bps and hotel EBITDA margin climbed ~140 bps, supported by expense control and $500k of property tax refunds, alongside a >1% per-occupied-room labor/benefits improvement. Comparable portfolio results showed hotel EBITDA up 5% and margins +135 bps, while utilities rose ~12%—suggesting management is offsetting cost inflation with productivity. The March 3 recycling acquisition of six Hilton hotels (589 rooms) for $92M is performing in line to slightly ahead of underwriting, with RevPAR +6% in Q1 and +7% in April, and management cites immediate accretion potential. The company raised 2026 guidance ~15% to RevPAR 0%–2%, adjusted EBITDA $95.3M–$99.6M, and adjusted FFO/share $1.21–$1.29, with Q2 RevPAR guidance of +1%–2%. Buybacks remain a central capital allocation theme, justified by ~9x corporate NOI and ~10x hotel NOI cap-rate framing, despite macro risks and softer convention calendars.

AI IconGrowth Catalysts

  • Comparable hotel hotel EBITDA margins increased by 135 bps (Q1; hotel EBITDA margins gained 135 bps).
  • Comparable basis hotel EBITDA grew 5% with improved GOP hotel margins driven by >1% decline in labor/benefits per occupied room.
  • Silicon Valley recovery: RevPAR growth +23% in the quarter excluding Mountain View renovation; ADR +10% to $210; occupancy 72% flat with Mountain View under renovation.
  • New Hilton-branded six-hotel acquisition recycling: produced RevPAR +6% in Q1 and +7% in April with immediate accretion to operating margins and FFO.

Business Development

  • Acquired: six Hilton-branded hotels (589 rooms) for $92 million (closed early March 2026; funded with revolver borrowings).
  • Applied Materials (Sunnyvale) as #1 account near hotels; surge in room-night production referenced.
  • Other named Sunnyvale/Valley clients: Palo Alto Networks, NVIDIA, Google (Mountain View), Apple, Pure Storage, Plug and Play.
  • MD Anderson Hospital & Research Center: planned $3B facility expected to be built at JJ Pickle Research Campus (groundbreaking expected to start in 2026), ~1 mile from two Domain extended-stay hotels.

AI IconFinancial Highlights

  • In Q1: hotel EBITDA $21.4 million; adjusted EBITDA $818.4 million; adjusted FFO $0.20/share (as stated).
  • Q1 GOP margin 40.2%; hotel EBITDA margin 31.8%.
  • Q1 GOP margins up 60 bps vs Q1 2025 due to expense control.
  • Q1 hotel EBITDA margins increased by 140 bps; drivers: strong expense control plus $500,000 of property tax refunds.
  • On comparable hotels: hotel EBITDA +5% and hotel EBITDA margins +135 bps.
  • Provision: labor and benefits costs declined >1% per occupied room; $0.50 per occupied room reduction mentioned.
  • Guidance increase: 2026 guidance increased by ~15% since February (no explicit prior numbers provided).
  • Updated full-year guidance: RevPAR growth 0% to 2%; adjusted EBITDA $95.3M to $99.6M; adjusted FFO/share $1.21 to $1.29.
  • Balance sheet/acquisition funding impact: revolving credit facility rate ~5.1%; leverage ratio (per credit agreement) 32.5% after acquisition.
  • FX/geo macro mentioned: adverse repercussions from Middle East turmoil (gas prices/travel impact) noted as not yet meaningfully impacting demand.
  • World Cup exposure: company states highest World Cup exposure among lodging REITs; conservatively forecasted.

AI IconCapital Funding

  • Share repurchases: 2.2 million shares (~4% of common equity) repurchased by end of Q1 at average $7.04.
  • Repurchase pricing/cap rate: management cited ~10% cap rate based on updated 2026 guidance.
  • Repurchase program: $25 million repurchase plan implemented in 2025; free cash flow $15M in 2025; projected ~$20M in 2026; intent to finish entire $25M program in 2026; reevaluate new plan later.
  • Post-quarter buy: after end of quarter in April, bought ~200k shares at ~$8.34/share.
  • Acquisition funding: $92M acquisition funded with borrowings on revolving credit facility; revolver rate ~5.1%.
  • Development funding: expects to commence Portland, Maine hotel development during Q1; opening before fall season 2028 (detailed spend/timing deferred to August).

AI IconStrategy & Ops

  • Expense productivity focus: labor and benefits reduced >1% or ~$0.50 per occupied room; 2025 prior year also showed decline in labor/benefits year-over-year (management claims uniqueness among lodging REITs).
  • Operating efficiency: drove other operating profit percent higher; benefited from lower property insurance renewal rates and property taxes via refunds; offset by ~12% utility cost increase.
  • CapEx: $6M spent in Q1; renovation progress: completed Residence Inn Austin renovation and Mountain View rooms portion; continuing Mountain View gatehouse upgrades (completion next month) and later-year gatehouse outdoor amenities enhancement.
  • 2026 CapEx budget: ~$27M.
  • Scheduled renovations later in 2026: Gaslamp Residence Inn, Hyatt Place Pittsburgh, Farmington Homewood Suites, expected to start in Q4.
  • Acquired hotels: six recent acquisitions have very little CapEx required in 2026; only one scheduled renovation over next two years—Hampton Inn & Suites Paducah.
  • Share repurchases continue opportunistically due to market discount/multiple disconnect.

AI IconMarket Outlook

  • Full-year 2026 guidance: RevPAR growth 0% to 2%; adjusted EBITDA $95.3M to $99.6M; adjusted FFO/share $1.21 to $1.29.
  • Q2 2026: expects RevPAR increase ~1% to 2% (guidance includes pro forma acquisition contribution; no share repurchases/acquisitions assumed).
  • Silicon Valley: despite Mountain View renovation disruption in Q1, company projecting mid- to upper-single-digit RevPAR growth for balance of year (May–December) for four hotels.
  • Conventions outlook: 2026 convention calendar softer than 2025; forecast RevPAR decline ~2% for rest of year (company hopes for upside).
  • Specific market comp framing: Silicon Valley leading; DC easier comps due to prior DOJ/disruption shutdown events; Midwest manufacturing belt exposure expected to benefit longer-term.

AI IconRisks & Headwinds

  • Wildfire demand distortion in LA hotels: faced difficult comps; RevPAR decline in January (-5%) recovering through quarter (+1% finish).
  • Middle East turmoil: risk flagged via potential gas price/travel impact; management stated no meaningful impact yet.
  • Convention/cycle risk: Dallas and Austin convention demand falloff due to convention center renovations/expansions; Courtyard Dallas RevPAR down 26% in Q1; Austin RevPAR down 6% over last 12 months.
  • Leisure variability: coastal Northeast RevPAR decline 8% in Q1; leisure hotels had mixed results despite overall >2% RevPAR growth for leisure group.

Q&A: Analyst Interest

  • Acquisition terms and underwriting vs performance: Management said the six-hotel deal was brokered to a group of parties (not a broad off-market search), and they liked the ability to transact despite deal size. They characterized outperformance as only a “buck or two” above underwriting on RevPAR, not materially above.
  • Supply growth, World Cup contribution, and conservatism: Management stated supply growth is very limited; only one Paducah hotel opening mentioned. For World Cup, they are “pretty conservative” given expensive tickets and international travel friction, while still expecting growth and upside. Guidance assumes 1% to 2% rest-of-year with easier comps and conservatism.
  • Valuation/cap rates for buybacks and Silicon Valley remainder-year outlook: Management anchored buybacks to cap rates of ~9 on corporate NOI and ~10 on hotel NOI at current trading levels, suggesting continuing repurchases through likely end of Q3. For Silicon Valley, they forecast mid-to-upper single-digit RevPAR growth May–December, despite ongoing Mountain View renovation.

Sentiment: POSITIVE

Note: This summary was synthesized by AI from the CLDT Q1 2026 earnings transcript. Financial data is complex; please verify all metrics against official SEC filings before making investment decisions.

📋 Official Regulatory 10-K / 10-Q SEC Filings

Direct authenticated documentation links to audited SEC database reports for CLDT.

SEC EDGAR Live Feed
Loading financial data and tables...
📁

SEC Filings (CLDT)

© 2026 Stock Market Info — Chatham Lodging Trust (CLDT) Financial Profile