Costamare Bulkers Holdings Ltd

Costamare Bulkers Holdings Ltd (CMDB) Market Cap

Costamare Bulkers Holdings Ltd has a market capitalization of $400.2M.

Price: $16.51

-0.28 (-1.67%)

Market Cap: 400.22M

NYSE · time unavailable

CEO: Gregory G. Zikos

Sector: Industrials

Industry: Marine Shipping

IPO Date: 2025-05-07

Website: https://www.costamarebulkers.com

Costamare Bulkers Holdings Ltd (CMDB) - Company Information

Market Cap: 400.22M|Sector: Industrials

Company Profile

Costamare Bulkers Holdings Limited is an international operator of dry bulk vessels, providing transportation services for major commodities such as grain, coal, and iron ore. The Company manages vessel chartering and freight contracts through its integrated dry bulk platform. Headquartered in Monaco, it was established as a spin-off from Costamare Inc.

Analyst Sentiment

Analyst ratings pending...

Consensus Target Matrix

Data feed parsing pending...

Price & Moving Averages

Loading chart...

🎯 Wall Street Analyst Intelligence Report

1-Year structural target targets, chart projections, and sentiment maps.

Average 1Y Target
$17.34
▲ +5.00% Upside
Low Target
$12.38
-25% Risk
Median Target
$16.84
2% Mid
High Target
$20.64
25% Max

Consensus Trend Projection

Trailing closures vs. 12-month metrics map.

Analyst Vote Distribution

Aggregate institutional coverage sentiment weights.

Sentiment volume allocation data unavailable.

📊 Historical Valuation Multiples

Real-time Trailing Twelve Month (TTM) momentum side-by-side with discrete quarterly metrics.

Fiscal QuarterTTMQ1 2026Q4 2025Q3 2025Q2 2025Q1 2025Q4 2024Q2 2024Q1 2024
Period EndingTrailing 12MMar 31, 2026Dec 31, 2025Sep 30, 2025Jun 30, 2025Mar 31, 2025Dec 31, 2024Jun 30, 2024Mar 31, 2024
Market Cap ($M)400374372348210341327327
Enterprise Value ($M)293267352473450581664
Price to Earnings Ratio (P/E)-32.028.05-5.1111.84-3.96-6.4364.9864.98
Price/Earnings-to-Growth Ratio (PEG)0.06
Price to Sales Ratio (P/S)0.622.871.701.562.704.381.191.19
Price to Book Ratio (P/B)0.510.480.480.510.310.51
Price to Free Cash Flow Ratio (P/FCF)7.8314.3461.0415.7255.76-73.26-73.26
Enterprise Value to Sales (EV/Sales)2.051.612.125.777.45
Enterprise Value to EBITDA (EV/EBITDA)12.7613.89-60.6344.65-437.98-565.55
Debt to Equity Ratio-4.670.240.290.450.540.541.69
⚠️

Valuation Model Suspended

API Payload Error: Inverted or negative baseline Free Cash Flow margin detected (-6.3%).

Troubleshooting Notice: The upstream financial data supplier has uploaded corrupted or inverted baseline metrics for CMDB. The server sandbox cannot calculate an intrinsic value path from negative cash generation baselines.

📘 Full Research Report

ℹ️

AI-Generated Research: This report is for informational purposes only.

📘 COSTAMARE BULKERS HOLDINGS LTD (CMDB) — Investment Overview

🧩 Business Model Overview

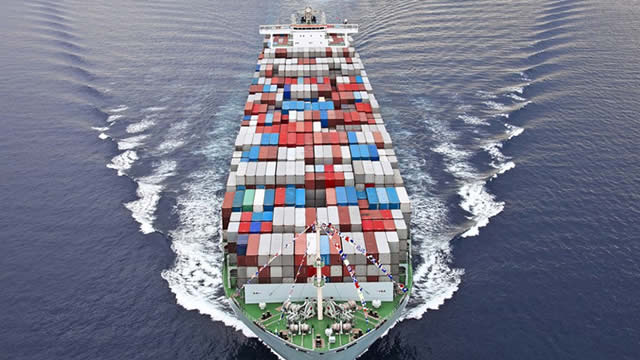
Costamare Bulkers Holdings Ltd operates as a dry bulk shipping provider, earning revenue by moving seaborne commodities for industrial and trading customers. The value chain is straightforward: the company deploys a fleet of bulk vessels to transport raw materials along global trade routes, then monetizes that capacity through charters—either on a time-charter basis (contracted employment over a period) or via spot/short-term arrangements (day-rate exposure to prevailing freight conditions). Charterers rely on scheduling reliability, vessel availability, and commercial flexibility, which ties customer counterparty relationships to the company’s operating performance and fleet management.

💰 Revenue Streams & Monetisation Model

Revenue is primarily generated through freight earnings under charter contracts, typically expressed as a daily rate per vessel. Monetisation varies by contract type:

  • Time charters: Provide more contracted earnings visibility and can smooth freight-rate volatility. Margin drivers center on charter coverage, operating costs discipline, and the ability to accept or negotiate delivery terms and fleet specifications.
  • Spot/short-term charters: Capture upside when freight markets tighten, but introduce higher variability in realized day-rates. Margin drivers include fleet positioning, route economics, and the ability to minimize off-hire and downtime.

At the operating level, economics are driven less by pricing power and more by fleet utilization and unit cost control (crew efficiency, maintenance productivity, dry-docking execution, and procurement). Fleet age and compliance requirements also influence both cash cost structure and the capacity to command attractive employment terms.

🧠 Competitive Advantages & Market Positioning

The most durable competitive factors in dry bulk shipping tend to be structural rather than “brand”-based. For CMDB, the practical moats are:

  • Economies of scale in operating platform: A larger, more actively managed fleet typically improves purchasing efficiency (repairs, spares, services), enables stronger scheduling discipline, and supports better fleet utilization through commercial and technical coordination.
  • Execution and fleet management capabilities: In bulk shipping, reliability (minimizing off-hire, executing dry-dock plans, and maintaining vessel readiness) materially affects the share of days that generate revenue.
  • Cost discipline and financing flexibility: Shipping is capital intensive. The ability to access capital markets on competitive terms and manage leverage through cycle phases affects resilience and fleet renewal capacity, which can indirectly sustain market position across downturns.

Competitive benchmarking (industry peers):

  • Star Bulk Carriers (SBLK): Focuses on a large dry bulk fleet with an emphasis on operational optimization and active portfolio management.
  • Safe Bulkers (SB): Competes with a diversified bulk vessel base and time-charter employment strategies to influence earnings stability.
  • Euronav (EURN): Operates dry bulk exposure but is often broader in fleet composition and market coverage; competitive differentiation frequently arises from fleet mix and chartering strategy.

Compared with these peers, CMDB’s positioning is similarly tied to fleet utilization and technical execution, while performance differentiation usually hinges on operating cost efficiency, chartering approach (coverage vs. spot exposure), and the quality/timing of fleet renewal relative to regulatory and market demand for compliant capacity.

🚀 Multi-Year Growth Drivers

Over a 5–10 year horizon, dry bulk shipping demand is supported by global commodity trade volumes and vessel supply dynamics. Key drivers include:

  • Secular growth in seaborne commodity flows: Structural needs for transporting iron ore, coal, grain, and other dry bulk materials underpin long-run ton-mile demand, even if rates vary with the cycle.
  • Vessel supply discipline via scrapping and delays: Fleet aging, regulatory pressure, and shifting shipbuilding order patterns can tighten effective capacity growth, supporting utilization over multi-year intervals.
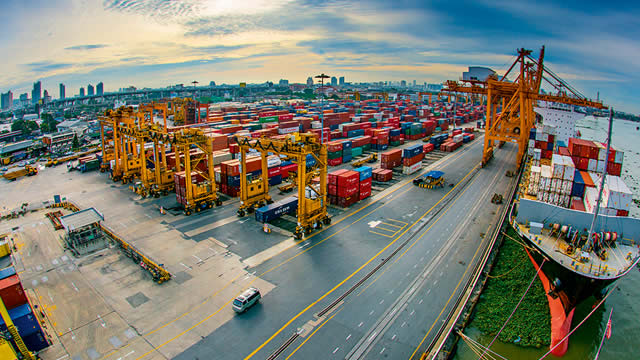
  • Port and logistics capacity evolution: Continued development and efficiency improvements in port throughput influence turnaround times and vessel scheduling—important to monetizing capacity.
  • Regulatory-driven fleet competitiveness: Environmental rules (e.g., emissions and ballast water requirements) increase the relative value of compliant vessels, reinforcing a “quality of capacity” effect where older/less efficient ships face higher costs or reduced marketability.

⚠ Risk Factors to Monitor

  • Freight-rate cyclicality: Bulk markets can shift rapidly due to demand swings and fleet supply changes, translating into volatile earnings and cash flow.
  • Capital intensity and refinancing risk: Fleet renewal and compliance capex require sustained access to capital markets; adverse credit conditions can constrain investment and reduce flexibility.
  • Regulatory and compliance costs: Compliance with evolving maritime environmental and safety standards can raise operating expenses, dry-docking frequency, and vessel upgrade requirements.
  • Off-hire and operational execution risk: Maintenance delays, dry-dock overruns, or vessel technical issues reduce revenue-generating days.
  • Counterparty and charter exposure: Time-charter counterparties and commercial counterparties introduce credit risk and contract performance considerations.

📊 Valuation & Market View

Dry bulk shipping is typically valued through a blend of asset and earnings power frameworks rather than purely software-like multiples. Market participants commonly focus on:

  • EV/EBITDA and cycle-adjusted earnings: Reflects operating leverage to freight markets, with attention to cost position and utilization.
  • Net asset value (NAV) and fleet quality: The market often benchmarks against realizable value of the fleet net of debt, adjusted for vessel age, compliance readiness, and expected remaining economic life.
  • Balance-sheet resilience: Leverage, liquidity, and the maturity profile of debt influence how the market discounts downside during trough freight periods.

Key valuation movers include utilization trends, the degree of contracted earnings coverage, unit cost performance, fleet compliance status, and capital market conditions that affect refinancing and newbuilding/dry-dock economics.

🔍 Investment Takeaway

CMDB’s long-term investment case rests on the structural economics of dry bulk shipping: revenue generation through contracted and spot employment of a managed fleet, with competitiveness driven by utilization discipline, cost control, and fleet compliance quality. The “moat” is less about durable pricing power and more about operational execution and financial resilience that enable consistent deployment of capacity through the freight cycle—an advantage that becomes most valuable when market conditions normalize and capital constraints tighten across the industry.


⚠ AI-generated — informational only. Validate using filings before investing.

📰 Market News & Coverage

12 Stories Available

Real-time institutional reporting and market updates for CMDB.

seekingalpha.com2026-05-13

Costamare Bulkers Holdings Limited (CMDB) Q1 2026 Earnings Call Prepared Remarks Transcript

Costamare Bulkers Holdings Limited (CMDB) Q1 2026 Earnings Call Prepared Remarks Transcript

globenewswire.com2026-05-13

Costamare Bulkers Holdings Limited Reports Results For the First Quarter Ended March 31, 2026

MONACO, May 13, 2026 (GLOBE NEWSWIRE) -- Costamare Bulkers Holdings Limited (“Costamare Bulkers” or the “Company”) (NYSE: CMDB) today reported unaudited financial results for the first quarter ended March 31, 2026 (“Q1 2026”).

globenewswire.com2026-05-08

Costamare Bulkers Holdings Limited Sets the Date for Its First Quarter 2026 Results Release, Conference Call and Webcast

Earnings Release: Wednesday, May 13, 2026, Before Market Opens Conference Call and Webcast: Wednesday, May 13, 2026, at 8:30 a.m. ET

globenewswire.com2026-03-30

Costamare Bulkers Holdings Limited Announces Availability of Its Annual Report on Form 20-F for the Year Ended December 31, 2025

MONACO, March 30, 2026 (GLOBE NEWSWIRE) -- Costamare Bulkers Holdings Limited (the “Company”, “we” or “our”) (NYSE: CMDB) announced today that its Annual Report on Form 20-F for the fiscal year ended December 31, 2025 (the “Annual Report”) has been filed with the U.S. Securities and Exchange Commission and can be accessed on the Company's website, www.costamarebulkers.com, in the “Investors” section under “Annual Reports”.

prnewswire.com2026-03-11

NYSE Content Update: United States Antimony Corp. Rings Bell to Mark its Listing

NYSE issues a pre-market daily advisory direct from the trading floor. NEW YORK, March 11, 2026 /PRNewswire/ -- The New York Stock Exchange (NYSE) provides a daily pre-market update directly from the NYSE Trading Floor.

globenewswire.com2026-02-20

Costamare Bulkers Holdings Limited Reports Results for the Fourth Quarter and Year Ended December 31, 2025

MONACO, Feb. 20, 2026 (GLOBE NEWSWIRE) -- Costamare Bulkers Holdings Limited (“Costamare Bulkers” or the “Company”) (NYSE: CMDB) today reported unaudited financial results for the fourth quarter (“Q4 2025”) and year ended December 31, 2025.

globenewswire.com2026-02-13

Costamare Bulkers Holdings Limited Sets the Date for its Fourth Quarter 2025 Results Release, Conference Call and Webcast

Earnings Release: Friday, February 20, 2026, Before Market Opens Conference Call and Webcast: Friday, February 20, 2026, at 8:30 a.m. ET

seekingalpha.com2026-02-03

Costamare Bulkers: The Cheapest Drybulk, Even After A Large Move

Costamare Bulkers has transferred its loss-making CBI platform, refocusing as a pure-play dry bulk operator with improved comparability to peers. CMDB boasts a net cash position, positive earnings, and trades at a steep discount to NAV, with a fair value estimate of $21 per share—25% upside. The company is prioritizing Capesize fleet expansion and operational improvement but lacks a clear capital allocation or shareholder return policy, in my opinion.

globenewswire.com2025-11-14

Costamare Bulkers Holdings Limited Reports Results for the Third Quarter and Nine-Month Period Ended September 30, 2025

MONACO, Nov. 14, 2025 (GLOBE NEWSWIRE) -- Costamare Bulkers Holdings Limited (“Costamare Bulkers” or the “Company”) (NYSE: CMDB) today reported unaudited financial results for the third quarter and nine-month period ended September 30, 2025.

globenewswire.com2025-11-11

Costamare Bulkers Holdings Limited Sets the Date for Its Third Quarter 2025 Results Release, Conference Call and Webcast

Earnings Release: Friday, November 14, 2025, Before Market Opens Conference Call and Webcast: Friday, November 14, at 8:30 a.m. ET

globenewswire.com2025-09-29

Costamare Bulkers Holdings Limited Announces Strategic Cooperation Agreement with Cargill International SA

MONACO, Sept. 29, 2025 (GLOBE NEWSWIRE) -- Costamare Bulkers Holdings Limited (“Costamare Bulkers” or the “Company”) (NYSE: CMDB) announced today that it has signed a Strategic Cooperation Agreement (the “Agreement”) with Cargill International S.A. (“Cargill”).

globenewswire.com2025-08-08

Costamare Bulkers Holdings Limited Reports Results for the Six-Month Period Ended June 30, 2025

MONACO, Aug. 08, 2025 (GLOBE NEWSWIRE) -- Costamare Bulkers Holdings Limited (“Costamare Bulkers” or the “Company”) (NYSE: CMDB) today reported unaudited financial results for the six-month period ended June 30, 2025 (“H1 2025”).

📊 AI Financial Analysis

Powered by StockMarketInfo
Earnings Data: Q Ending 2025-12-31

"CMDB reported revenue of $254.3M for the year ending December 31, 2025, demonstrating solid top-line growth. However, the company recorded a net loss of $21.2M, resulting in an EPS of -$0.88. The operating cash flow stands at $31.9M, with capital expenditures at -$26.2M, reflecting positive free cash flow of $5.7M. The balance sheet is robust with total assets of $1.1B, total liabilities of $309.8M, and a healthy equity of $781.8M, complemented by a net cash position. Despite the absence of dividend payments and a 1-year price change of 13.70%, the stock shows potential for appreciation, especially with a strong 6-month gain of 21.92%. This performance indicates the market's optimistic view on future growth. Overall, while profitability trends need improvement, the company appears to have solid financial foundation to support its future endeavors."

Revenue Growth

Good

Strong revenue of $254.3M shows significant growth.

Profitability

Caution

Net loss of $21.2M indicates profitability challenges.

Cash Flow Quality

Neutral

Positive free cash flow of $5.7M supports operational health.

Leverage & Balance Sheet

Good

Strong balance sheet with high equity and low net debt.

Shareholder Returns

Fair

Modest 1-year return at 13.70%, but potential for growth.

Analyst Sentiment & Valuation

Fair

Valuation sentiment is mixed with room for upward adjustment.

Disclaimer:This analysis is AI-generated for informational purposes only. Accuracy is not guaranteed and this does not constitute financial advice.

Fundamentals Overview

Loading fundamentals overview...

Q1 2026 delivered $12.4M adjusted net income ($0.51/share) with meaningful balance-sheet derisking as the company’s legacy trading book is being transferred to Cargill (substantially complete; one vessel left to novate). Net cash remained strong: ~$270M cash versus ~$140M debt, leaving cash exceeding debt by ~$127M at quarter-end. Operationally, Costamare continued fleet renewal—selling a 2011-built Capesize (capital gains ~$7M) and acquiring a 2018-built Ultramax—while adding Kamsarmax exposure via newbuilds under long-term charters with options, already generating profitable charter coverage for at least one year and minimum five-year periods. Market conditions appear supportive but uneven: Capesize is supported by iron ore/bauxite volumes and limited fleet growth, Panamax by soybean harvest and end-2025 U.S.–China trade dynamics, while Supramax faces headwinds from a ~50% Persian Gulf export volume reduction due to Strait of Hormuz closures. Charter rates strengthened into April.

AI IconGrowth Catalysts

  • Elevated dry bulk demand supported by expanded West Africa–China trade flows for iron ore and bauxite
  • Panamax support from record soybean harvest in Brazil and long-haul soybean shipments driven by the end-2025 U.S.–China agreement
  • Capesize earnings supported by robust iron ore and bauxite volumes plus limited fleet growth
  • Supramax early-year improvement from increased grain and minor bulk flows despite Persian Gulf disruption

Business Development

  • Legacy trading portfolio transfer substantially complete under a deal with Cargill (only 1 vessel remaining to be novated)
  • Newbuilding Kamsarmax chartered in for a minimum 5-year period with extension and purchase options; already chartered out for 1 year at profitable levels
  • Another Kamsarmax expected for delivery under a long-term chartering agreement with similar options

AI IconFinancial Highlights

  • Adjusted net income: $12.4M, $0.51/share (net income $9.9M, $0.41/share)
  • Balance sheet de-risking via trading book transfer to Cargill; expects zero remaining legacy positions by year-end
  • Capital structure: total cash ~$270M vs debt ~ $140M (net cash positive); end of Q1 cash exceeded debt by ~$127M
  • Fleet renewal actions: sold one 2011-built Capesize (capital gains ~ $7M) and acquired a 2018-built Ultramax
  • Charter rate momentum: management states vessel charter rates strengthened during Q1 with upside momentum since April
  • New vessel order book: 13.5%

AI IconCapital Funding

  • Total cash about $270M and debt circa $140M (net cash positive); cash exceeded debt by approximately $127M by end of Q1
  • No buyback, incremental debt, or explicit cash runway disclosed beyond net cash position

AI IconStrategy & Ops

  • Completed majority of legacy trading portfolio transfer; remaining legacy position expected to be eliminated by year-end
  • Shift in operating platform focus to Kamsarmax: 20 third-party-owned dry bulk vessels
  • Owned vessel employment mostly on index-linked period charter agreements with option to convert to fixed rate
  • Fleet renewal: sale of an older Capesize and introduction of Ultramax plus new Kamsarmax deliveries under long-term charters

AI IconMarket Outlook

  • Trading platform expected free of remaining legacy trades by year-end
  • Management expects to speak again at Q2 2026 results (no numeric guidance provided)

AI IconRisks & Headwinds

  • Elevated market volatility in first four months driven by increased activity/inefficiencies
  • Geopolitical instability increasing uncertainty
  • Strait of Hormuz closure reducing Persian Gulf export volumes by approximately 50%
  • Countercyclical growth depends on lower asset value environment (implied risk of cycle sensitivity)

Q&A: Analyst Interest

    Sentiment: MIXED

    Note: This summary was synthesized by AI from the CMDB Q1 2026 earnings transcript. Financial data is complex; please verify all metrics against official SEC filings before making investment decisions.

    📋 Official Regulatory 10-K / 10-Q SEC Filings

    Direct authenticated documentation links to audited SEC database reports for CMDB.

    SEC EDGAR Live Feed
    No recent 10-K available.
    No recent 10-Q available.
    Loading financial data and tables...
    📁

    SEC Filings (CMDB)

    © 2026 Stock Market Info — Costamare Bulkers Holdings Ltd (CMDB) Financial Profile