Compass Minerals International, Inc.

Compass Minerals International, Inc. (CMP) Market Cap

Compass Minerals International, Inc. has a market capitalization of $1.24B.

Price: $29.63

-1.74 (-5.55%)

Market Cap: 1.24B

NYSE · time unavailable

CEO: Edward C. Dowling Jr.

Sector: Basic Materials

Industry: Industrial Materials

IPO Date: 2003-12-12

Website: https://www.compassminerals.com

Compass Minerals International, Inc. (CMP) - Company Information

Market Cap: 1.24B|Sector: Basic Materials

Company Profile

Compass Minerals International, Inc., produces and sells essential minerals primarily in the United States, Canada, Brazil, the United Kingdom, and internationally. It operates through three segments: Salt, Plant Nutrition North America, and Plant Nutrition South America. The Salt segment offers sodium chloride and magnesium chloride, including rock salt, mechanically and solar evaporated salt, and brine and flake magnesium chloride products; and purchases potassium chloride and calcium chloride to sell as finished products or to blend with salt to produce specialty products. This segment provides products for use as a deicer for roadways, consumer, and professional use; as an ingredient in chemical production; for water treatment, human, and animal nutrition; and for various other consumer and industrial uses, as well as records management services. The Plant Nutrition North America segment offers sulfate of potash specialty fertilizers in various grades, including agricultural products that are used in broadcast spreaders, direct application, and liquid fertilizer solutions; turf products used by the turf and ornamental markets, as well as for blends used on golf course greens; organic products under the Protassium+ brand; and micronutrient products under the Wolf Trax and other brands. This segment provides its products to distributors and retailers of crop inputs, as well as growers. The Plant Nutrition South America segment offers various specialty plant nutrients and supplements; water and wastewater treatment chemicals for cleaning, decontaminating, and purifying water; and process chemicals for industrial use. The company was formerly known as Salt Holdings Corporation and changed its name to Compass Minerals International, Inc. in December 2003. Compass Minerals International, Inc. was founded in 1993 and is headquartered in Overland Park, Kansas.

Analyst Sentiment

67%
Buy

From 4 Active Polls

1Y Forecast: $28.50

▼ -3.8% Potential Upside

Consensus Target Metrics

Low Bound

$24

Median

$28

High Bound

$35

Average

$29

Price & Moving Averages

Loading chart...

🎯 Wall Street Analyst Intelligence Report

1-Year structural target targets, chart projections, and sentiment maps.

Average 1Y Target
$28.50
▼ -3.81% Upside
Low Target
$24.00
-19% Risk
Median Target
$27.50
-7% Mid
High Target
$35.00
18% Max
Consensus
Buy
10 / 17 Buys

Consensus Trend Projection

Trailing closures vs. 12-month metrics map.

Analyst Vote Distribution

Aggregate institutional coverage sentiment weights.

📊 Historical Valuation Multiples

Real-time Trailing Twelve Month (TTM) momentum side-by-side with discrete quarterly metrics.

Fiscal QuarterTTMQ1 2026Q4 2025Q3 2025Q2 2025Q1 2025Q4 2024Q3 2024Q2 2024
Period EndingTrailing 12MMar 31, 2026Dec 31, 2025Sep 30, 2025Jun 30, 2025Mar 31, 2025Dec 31, 2024Sep 30, 2024Jun 30, 2024
Market Cap ($M)1,243983827807841386466497416
Enterprise Value ($M)1,1819211,6771,5951,6021,1441,3951,4111,278
Price to Earnings Ratio (P/E)175.7119.3511.11-28.01-12.37-3.01-4.94-2.57-2.38
Price/Earnings-to-Growth Ratio (PEG)1.340.15-4.66-0.05-0.10-0.89
Price to Sales Ratio (P/S)0.962.172.093.553.920.781.522.382.05
Price to Book Ratio (P/B)4.553.593.173.453.371.631.771.571.18
Price to Free Cash Flow Ratio (P/FCF)12.385.49-13.82-35.38221.302.23-18.00-14.80-19.34
Enterprise Value to Sales (EV/Sales)2.034.237.017.472.314.546.766.30
Enterprise Value to EBITDA (EV/EBITDA)5.6010.9427.5339.8761.8651.2946.81-276.6639.45
Debt to Equity Ratio-0.290.043.443.623.373.413.702.952.49
⚠️

Valuation Model Suspended

API Payload Error: Inverted or negative baseline Free Cash Flow margin detected (-3.0%).

Troubleshooting Notice: The upstream financial data supplier has uploaded corrupted or inverted baseline metrics for CMP. The server sandbox cannot calculate an intrinsic value path from negative cash generation baselines.

📘 Full Research Report

ℹ️

AI-Generated Research: This report is for informational purposes only.

📘 COMPASS MINERALS INTERNATIONAL INC (CMP) — Investment Overview

🧩 Business Model Overview

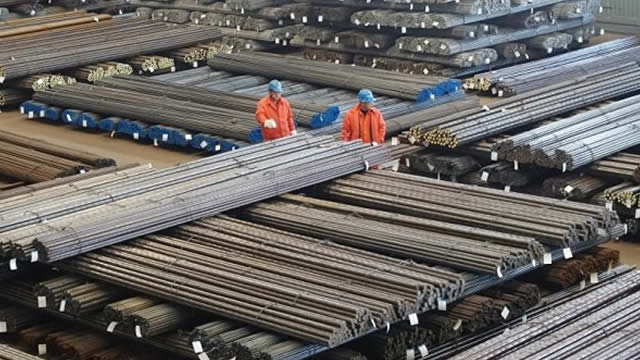
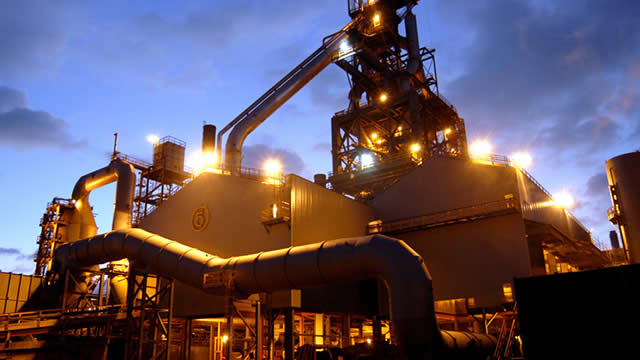
Compass Minerals produces and sells salt-based products through a vertically integrated mining and processing platform. Rock salt and brine are extracted, processed, and converted into application-specific formulations (e.g., road-deicing salt and industrial/specialty salts). The company’s customers—primarily municipalities, contractors, and industrial users—purchase based on delivered availability and application performance, with supply continuity supported by mining capacity, storage, and distribution logistics. This structure shifts the competitive battle toward installed capacity near demand centers and cost-effective transportation rather than marketing.

💰 Revenue Streams & Monetisation Model

Revenue is driven by the sale of salt and derivative products across several end markets:
  • De-icing (seasonal, contract- and tender-driven): High volume, pricing and mix influenced by winter operations and logistics availability.
  • Industrial and specialty (more diversified demand): Includes applications such as chemical processing, water treatment, and other industrial uses, typically steadier than road demand.
  • Other salt-related products/services: Monetized through product differentiation (grade, handling, formulation) and supply reliability.
Margin drivers center on cost per ton (mining efficiency, energy/inputs, water/brine processing), freight and terminal economics (distance to customers and distribution density), and pricing discipline and product mix. While revenue is not subscription-like, repeat purchasing behavior and contracted volumes can create a practical form of demand stickiness.

🧠 Competitive Advantages & Market Positioning

Compass Minerals’ moat is best described as geographic cost advantage and logistical infrastructure, reinforced by asset scale and permitting constraints. Key mechanisms:
  • Low delivered-cost positioning: Salt is bulky and transportation-heavy, so producers with mining and processing assets closer to high-demand regions can sell at lower delivered cost. CMP’s U.S. footprint supports economical distribution into major road and industrial markets.
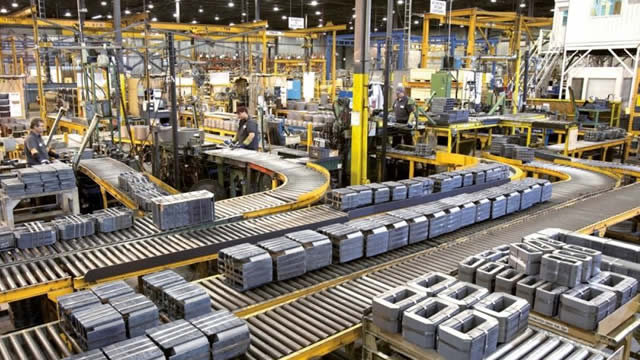
  • Logistical infrastructure: Storage capacity, production continuity, and distribution reach reduce the risk of supply disruption during peak demand periods, which matters to municipalities and industrial buyers.
  • Regulatory and permitting friction: New capacity requires mining rights, environmental approvals, and long lead times, raising barriers for entrants attempting to replicate existing supply chains.
  • Application-specific product handling: Differences in product grade/handling and delivery specifications raise practical switching friction for large buyers that optimize procurement, storage, and application workflows.
Competitive benchmarking (primary competitors):
  • Morton Salt — broad salt supplier presence; more consumer and regional footprint characteristics depending on end market.
  • Cargill — major participant in bulk and de-icing logistics and supply arrangements.
  • Domestic/regional road-salt producers (e.g., North American Salt and other regional operators) — localized advantages in specific demand basins.
Positioning contrast: CMP’s strategy emphasizes supplying from geographically advantaged production and distribution networks across U.S. demand centers, seeking to convert proximity and logistics into durable cost competitiveness. Rivals may compete successfully in particular regions or end markets, but broad replication of CMP’s delivered-cost profile is difficult without comparable infrastructure and permitting timelines.

🚀 Multi-Year Growth Drivers

Over a 5–10 year horizon, growth opportunity is tied to steady demand from infrastructure and industrial usage, plus capacity utilization and efficiency improvements:
  • Infrastructure and road maintenance spend: Winter safety requirements support ongoing demand for de-icing inputs, even as operating budgets evolve.
  • Industrial demand resilience: Salt and salt derivatives are inputs into industrial processing and water-related applications, providing diversification beyond road de-icing.
  • Customer procurement preference for reliability: Buyers favor dependable supply and predictable delivery, supporting continued throughput utilization in established regions.
  • Operational and cost-efficiency initiatives: Sustained focus on mining productivity, processing yields, and logistics optimization can expand margins without relying purely on demand growth.
TAM expansion is incremental and regionally driven rather than transformational; the durable growth vector is the ability to maintain share through cost and delivery reliability while keeping specialty/industrial mix appropriately sized.

⚠ Risk Factors to Monitor

  • Weather and demand variability: De-icing volumes are influenced by winter severity and timing; industrial volumes may be steadier but can still reflect economic cycles.
  • Cost and input inflation: Energy, labor, and transportation costs can pressure margins if not offset by pricing or efficiency.
  • Capital intensity and execution risk: Maintaining and expanding production capacity, storage, and logistics requires ongoing investment with project and permitting execution risk.
  • Regulatory and environmental constraints: Mining, water management, and product handling are subject to permitting and compliance standards that can increase costs or delay expansion.
  • Substitution and application shifts: Alternative de-icers or different treatment strategies can influence volumes or pricing over time, particularly in procurement-driven markets.

📊 Valuation & Market View

The market typically values salt and materials producers on enterprise value versus operating cash flow (EV/EBITDA) or earnings power, adjusted for cyclicality from weather-driven demand. The primary valuation levers include:
  • Delivered-cost advantage (mining efficiency and freight economics)
  • Margin durability through mix and pricing discipline
  • Cash conversion and the stability of operating cash flow despite seasonality
  • Capital requirements relative to maintenance needs and growth options
Sustained outperformance generally occurs when cost leadership and infrastructure reliability translate into resilient margins through varying demand conditions.

🔍 Investment Takeaway

Compass Minerals’ long-term investment case rests on a hard-to-replicate geographic and logistical cost advantage in a transportation-constrained commodity. Asset scale, permitting friction, and established supply reliability support credible margin resilience and operating continuity. The core question for investors is whether CMP can sustain delivered-cost competitiveness and efficiently deploy capital to maintain capacity and match end-market demand across cycles, while managing weather volatility and regulatory/compliance costs.

⚠ AI-generated — informational only. Validate using filings before investing.

📰 Market News & Coverage

15 Stories Available

Real-time institutional reporting and market updates for CMP.

prnewswire.com2026-05-18

EnergyX Signs Agreement with Compass Minerals to Advance up to 30,000-ton Commercial Lithium DLE Facility in Utah

HIGHLIGHTS: ●  EnergyX and Compass Minerals enter into an agreement to advance EnergyX's planned 30,000 tpa commercial-scale direct lithium extraction (DLE) and refinery plant near Utah's Great Salt Lake; the EnergyX project has been named Project Powder Hound™. ●  The Ogden, Utah, site holds an identified domestic resource of up to 2.4 million metric tons of lithium carbonate equivalent, one of the richest lithium brine regions in the U.S. ●  EnergyX will commit all funding with plans to invest approximately $400 million across two phases, projecting $600M+ in annual revenue at full build.

reuters.com2026-05-18

Exclusive: Compass Minerals eyes return to lithium market with EnergyX partnership

Compass Minerals plans to jump ​back into the ‌lithium market by partnering with technology startup EnergyX to ​extract the battery ​metal from Utah's Great ⁠Salt Lake, a move ​that comes as prices ​rise for the critical mineral alongside a broader push ​to boost U.S. output.

businesswire.com2026-05-13

Compass Minerals Announces Participation in Deutsche Bank's 17th Annual Basic Materials Conference in June 2026

OVERLAND PARK, Kan.--(BUSINESS WIRE)--Compass Minerals (NYSE: CMP), a leading global provider of essential minerals, today announced that the company will participate in one-on-one meetings at Deutsche Bank's 17th Annual Basic Materials Conference on June 2, 2026, in New York City. Updated presentation materials will be available at the time of the event through the investor relations section of the Compass Minerals website at compassminerals.com. About Compass Minerals Compass Minerals (NYSE:.

marketbeat.com2026-05-09

Compass Minerals International Q2 Earnings Call Highlights

Compass Minerals International NYSE: CMP reported improved profitability in its fiscal second quarter despite lower revenue, as management pointed to stronger margins, progress in its Plant Nutrition business and a major debt reduction milestone.

seekingalpha.com2026-05-07

Compass Minerals International, Inc. (CMP) Q2 2026 Earnings Call Transcript

Compass Minerals International, Inc. (CMP) Q2 2026 Earnings Call Transcript

zacks.com2026-05-06

Compass Minerals (CMP) Lags Q2 Earnings Estimates

Compass Minerals (CMP) came out with quarterly earnings of $0.63 per share, missing the Zacks Consensus Estimate of $0.66 per share. This compares to earnings of $0.63 per share a year ago.

businesswire.com2026-05-06

Compass Minerals Reports Fiscal 2026 Second-Quarter Results

OVERLAND PARK, Kan.--(BUSINESS WIRE)--Compass Minerals (NYSE: CMP), a leading global provider of essential minerals, today reported fiscal 2026 second-quarter results. The company also announced that unionized employees at its Goderich mine have ratified a new three-year collective bargaining agreement. Unless otherwise noted, it should be assumed that time periods referenced below are on a fiscal-year basis and financial amounts are in U.S. dollars. MANAGEMENT COMMENTARY “Consistent with our B.

zacks.com2026-04-28

SHW Q1 Earnings Top Estimates, Sales Rise Y/Y on Suvinil Buyout

SHW's Q1 EPS rises 7.5% as revenues grow 6.8% on Suvinil, while management reaffirmed 2026 guidance.

seekingalpha.com2026-04-21

Compass Minerals: Pittsburgh's Ice Reveals The Value Chain

Compass Minerals holds structural advantages in salt production, with irreplaceable assets and geographic reach supporting a premium market position. Loss of the SHACOG contract impacts only about 1% of CMP's total volumes, with the company prioritizing value over volume in its strategic outlook. Industry dynamics have shifted favorably for CMP after Cargill's exit, depleted inventories, and early bid season price increases, supporting higher EBITDA potential.

zacks.com2026-04-17

Has Compass Minerals International (CMP) Outpaced Other Basic Materials Stocks This Year?

Here is how Compass Minerals (CMP) and NWPX Infrastructure (NWPX) have performed compared to their sector so far this year.

businesswire.com2026-04-15

Compass Minerals Sets Date for Conference Call to Discuss Second-Quarter Fiscal 2026 Results

OVERLAND PARK, Kan.--(BUSINESS WIRE)--Compass Minerals (NYSE: CMP), a leading global provider of essential minerals, will release its second-quarter fiscal 2026 results on Wednesday, May 6, 2026, after the markets close. The company's president and CEO, Edward C. Dowling Jr., and CFO, Peter Fjellman, will discuss these results on a conference call on Thursday, May 7, 2026, at 9:30 a.m. ET. Access to the conference call will be available via webcast at investors.compassminerals.com or by dialing.

seekingalpha.com2026-04-13

Best 5 Small-Cap Stocks With Forward EPS Growth Above 125%

Small-cap stocks have outperformed amid a rotation away from mega caps, despite geopolitical uncertainty and shifting interest rate expectations. Small-cap firms may benefit from the next phase of AI adoption as productivity gains broaden across industries. Wells Fargo estimates that each 1% reduction in labor costs could translate into a 6.1% earnings increase for Russell 2000 companies.

defenseworld.net2026-04-05

JPMorgan Chase & Co. Sells 27,639 Shares of Compass Minerals International, Inc. $CMP

JPMorgan Chase and Co. reduced its stake in shares of Compass Minerals International, Inc. (NYSE: CMP) by 14.4% during the undefined quarter, according to the company in its most recent Form 13F filing with the Securities and Exchange Commission (SEC). The institutional investor owned 163,987 shares of the basic materials company's stock after

zacks.com2026-04-01

Are Basic Materials Stocks Lagging Compass Minerals International (CMP) This Year?

Here is how Compass Minerals (CMP) and Minerals Technologies (MTX) have performed compared to their sector so far this year.

defenseworld.net2026-03-28

Critical Analysis: Compass Minerals International (NYSE:CMP) and Air Products and Chemicals (NYSE:APD)

Air Products and Chemicals (NYSE: APD - Get Free Report) and Compass Minerals International (NYSE: CMP - Get Free Report) are both basic materials companies, but which is the superior stock? We will contrast the two businesses based on the strength of their institutional ownership, risk, valuation, dividends, analyst recommendations, profitability and earnings. Institutional and Insider Ownership

📊 AI Financial Analysis

Powered by StockMarketInfo
Earnings Data: Q Ending 2026-03-31

"CMP reported Q2 2026 revenue of $453.2M, up +14.4% QoQ (vs. $396.1M in Q1 2026) and down -8.3% YoY (vs. $494.6M in Q2 2025). Net income was $12.7M, improving to positive profitability after losses in prior quarters; it rose +20.4% QoQ (from $10.6M prior quarter was not applicable, but directly from Q1 2026 net income of $18.6M, it was actually -31.8% QoQ—see trend below) and turned sharply higher YoY (from -$32.0M in Q2 2025). EPS was $0.29 (diluted $0.30). Profitability improved sequentially on operating income: operating income was $56.0M (Q1 2026: $36.6M), with gross margin expanding to 18.3% (from 16.0% in Q1 2026). Over the last four reported quarters, margins expanded materially from negative net margins during the 2025 trough (Q2/Q3/Q4) to a positive net margin of 2.8% in Q2 2026. Cash flow strengthened: operating cash flow was $197.4M and free cash flow $179.2M in Q2 2026, a significant rebound versus the prior quarter’s weak cash generation. Balance sheet resilience also improved: total assets fell to $1.37B (from $1.53B in Q1 2026) while equity grew to $274.2M. There are no dividends or share repurchases in the data (dividendsPaid=0, buybacks=0), so shareholder return is primarily price-driven. CMP shows very strong momentum with a +127.1% 1-year change, boosting total shareholder return despite limited cash-return distributions. Analyst valuation context appears rich (P/E ~19.4) relative to a recovering earnings base, but upside sentiment seems supported by recent price action."

Revenue Growth

Neutral

Revenue rose +14.4% QoQ to $453.2M but declined -8.3% YoY vs. $494.6M in Q2 2025, indicating a recovery in sequential demand but not full year-over-year momentum.

Profitability

Strong

Net income turned positive at $12.7M vs. -$32.0M YoY, and operating income improved to $56.0M from $36.6M QoQ. Gross margin expanded to 18.3% (from 16.0% in Q1) and net margin improved to 2.8% after negative margins across 2025.

Cash Flow Quality

Strong

Q2 2026 operating cash flow was $197.4M and free cash flow $179.2M, a sharp rebound from Q1’s -$37.0M operating cash flow. No dividends paid and no buybacks are evident, so cash is primarily improving balance-sheet quality/reducing net debt.

Leverage & Balance Sheet

Positive

For a non-bank, leverage shows improvement: net debt was -$61.8M in Q2 2026 (net cash) vs. $850.2M net debt in Q1 2026. Total assets declined to $1.37B and equity increased to $274.2M.

Shareholder Returns

Strong

Total shareholder return is strongly supported by price momentum: +127.1% 1-year change. Dividend yield is 0 and buybacks are not shown, so returns are predominantly capital appreciation.

Analyst Sentiment & Valuation

Positive

Price ($25.32) is above the consensus target ($23.67), implying limited immediate upside versus Street targets. However, the improving earnings/cash flow trend and strong momentum may explain elevated expectations (P/E ~19.4).

Disclaimer:This analysis is AI-generated for informational purposes only. Accuracy is not guaranteed and this does not constitute financial advice.

Fundamentals Overview

Loading fundamentals overview...

CMP delivered improved profitability despite lower deicing revenue: Q2 revenue fell 8% YoY to $453M, but adjusted EBITDA rose 3.3% to $86M and margins expanded to 19.1% (from 17.0%, +210 bps). Salt volumes declined 19% due to winter timing, yet per-ton operating earnings increased 21% on price realization more than offsetting higher distribution/product costs; however, cost per ton rose YoY because reported costs reflect weather/geographic mix, product mix, and operational efficiency not fully achieved. Plant Nutrition was the standout—adjusted EBITDA margin surged to 25.2% (from 9.6%), aided by Ogden execution and the Wynyard SOP sale completion. Guidance remains effectively unchanged at a $224M midpoint for full-year adjusted EBITDA, though Salt’s midpoint was trimmed to $233M. Balance sheet progress is tangible: CMP redeemed the remaining $150M of 2027 notes early, reduced net debt by $119M YoY, and extended maturities to 2028. Outlook for the bid season is constructive but still early; management is emphasizing value over volume.

AI IconGrowth Catalysts

  • Plant Nutrition momentum continues: Q2 adjusted EBITDA margin rose to 25.2% from 9.6% a year ago, driven by Ogden cost favorability and improved asset utilization
  • Back to Basics operational improvement approach extended from SOP to Salt, focusing on KPIs (safety, utilization, equipment availability, production/development rates, and mining planning)
  • Commissioning additional enterprise improvement teams later in the year to accelerate salt mine production efficiency and cost reductions
  • Salt highway deicing bid-season discipline: maximizing value per ton as inventories remain tight in the northern system

Business Development

  • Completed sale of Wynyard SOP operation during Q2 2026 (portfolio simplification; cash proceeds strengthened liquidity)
  • New collective bargaining agreements completed with 2 sites, including Goderich mine; negotiations concluded at another site and remaining negotiations ongoing

AI IconFinancial Highlights

  • Consolidated revenue $453M, down $41M (-8%) YoY due to lower highway deicing sales timing/seasonality
  • Adjusted EBITDA $86M vs $84M prior year (+3.3% YoY) with adjusted EBITDA margin expanding to 19.1% from 17.0% (+210 bps equivalent)
  • Salt: revenue $383M vs $433M (-$50M, -11.5% YoY); tons sold 4.1M (-19% YoY) attributed to winter weather timing/velocity
  • Salt per-ton operating earnings $15.85 vs $13.10 (+21% YoY), reflecting price realization offset partially by higher distribution and product costs
  • Plant Nutrition: revenue $67M vs $58M (+15.5% YoY); adjusted EBITDA $17M vs materially higher (+202% YoY) and margin 25.2% from 9.6% (+1560 bps equivalent)
  • First half adjusted EBITDA $152M vs $116M (+32% YoY); first-half adjusted EBITDA margin 17.9% vs 14.5% (+340 bps equivalent)
  • Full-year adjusted EBITDA guidance updated to $212M-$236M (midpoint $224M), essentially unchanged; Salt midpoint reduced to $233M from $241M; Plant Nutrition midpoint supported at $45M and range $43M-$47M
  • Debt reduction: redeemed remaining $150M of 2027 senior unsecured notes early using cash on hand; no change to guidance assumptions noted for corporate adjusted EBITDA, capex/DD&A, and effective income tax rate
  • Tax: management stated cash tax guidance largely unchanged within full-year guidance; expected better cash tax update in Q3/Q4

AI IconCapital Funding

  • Retired $150M remaining 2027 senior unsecured notes early (redeemed at end of March; funded from cash on hand)
  • Total net debt $639M at quarter end, down $119M YoY
  • Leverage ratio 2.7x trailing 12-month vs 4.6x last year
  • Liquidity $379M at quarter end: cash $74M plus revolver capacity ~$305M

AI IconStrategy & Ops

  • Extended SOP improvement methodology to Salt starting with larger operations under Back to Basics
  • Salt production cost per ton increased YoY due to: geographic/weather mix, product mix, and facility-level production dynamics; began selling production from current-year output (flows through P&L)
  • Operational KPI focus: maintenance practices, equipment availability, elimination of waste, improved mining planning process, and utilization/production rate improvements
  • Commercial/inventory approach: shift from deicing season to building inventory and preparing for next year’s bid season; value-over-volume discipline

AI IconMarket Outlook

  • Full-year adjusted EBITDA range $212M-$236M (midpoint $224M) essentially unchanged
  • Salt segment adjusted EBITDA midpoint reduced to $233M vs $241M prior; Plant Nutrition adjusted EBITDA range $43M-$47M
  • Bid season: early days; management expects market to be constructive and stated focus remains value over volume; better visibility planned for Q3 earnings call

AI IconRisks & Headwinds

  • Salt reported cost per ton moving higher YoY despite mine-level improvements, driven by regional/weather-driven geographic mix, product mix, and pace of operational efficiency gains not yet fully realized
  • Production efficiency headwinds at Goderich and mine plan execution: improvements are ongoing but taking longer than targeted
  • Winter weather timing/velocity creates quarter-to-quarter volatility in tons sold and resulting revenue
  • Cash tax complexity persists due to shifting effective tax rates across geographies and prior Ontario mining matter/OMT payments; limited near-term cash tax guidance (management expects clearer update in Q3/Q4)

Q&A: Analyst Interest

  • Salt unit cost trajectory: Management declined to provide cost guidance, but emphasized that mine KPIs (availability, utilization, planning, and maintenance) should drive unit cost reductions over time, while acknowledging current headwinds in the mine plan and execution cadence that are still delaying fully realized efficiency gains.
  • Salt margin vs volume puts and takes: Management attributed guidance changes to geographic mix from weather, facility-level production dynamics, and product mix. They highlighted heavier winter sales flowing into higher-cost served markets and different C&I cost profiles, explaining why margins fell even as volumes increased.
  • Cash tax liability outlook: Management said cash tax details are complicated and that nothing materially changed within full-year guidance after prior Ontario mining tax-related resolutions. They noted swing factors driven by Canada income vs U.S. losses and deferred a better cash tax update to Q3/Q4.

Sentiment: MIXED

Note: This summary was synthesized by AI from the CMP Q2 2026 earnings transcript. Financial data is complex; please verify all metrics against official SEC filings before making investment decisions.

📋 Official Regulatory 10-K / 10-Q SEC Filings

Direct authenticated documentation links to audited SEC database reports for CMP.

SEC EDGAR Live Feed
Loading financial data and tables...
📁

SEC Filings (CMP)

© 2026 Stock Market Info — Compass Minerals International, Inc. (CMP) Financial Profile