Deere & Company

Deere & Company (DE) Market Cap

Deere & Company has a market capitalization of $159.98B.

Price: $592.67

-6.80 (-1.13%)

Market Cap: 159.98B

NYSE · time unavailable

CEO: John C. May

Sector: Industrials

Industry: Agricultural - Machinery

IPO Date: 1972-06-01

Website: https://www.deere.com/en

Deere & Company (DE) - Company Information

Market Cap: 159.98B|Sector: Industrials

Company Profile

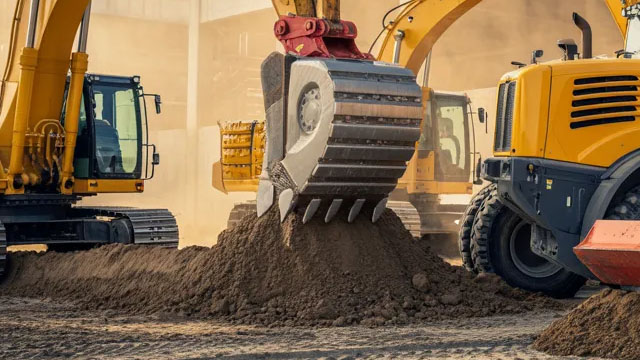
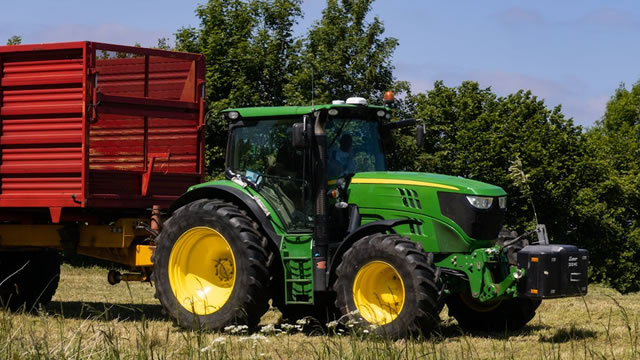
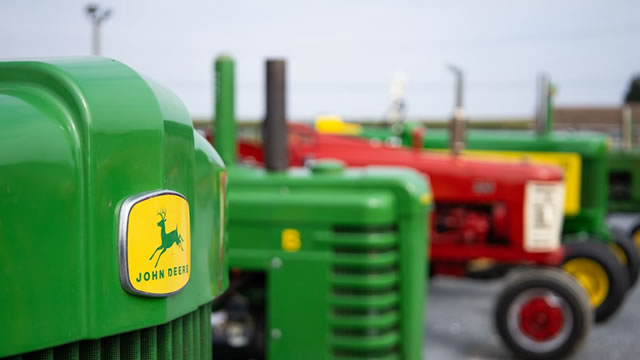
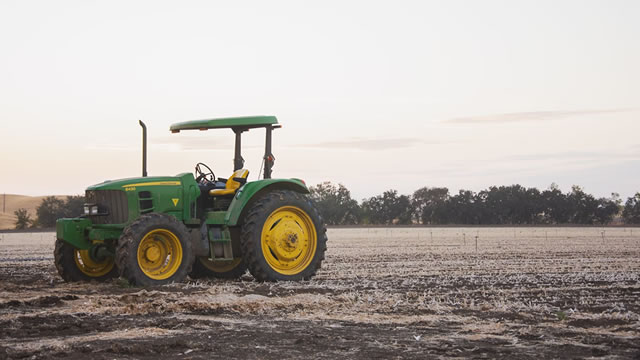
Deere & Company is a global manufacturer and distributor of a wide range of equipment. The company's operations are organized into four primary business segments: Production and Precision Agriculture, Small Agriculture and Turf, Construction and Forestry, and Financial Services. The Production and Precision Agriculture segment focuses on large-scale farming and advanced agricultural practices, offering medium-sized tractors, various harvesting machinery (including combines, cotton pickers, and sugarcane harvesters), front-end harvesting tools, sugarcane loaders, pull-behind scrapers, and essential tillage and seeding implements. It also supplies specialized application equipment like sprayers and nutrient management systems, along with soil preparation machinery, primarily serving grain growers. The Small Agriculture and Turf segment caters to smaller farming needs and land maintenance. Its product line includes utility tractors along with their complementary loaders and attachments. This segment also provides an extensive selection of turf and utility equipment, suchg as riding and commercial lawnmowers, specialized golf course maintenance machinery, and utility vehicles. Additionally, it offers various implements for tasks like mowing, tilling, snow removal, aerating, and general turf care across residential, commercial, golf, and sports environments, alongside other outdoor power products and hay and forage equipment. This division also resells products from other manufacturers. Its customer base includes dairy and livestock farmers, other crop producers, and general turf and utility clients. The Construction and Forestry segment delivers a comprehensive suite of heavy machinery for construction and logging. This includes earthmoving and roadbuilding equipment such as backhoe loaders, crawler dozers and loaders, four-wheel-drive loaders, excavators, motor graders, articulated dump trucks, landscape and skid-steer loaders, milling machines, pavers, compactors, rollers, crushers, screens, and asphalt plants. For forestry operations, it supplies log skidders, feller bunchers, log loaders and forwarders, and log harvesters, in addition to various attachments for all its machinery. Lastly, the Financial Services segment provides funding solutions to facilitate the sale and leasing of agriculture and turf, as well as construction and forestry equipment. It extends wholesale financing to dealers stocking these product lines, offers extended equipment warranties, and manages retail revolving charge accounts for end-users. Established in 1837, Deere & Company has its corporate headquarters situated in Moline, Illinois.

Analyst Sentiment

72%
Buy

From 24 Active Polls

1Y Forecast: $691.58

▲ +16.7% Potential Upside

Consensus Target Metrics

Low Bound

$500

Median

$708

High Bound

$812

Average

$692

Price & Moving Averages

Loading chart...

🎯 Wall Street Analyst Intelligence Report

1-Year structural target targets, chart projections, and sentiment maps.

Average 1Y Target
$691.58
▲ +16.69% Upside
Low Target
$500.00
-16% Risk
Median Target
$707.50
19% Mid
High Target
$812.00
37% Max
Consensus
Hold
18 / 46 Buys

Consensus Trend Projection

Trailing closures vs. 12-month metrics map.

Analyst Vote Distribution

Aggregate institutional coverage sentiment weights.

📊 Historical Valuation Multiples

Real-time Trailing Twelve Month (TTM) momentum side-by-side with discrete quarterly metrics.

Fiscal QuarterTTMQ2 2026Q1 2026Q4 2025Q3 2025Q2 2025Q1 2025Q4 2024Q3 2024
Period EndingTrailing 12MMay 3, 2026Feb 1, 2026Nov 2, 2025Jul 27, 2025Apr 27, 2025Jan 26, 2025Oct 27, 2024Jul 28, 2024
Market Cap ($M)159,984156,223143,867124,862138,206124,760131,495112,407103,423
Enterprise Value ($M)216,241212,480199,868180,522196,272183,370189,549170,546162,532
Price to Earnings Ratio (P/E)33.5022.0454.7629.3126.8117.3037.8222.5614.90
Price/Earnings-to-Growth Ratio (PEG)0.5611.110.34
Price to Sales Ratio (P/S)3.4111.6914.9710.3211.739.9615.9210.388.05
Price to Book Ratio (P/B)5.845.705.474.815.495.145.854.924.48
Price to Free Cash Flow Ratio (P/FCF)42.46178.75-91.1747.5174.95182.93-68.3832.1349.84
Enterprise Value to Sales (EV/Sales)15.8920.8014.9316.6614.6422.9415.7512.65
Enterprise Value to EBITDA (EV/EBITDA)18.8759.1292.5365.6966.3549.8883.3958.6343.37
Debt to Equity Ratio4.912.342.392.462.652.742.882.872.87

📘 Full Research Report

ℹ️

AI-Generated Research: This report is for informational purposes only.

📘 DEERE (DE) — Investment Overview

🧩 Business Model Overview

Deere designs and sells agricultural equipment (e.g., tractors, combines, and related implements) through a deep dealer network, then monetizes the installed base over time via parts, service, and equipment-financing offerings. The value chain has three reinforcing loops: (1) equipment purchase drives (2) an installed base that creates ongoing demand for consumables and maintenance, and (3) financing support and dealer capabilities increase customer retention by smoothing purchase timing and reducing total ownership friction.

💰 Revenue Streams & Monetisation Model

Revenue is primarily earned through three channels: equipment sales (highly cyclical and largely transactional), aftermarket parts and service (more resilient and tied to machine usage and fleet size), and financing/other income (supporting dealer and customer purchases). Over a full cycle, the margin profile tends to be supported by the mix shift toward aftermarket and service as the installed base grows, while equipment margins depend more on production discipline, pricing, and prevailing farm economics. Financing and services also create cross-sell opportunities that strengthen lifetime customer value, rather than relying solely on new machine unit volume.

🧠 Competitive Advantages & Market Positioning

Deere’s moat is best characterized as a combination of switching costs, network advantages through the dealer ecosystem, and aftermarket cost and availability advantages that raise customer retention over long equipment lifecycles.

  • Switching costs (installed base + compatibility): Once farmers and contractors standardize on Deere machines and implements, replacing the fleet involves operational change, parts and technician familiarity, and downtime risk. Deere’s attachment ecosystems and long-lived equipment fleets tend to anchor repeat purchasing in the same brand family.
  • Dealer and service network strength: Competitors can build machines, but rapid parts availability, field service capability, and parts logistics are harder to replicate at scale. Dealers also influence customer decisions through local inventory and technician capacity, reinforcing loyalty.
  • Aftermarket resilience: A larger installed base supports aftermarket revenue stability. Competitors with smaller installed bases typically face greater difficulty sustaining parts and service share during downturns.

Competitive benchmarking: Deere competes most directly with CNH Industrial (Case IH, New Holland), AGCO (Fendt, Massey Ferguson), and Kubota (primarily strong in smaller equipment segments and certain regional end markets). Deere’s positioning emphasizes large-scale agricultural equipment along with precision/ag technology integration, while CNH and AGCO maintain strong share in specific geographies and price segments and compete across a broader portfolio mix. Kubota is a meaningful competitor in smaller tractors and equipment categories, but Deere’s competitive strength is more concentrated in the higher-horsepower and large-scale farm machinery segments where installed-base and service depth materially affect retention.

🚀 Multi-Year Growth Drivers

  • Precision agriculture penetration and data-enabled equipment use: Demand for yield improvement, variable-rate application, and operational efficiency supports gradual adoption of advanced machine controls and related capabilities. The economic payoff to customers strengthens willingness to upgrade within the installed base ecosystem.
  • Fleet replacement and productivity needs: Structural labor constraints and the need to farm more acres per operator sustain long-term replacement activity across tractors, combines, and high-utilization implements.
  • Modernization of agricultural operations: Improved mechanization and higher utilization rates in established and developing agricultural regions expand the addressable market for mechanized and service-intensive equipment.
  • Aftermarket expansion: As machine fleets age, parts and service content per operating hour rises. Service revenue becomes a key lever for earnings durability across cycles.

⚠ Risk Factors to Monitor

  • Agricultural cycle and farm income volatility: Equipment demand is sensitive to commodity prices and crop economics, which can compress unit volumes and dealer inventory turns.
  • Dealer and financing credit risk: Deere’s financing and dealer ecosystem can be exposed during downturns through customer delinquencies and weaker residual values.
  • Regulatory and technology transition costs: Emissions standards and automation/systems requirements may increase engineering complexity and capital intensity.
  • Supply chain and component sourcing: Concentration in key components can create margin pressure and delivery disruptions.
  • Competitive pricing pressure: Sustained promotional pricing by peers can pressure equipment margins, particularly when market demand softens.

📊 Valuation & Market View

The market typically values Deere as a cyclical industrial with defensible aftermarket economics. Common approaches emphasize earnings power and cycle-adjusted cash generation rather than pure growth-rate assumptions. Key valuation drivers include (1) durability and margin contribution of parts and service, (2) equipment pricing discipline and production efficiency, (3) the quality and scale of financing/portfolio outcomes, and (4) operating leverage across downturns and upcycles. Multiple compression risk generally rises when investors expect weaker equipment demand and/or higher credit costs; multiple support typically follows when aftermarket mix and service penetration remain resilient.

🔍 Investment Takeaway

Deere’s long-term investment case rests on an enduring installed-base model: a strong dealer-service ecosystem and equipment compatibility generate practical switching costs, supporting resilient aftermarket revenue through agricultural cycles. Growth is driven by precision agriculture adoption, continued fleet modernization, and the compounding effect of a large, aging installed base—tempered by cyclicality in equipment demand and credit/financing risk during agricultural downturns.


⚠ AI-generated — informational only. Validate using filings before investing.

📰 Market News & Coverage

15 Stories Available

Real-time institutional reporting and market updates for DE.

fool.com2026-07-31

Deere Stock: Buy, Hold, or Sell?

Deere (DE -1.13%) stock has performed well in recent quarters.

zacks.com2026-07-31

ALG or DE: Which Is the Better Value Stock Right Now?

Investors looking for stocks in the Manufacturing - Farm Equipment sector might want to consider either Alamo Group (ALG) or Deere (DE). But which of these two companies is the best option for those looking for undervalued stocks?

zacks.com2026-07-30

Deere (DE) Stock Declines While Market Improves: Some Information for Investors

Deere (DE) closed at $599.47 in the latest trading session, marking a -1.88% move from the prior day.

defenseworld.net2026-07-30

Amundi Increases Holdings in Deere & Company $DE

Amundi boosted its stake in shares of Deere and Company (NYSE: DE) by 18.2% in the undefined quarter, according to the company in its most recent disclosure with the SEC. The firm owned 970,693 shares of the industrial products company's stock after buying an additional 149,224 shares during the quarter. Amundi owned approximately

zacks.com2026-07-28

Here is What to Know Beyond Why Deere & Company (DE) is a Trending Stock

Zacks.com users have recently been watching Deere (DE) quite a bit. Thus, it is worth knowing the facts that could determine the stock's prospects.

zacks.com2026-07-28

These 2 Industrial Products Stocks Could Beat Earnings: Why They Should Be on Your Radar

Investors looking for ways to find stocks that are set to beat quarterly earnings estimates should check out the Zacks Earnings ESP.

defenseworld.net2026-07-25

Bank of Nova Scotia Raises Holdings in Deere & Company $DE

Bank of Nova Scotia grew its holdings in Deere and Company (NYSE: DE) by 128.2% in the first quarter, according to its most recent disclosure with the Securities and Exchange Commission. The fund owned 115,265 shares of the industrial products company's stock after buying an additional 64,747 shares during the period. Bank of

zacks.com2026-07-24

Deere (DE) Rises Higher Than Market: Key Facts

In the closing of the recent trading day, Deere (DE) stood at $628.16, denoting a +2.97% move from the preceding trading day.

zacks.com2026-07-24

These 2 Industrial Products Stocks Could Beat Earnings: Why They Should Be on Your Radar

Why investors should use the Zacks Earnings ESP tool to help find stocks that are poised to top quarterly earnings estimates.

defenseworld.net2026-07-21

Andra AP fonden Boosts Stock Position in Deere & Company $DE

Andra AP fonden raised its holdings in Deere and Company (NYSE: DE) by 120.3% in the first quarter, according to its most recent 13F filing with the Securities and Exchange Commission (SEC). The firm owned 30,803 shares of the industrial products company's stock after purchasing an additional 16,823 shares during the quarter. Andra

defenseworld.net2026-07-21

Deere & Company $DE Shares Sold by AlTi Global Inc.

AlTi Global Inc. lessened its holdings in Deere and Company (NYSE: DE) by 70.8% in the first quarter, according to the company in its most recent Form 13F filing with the Securities and Exchange Commission (SEC). The firm owned 816 shares of the industrial products company's stock after selling 1,979 shares during the

prnewswire.com2026-07-20

John Deere Named Presenting Sponsor of the 2026 MLB at Field of Dreams Game

John Deere and Major League Baseball celebrate the connection between agriculture, community, and America's pastime MOLINE, Ill., July 20, 2026 /PRNewswire/ -- Major League Baseball today named John Deere (NYSE: DE) as the presenting sponsor of this year's MLB at Field of Dreams game between the Minnesota Twins and Philadelphia Phillies on August 13, helping bring to life one of baseball's most meaningful celebrations of farming communities and America's pastime.

defenseworld.net2026-07-20

Dimensional Fund Advisors LP Sells 56,908 Shares of Deere & Company $DE

Dimensional Fund Advisors LP trimmed its holdings in Deere and Company (NYSE: DE) by 2.8% in the undefined quarter, according to its most recent filing with the SEC. The institutional investor owned 1,945,820 shares of the industrial products company's stock after selling 56,908 shares during the quarter. Dimensional Fund Advisors LP owned about

defenseworld.net2026-07-18

Deere & Company (NYSE:DE) Given Average Recommendation of “Moderate Buy” by Brokerages

Deere and Company (NYSE: DE - Get Free Report) has been assigned a consensus recommendation of "Moderate Buy" from the twenty-three ratings firms that are covering the firm, Marketbeat Ratings reports. Nine analysts have rated the stock with a hold rating and fourteen have given a buy rating to the company. The average 12 month target

zacks.com2026-07-16

Deere (DE) Increases Despite Market Slip: Here's What You Need to Know

Deere (DE) reached $598.97 at the closing of the latest trading day, reflecting a +1.61% change compared to its last close.

📊 AI Financial Analysis

Powered by StockMarketInfo
Earnings Data: Q Ending 2026-05-03

"DE reported Q2 2026 revenue of $13.369B and net income of $1.773B (EPS $6.56). QoQ, revenue rose to $13.369B from $9.611B (+39.1%) and net income increased from $0.656B (+170.7%), indicating a sharp earnings rebound this quarter. YoY, revenue was down versus Q2 2025 $12.525B (-6.7%) while net income was slightly lower versus $1.804B (-1.7%); EPS also dipped modestly (from $6.65 to $6.56, -1.4%). Profitability improved sequentially: gross margin expanded to 38.2% from 34.7% (QoQ) and net margin widened to 13.3% from 6.8% (QoQ). However, versus a year ago, margins contracted (gross margin 39.2% in Q2 2025 vs 38.2% now; net margin 14.4% vs 13.3%). Operating income rose QoQ to $3.005B. Cash flow strengthened: operating cash flow was $1.932B and free cash flow was $0.874B in Q2 2026. The company paid dividends of $0.437B, while no share repurchases were reported this quarter. On leverage, total assets increased to $107.0B from $103.4B in Q1, while equity was stable at $27.4B; debt appears lower on the quarter (net debt $7.73B vs $55.68B reported in Q1, noting balance-sheet category jumps). Shareholder returns are supported by strong momentum: the stock is up 30.5% over 1 year. With a low dividend yield (~0.28%) and significant price appreciation, total return drivers are primarily capital appreciation rather than income."

Revenue Growth

Neutral

QoQ revenue +39.1% ($13.369B vs $9.611B). YoY revenue -6.7% ($12.525B vs $13.369B). Trajectory improved sequentially but remains softer versus last year.

Profitability

Good

Net income +170.7% QoQ ($1.773B vs $0.656B) with net margin expanding to 13.3% from 6.8%. YoY profitability slightly down: net income -1.7% and net margin contracted vs 14.4% in Q2 2025.

Cash Flow Quality

Positive

Operating cash flow $1.932B and free cash flow $0.874B in Q2 2026, reversing sharply from Q1 OCF (-$0.890B). Dividends paid were $0.437B; buybacks were not reported this quarter.

Leverage & Balance Sheet

Positive

Assets increased QoQ to $107.0B and equity held at ~$27.4B. Total debt/net debt metrics show large quarter-to-quarter category shifts in the provided data, but liquidity remains substantial with cash & short-term investments of $9.34B.

Shareholder Returns

Strong

Strong momentum: stock +30.51% over 1 year. Dividend yield is low (~0.28%), so total shareholder return is driven mainly by price appreciation.

Analyst Sentiment & Valuation

Positive

Consensus price target (~$673.6) is above the current price (~$590.5), implying upside versus valuation expectations; however, the P/E and cash-flow multiples appear elevated based on the provided ratios.

Disclaimer:This analysis is AI-generated for informational purposes only. Accuracy is not guaranteed and this does not constitute financial advice.

Fundamentals Overview

Loading fundamentals overview...

Deere delivered steady top-line growth in Q2 2026 (+5% net sales to $13.369B) and strong equipment margins (16.9%), but results were materially helped by a one-time IEEPA tariff refund recovery ($272M) that lifted margins nearly 2.5 points. Management framed FY26 as balanced: equipment margin headwinds from ongoing tariff exposure remain embedded (about $1.2B direct tariffs / ~3% margin headwind) with guidance assuming ~$900M of tariff costs net of refunds, while price actions stay restrained (net price realization ~1.5%–2%). Operationally, inventory discipline is a key buffer—North American large Ag new inventories down >50% from mid-2024 peak and used inventories down mid-teens from March 2024 peak—supporting production aligned to retail demand. Market catalysts are construction/road building strength and small ag/turf recovery, while large Ag remains cautious with U.S./Canada industry sales down 15%–20% and Brazil softer (~15% decline). Management maintained unchanged FY26 net income guidance ($4.5B–$5B).

AI IconGrowth Catalysts

  • Road building strength driving Construction & Forestry sales (net sales +29% YoY in Q2; price realization >2.5 points).
  • Small Ag & Turf recovery supporting mid-cycle demand (net sales +16% YoY; operating margin 20.6%).
  • Large Ag support from higher biofuel use / energy prices and improved used inventory; management expects this to position Deere into the large ag upcycle.

Business Development

  • Starlink partnership for satellite connectivity enabling JDLink Boost kits; 12,500+ kits sold and 25% last-quarter growth in kits.
  • U.S. Customs and Border Protection involvement in accepted tariff refund claims (IEEPA / refund recovery).

AI IconFinancial Highlights

  • Q2 net sales +5% YoY to $13.369B; equipment operations net sales +5% YoY to $11.778B.
  • Q2 net income attributable to Deere: $1.773B or $6.55 diluted EPS.
  • Equipment operations margin 16.9% (Q2) with one-time IEEPA tariff refund recovery lifting margins by nearly 2.5 points; $272M refund recovery for accepted claims.
  • Production & Precision Ag: net sales -14% YoY; operating margin 15.7% with price realization +~1 point and FX translation +~3 points.
  • Small Ag & Turf: net sales +16% YoY; operating margin 20.6% driven by higher volumes and price realization +~1.5 points.
  • Construction & Forestry: net sales +29% YoY; operating margin 14.8%; price realization >2.5 points and FX +~3 points; partially offset by unfavorable production costs.
  • Tariff exposure: full-year direct tariff exposure essentially unchanged at ~$1.2B (~3% margin headwind), with guidance assuming ~$900M tariff costs for the year (net of refunds).

AI IconCapital Funding

  • No explicit buyback amount or ending net debt/cash runway disclosed in transcript.
  • Capex/footprint: $70M expansion to build Deere-designed excavators in Kernersville, NC; reiterated $20B of investments in U.S. manufacturing over the next 10 years.

AI IconStrategy & Ops

  • Tightened field inventories and improved used inventory; large Ag new inventories down >50% from mid-2024 peak; combined North American used inventories down mid-teens from March 2024 peak.
  • Planned production aligned to retail demand; EOPs for model-year 2027 spring products launching in late fiscal-year months.
  • Precision Ag/automation progress: 6 new ADAR/ADAR X tractor models; ExactShot automated fertilizer replacement; FurrowVision downforce automation tied to Exact depth solutions; See & Scout camera-derived agronomic insights; senspray expanded targeted application capabilities (wheat, barley, canola).
  • Digital traction: nearly 440,000 monthly active digital users; highly engaged acres up more than 10% YoY (management cited ~10% YoY overall and stronger growth in highly engaged acres).

AI IconMarket Outlook

  • Ag industry (U.S./Canada large Ag): equipment industry sales expected down 15% to 20% (elevated input costs and uncertainty).
  • Ag industry (small ag & turf, U.S./Canada): flat to up 5%; modest turf strengthening expected.
  • South America: tractors and combines now expected to decline ~15% YoY (incremental Brazil softness); management revised Brazil outlook down from down 5%.
  • Construction & Forestry: U.S./Canada earthmoving expected up around 5%; global road building markets expected to grow ~10% YoY; global forestry expected to decline 5%.
  • C&F full-year guidance increased: net sales up ~20% and operating margin raised to 10%–12%.
  • Enterprise: maintained overall net income outlook for fiscal 2026; net income forecast unchanged at $4.5B to $5B; effective tax rate guidance 24%–26%; equipment operations operating cash flow $4.5B to $5.5B.
  • Management commentary: back-half stronger than front-half; Q4 expected higher than Q3 with most favorable cost comparisons in Q4.

AI IconRisks & Headwinds

  • Large Ag customer sentiment muted: grower margins pressured by elevated/volatile input costs and high interest rates; management expects large Ag cycle trough to persist into 2026.
  • Tariff regime volatility: one-time refunds help Q2, but ongoing tariff costs assumed ~$900M for FY26; direct tariff exposure ~$1.2B (~3% margin headwind).
  • Brazil near-term demand uncertainty: higher input costs, political factors, high interest rates, and stronger Brazilian real pressuring grower profitability; management expects cautious market through remainder of fiscal year.
  • Ongoing production-cost inflation (materials and freight) offset partially by tariff refunds; direct tariff expense ex-refunds ~$200M in Q2 headwind.

Q&A: Analyst Interest

  • Tariff policy normalization and how it’s embedded in FY guidance: Management explained Q1 timing pre-Supreme Court IEEPA ruling, then quantified FY exposure essentially unchanged at ~$1.2B direct tariffs (~3% margin headwind). Net of refunds, guidance assumes ~$900M tariff costs for the full year, with price discipline and mitigation efforts.
  • Brazil/South America ag demand update amid Iran-driven inflation: Management revised South America outlook to down ~15% (from down 5%), attributing incremental softness to Brazil. They cited Deere retail sales declining less than the tractor/combine market (~15% in 6 months), with large tractors/combines weaker due to rates, real FX, and spot input exposure.
  • Inventory positioning and production-to-retail management: Management reported new inventories favorably positioned and healthier used inventories, especially in North America. Large Ag new inventories down >50% from mid-2024 peak; combined used inventories down mid-teens from March 2024 peak. They also described order visibility extending into Q3/Q4 in Europe and South America.

Sentiment: MIXED

Note: This summary was synthesized by AI from the DE Q2 2026 earnings transcript. Financial data is complex; please verify all metrics against official SEC filings before making investment decisions.

📋 Official Regulatory 10-K / 10-Q SEC Filings

Direct authenticated documentation links to audited SEC database reports for DE.

SEC EDGAR Live Feed
Loading financial data and tables...
📁

SEC Filings (DE)

© 2026 Stock Market Info — Deere & Company (DE) Financial Profile