Enerpac Tool Group Corp.

Enerpac Tool Group Corp. (EPAC) Market Cap

Enerpac Tool Group Corp. has a market capitalization of $1.77B.

Price: $33.45

0.26 (0.78%)

Market Cap: 1.77B

NYSE · time unavailable

CEO: Paul E. Sternlieb

Sector: Industrials

Industry: Industrial - Machinery

IPO Date: 2000-07-24

Website: https://www.enerpactoolgroup.com

Enerpac Tool Group Corp. (EPAC) - Company Information

Market Cap: 1.77B|Sector: Industrials

Company Profile

Enerpac Tool Group Corp. manufactures and sells a range of industrial products and solutions in the United States, the United Kingdom, Germany, Australia, Canada, China, Saudi Arabia, Brazil, and internationally. It operates in two segments, Industrial Tools & Services (IT&S) and Other. The IT&S segment designs, manufactures, and distributes branded hydraulic and mechanical tools; and provides services and tool rentals to the infrastructure, industrial maintenance, repair and operations, oil and gas, mining, renewable energy, and construction markets. It also offers branded tools and engineered heavy lifting technology solutions, and hydraulic torque wrenches; maintenance and manpower services; high-force hydraulic and mechanical tools, including cylinders, pumps, valves, and specialty tools; and bolt tensioners and other miscellaneous products. This segment markets its branded tools and services primarily under the Enerpac, Hydratight, Larzep, and Simplex brands. The Other segment designs and manufactures synthetic ropes and biomedical textiles. The company was formerly known as Actuant Corporation and changed its name to Enerpac Tool Group Corp. in January 2020. Enerpac Tool Group Corp. was incorporated in 1910 and is headquartered in Menomonee Falls, Wisconsin.

Analyst Sentiment

78%
Strong Buy

From 3 Active Polls

1Y Forecast: $37.00

▲ +10.6% Potential Upside

Consensus Target Metrics

Low Bound

$23

Median

$37

High Bound

$51

Average

$37

Price & Moving Averages

Loading chart...

🎯 Wall Street Analyst Intelligence Report

1-Year structural target targets, chart projections, and sentiment maps.

Average 1Y Target
$37.00
▲ +10.61% Upside
Low Target
$23.00
-31% Risk
Median Target
$37.00
11% Mid
High Target
$51.00
52% Max
Consensus
Hold
2 / 19 Buys

Consensus Trend Projection

Trailing closures vs. 12-month metrics map.

Analyst Vote Distribution

Aggregate institutional coverage sentiment weights.

📊 Historical Valuation Multiples

Real-time Trailing Twelve Month (TTM) momentum side-by-side with discrete quarterly metrics.

Fiscal QuarterTTMQ1 2026Q4 2025Q3 2025Q2 2025Q1 2025Q4 2024Q3 2024Q2 2024
Period EndingTrailing 12MFeb 28, 2026Nov 30, 2025Aug 31, 2025May 31, 2025Feb 28, 2025Nov 30, 2024Aug 31, 2024May 31, 2024
Market Cap ($M)1,7652,1391,9722,2662,3182,5172,6182,2412,135
Enterprise Value ($M)1,8542,2282,0222,3422,3682,5902,6802,3032,198
Price to Earnings Ratio (P/E)20.5032.7925.7820.1726.2930.1130.1322.9420.70
Price/Earnings-to-Growth Ratio (PEG)4.463.612.91131.664.142.40
Price to Sales Ratio (P/S)2.8213.8213.6813.5214.6117.3018.0314.1214.19
Price to Book Ratio (P/B)4.305.254.585.225.296.206.585.725.84
Price to Free Cash Flow Ratio (P/FCF)15.96214.04148.3243.3466.071399.08937.5859.0974.94
Enterprise Value to Sales (EV/Sales)14.3914.0213.9814.9317.7918.4614.5114.62
Enterprise Value to EBITDA (EV/EBITDA)12.9268.2562.6553.0368.7377.2078.4670.0461.00
Debt to Equity Ratio0.620.460.440.530.440.470.490.580.54

EPAC Growth Runway Model

Standard long term linear growth fade

Multi-Stage Discounted Cash Flow Sandbox

Market Price$33.45
Intrinsic Value$40.32
Market Alignment
Undervalued by 20.5%relative to calculated intrinsic value
9.00%
Exp: 2%2%
i

Growth runway slowdown

This value provides a time window for the growth rate to decline beyond Stage 1 toward the terminal rate. Longer windows are most useful for companies with high growth starting conditions or strong competitive advantages. This option stretches out the growth rate slowdown across 5, 10, or 15-year steps. A high-growth starting condition (exceeding a 25% initial growth rate) automatically applies a curve decay to simulate realistic, rapid market saturation.
i

Terminal growth rate

With long-term inflation between 3-5%, revenue must grow by that baseline to maintain flat real-world market share. This value sets the permanent terminal growth rate to factor into the valuation beyond the growth slowdown runway toward maturity.

3-Stage Financial Runway Horizon

🧠 Perpetuity Horizon Engine (Stage 3: Post-2035)

Terminal FCF Base$0.19B
Perpetuity TV Value$3.60B
Discounted TV (PV)$1.52B
TV Weighting %58.7%
⚠️
Financial Model Disclaimer & Risk Disclosure: This interactive scenario simulator is an educational sandbox provided strictly for informational and analytical research purposes. Core historical financial statements and consensus estimates are sourced directly via Financial Modeling Prep (FMP). All downstream outputs are entirely deterministic, hypothetical projections generated by combining automated mathematical formulas (including linear interpolation and Gaussian bell-curve decay models) with user-selected variables and third-party financial data inputs. Users assume all liability for trading decisions executed based on these sandbox calculations.

📘 Full Research Report

ℹ️

AI-Generated Research: This report is for informational purposes only.

📘 ENERPAC TOOL GROUP CORP CLASS A (EPAC) — Investment Overview

🧩 Business Model Overview

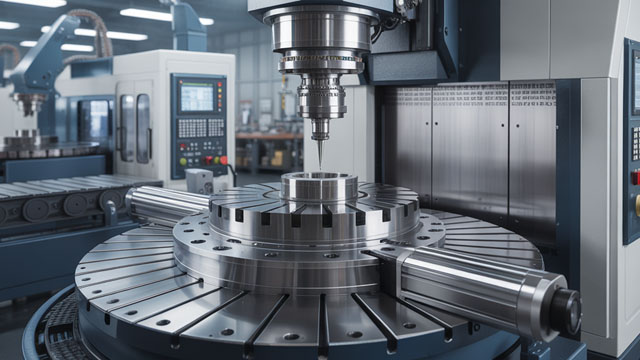
Enerpac Tool Group provides engineered, high-pressure hydraulic and mechanical tool solutions used to lift, pull, clamp, and position heavy loads in industrial maintenance and construction-intensive applications. The value proposition is less about one-off equipment and more about delivering dependable force, precision, and safety in environments where downtime and improper handling carry high operational risk.

The company sells tools and related equipment through industrial and construction supply channels, OEM partners, and distributors. A meaningful portion of value is sustained through the aftermarket ecosystem—replacement parts, consumables, service support, and accessories—typically tied to an installed base of hydraulic systems that customers keep in operation across multi-year project and maintenance cycles.

💰 Revenue Streams & Monetisation Model

  • Equipment and project-driven tool sales (transactional): Hydraulic pumps, jacks, cylinders, fastening and pulling tools, plus system components sold to end users and channel partners.
  • Aftermarket (recurring, installed-base dependent): Replacement parts, hoses, seals, couplers, valves, and accessories that support continued use of existing tool platforms.
  • Service/solutions enablement (select recurring elements): Product support, technical guidance, and application-specific recommendations that increase parts consumption and improve retention within the installed base.

Margin drivers typically include the mix shift toward aftermarket and higher-value integrated tool solutions, manufacturing scale and component commonality, and the ability to maintain pricing discipline in safety-critical applications. Input costs (notably metals and hydraulic components) and freight can pressure gross margin, while product standardization and service penetration can offset some volatility.

🧠 Competitive Advantages & Market Positioning

Enerpac’s core moat is an installed-base and switching-cost advantage. Hydraulic tooling is a platform choice: once customers establish workflows, compatibility requirements (hoses, couplers, pressure ratings), safety practices, and trained usage standards, they tend to prefer maintaining that ecosystem to avoid downtime, requalification burden, and performance uncertainty.

  • High Switching Costs: Compatibility with existing pumps/cylinders, standardized components, and operational procedures make platform changes costly.
  • Aftermarket Attachment: Replacement parts and consumables create a durable retention loop tied to in-use assets.
  • Intangible Asset / Engineering Discipline: Precision and reliability in pressure-rated systems support customer trust in safety-critical lifting and maintenance use cases.

Competitive benchmarking (primary peers):

  • SPX Technologies: Offers industrial tooling and fluid-handling related solutions that compete for maintenance and industrial utility applications.
  • Parker Hannifin: Provides broad industrial motion and hydraulics; competition can arise where customers seek integrated fluid power architectures.
  • Actuant-era hydraulic and industrial tool brands (legacy market participants now under other structures): Historically competed on similar hydraulic tooling categories, emphasizing distribution reach and price/performance.

EPAC’s positioning emphasizes engineered hydraulic tool platforms and a parts-and-service ecosystem rather than broad, generalized industrial hydraulics alone. That focus supports deeper customer lock-in in lifting, pulling, and force application scenarios where repeatable performance and compatible tooling matter.

🚀 Multi-Year Growth Drivers

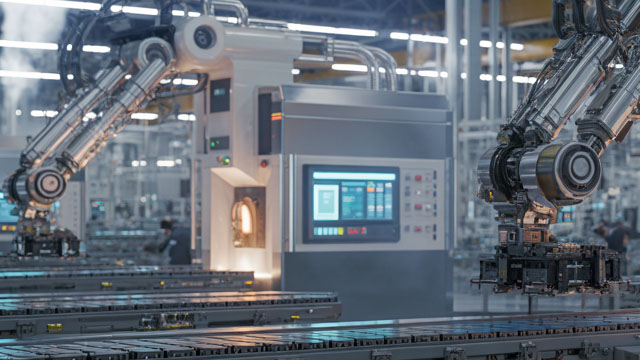
  • Industrial maintenance intensity: Continuous upkeep of aging industrial assets supports steady demand for lifting and force application tools.
  • Infrastructure and energy-related construction: Grid buildout, renewables installation, and supporting infrastructure require specialized lifting and positioning tools.
  • Safety and productivity standards: Customers increasingly prefer equipment that reduces incident risk and improves execution speed in heavy maintenance and assembly.
  • Aftermarket compounding: As the installed base grows, replacement cycles and consumable demand create a structural source of revenue durability.
  • Geographic channel expansion: Increasing penetration through industrial distribution networks can extend reach without requiring the same level of end-user retraining as pure replacement procurement.

Over a 5–10 year horizon, the TAM is driven by the scale of industrial maintenance, construction activity, and long-lived capital stock that must be serviced repeatedly. EPAC’s installed-base model supports relative resilience versus more purely cyclical, one-time equipment categories.

⚠ Risk Factors to Monitor

  • End-market cyclicality: Industrial capex and large project timing can impact equipment demand.
  • Competitive pricing pressure: Tool categories can see periodic promotional dynamics through distributors or private-label alternatives in less specialized use cases.
  • Input cost and supply chain volatility: Metals and hydraulic component costs, as well as logistics, can compress margins.
  • Technology substitution: Electric and alternative actuation methods could displace a portion of hydraulic demand where customers prioritize different performance attributes.
  • Regulatory and safety compliance: Product safety requirements and testing standards can increase costs and reduce flexibility if specifications change.

📊 Valuation & Market View

The market typically values industrial tooling and engineered solutions companies through earnings-based and cash-flow-based multiples (often EV/EBITDA) and, for growth or aftermarket tilt, sometimes also P/S. Key valuation sensitivities include:

  • Aftermarket mix and parts penetration: Higher recurring contribution generally supports valuation durability.
  • Operating margin sustainability: Evidence of cost discipline and pricing power in safety-critical categories matters.
  • Free cash flow conversion: Working capital discipline and capex efficiency can move investor perceptions.
  • Operational leverage across cycles: Ability to protect margins during demand softness is a key differentiator.

🔍 Investment Takeaway

Enerpac Tool Group offers a structural value proposition rooted in installed-base retention, compatibility-driven switching costs, and a durable aftermarket ecosystem. While demand remains exposed to industrial and construction cycles, the platform nature of hydraulic tooling and the safety-critical role of force application tools provide a defensible foundation for long-term compounding, supported by multi-year maintenance and infrastructure activity.


⚠ AI-generated — informational only. Validate using filings before investing.

📰 Market News & Coverage

15 Stories Available

Real-time institutional reporting and market updates for EPAC.

zacks.com2026-05-22

Do Options Traders Know Something About Investors in Enerpac Tool Group Stock We Don't?

Investors need to pay close attention to EPAC stock based on the movements in the options market lately.

globenewswire.com2026-05-04

Enerpac Tool Group Announces Executive Leadership Promotions

MILWAUKEE, Wis., May 04, 2026 (GLOBE NEWSWIRE) -- Enerpac Tool Group Corp. (NYSE: EPAC) (the “Company” or “Enerpac”) announced today that Phil Jefferson, who has served as Regional President, Americas & EMEA, since November of 2024 after joining the company in July 2023, will now take on additional responsibility in the role of Executive Vice President, Chief Commercial Officer, which will include commercial oversight of the Asia Pacific (APAC) Region. This change will help drive key initiatives, strategies, and best practices across the globe.

defenseworld.net2026-04-06

JPMorgan Chase & Co. Buys 18,262 Shares of Enerpac Tool Group Corp. $EPAC

JPMorgan Chase and Co. raised its stake in Enerpac Tool Group Corp. (NYSE: EPAC) by 37.8% during the third quarter, according to its most recent filing with the Securities and Exchange Commission. The fund owned 66,552 shares of the company's stock after buying an additional 18,262 shares during the period. JPMorgan Chase and

seekingalpha.com2026-03-26

Enerpac Tool Group Corp. (EPAC) Q2 2026 Earnings Call Transcript

Enerpac Tool Group Corp. (EPAC) Q2 2026 Earnings Call Transcript

zacks.com2026-03-25

Enerpac (EPAC) Q2 Earnings Match Estimates

Enerpac (EPAC) came out with quarterly earnings of $0.39 per share, in line with the Zacks Consensus Estimate . This compares to earnings of $0.39 per share a year ago.

globenewswire.com2026-03-25

Enerpac Tool Group Reports Second Quarter Fiscal 2026 Results

Second Quarter of Fiscal 2026 Highlights * Net sales were $155 million, a 6% increase compared to the prior year, with a 2% increase in organic sales1. IT&S Product sales increased 6% organically, the highest growth in 10 quarters.

zacks.com2026-03-19

4 Manufacturing Tools Stocks to Watch on Prospering Industry Trends

Increase in manufacturing activities, technological progress and strategic acquisitions favor the Zacks Manufacturing-Tools & Related Products industry's near-term prospects. SWK, CNM, KMT and EPAC are some promising stocks in the industry.

zacks.com2026-03-18

Enerpac (EPAC) Reports Next Week: What to Know Ahead of the Release

Enerpac (EPAC) doesn't possess the right combination of the two key ingredients for a likely earnings beat in its upcoming report. Get prepared with the key expectations.

defenseworld.net2026-03-16

Enerpac Tool Group Corp. $EPAC Shares Purchased by Bamco Inc. NY

Bamco Inc. NY raised its stake in Enerpac Tool Group Corp. (NYSE: EPAC) by 6.1% in the third quarter, according to the company in its most recent disclosure with the Securities and Exchange Commission. The fund owned 446,217 shares of the company's stock after acquiring an additional 25,494 shares during the quarter. Bamco

defenseworld.net2026-03-15

Enerpac Tool Group (NYSE:EPAC) Sets New 52-Week Low – Here’s What Happened

Enerpac Tool Group Corp. (NYSE: EPAC - Get Free Report) shares reached a new 52-week low during mid-day trading on Friday. The stock traded as low as $34.90 and last traded at $35.0790, with a volume of 86115 shares. The stock had previously closed at $35.81. Wall Street Analyst Weigh In EPAC has been the

defenseworld.net2026-03-12

Enerpac Tool Group Corp. $EPAC Holdings Increased by Capital International Investors

Capital International Investors increased its stake in Enerpac Tool Group Corp. (NYSE: EPAC) by 9.8% in the undefined quarter, according to its most recent Form 13F filing with the Securities and Exchange Commission (SEC). The institutional investor owned 4,530,064 shares of the company's stock after acquiring an additional 403,834 shares during the period.

globenewswire.com2026-03-06

Enerpac Tool Group Schedules Second Quarter Fiscal 2026 Earnings Release and Conference Call

MILWAUKEE, March 06, 2026 (GLOBE NEWSWIRE) -- Enerpac Tool Group Corp. (NYSE: EPAC) announced today that it will release its second quarter fiscal 2026 earnings after the market closes on Wednesday, March 25, 2026. Management will conduct a conference call to discuss the results on Thursday, March 26, 2026, beginning at 8:30 a.m. ET / 7:30 a.m. CT.

defenseworld.net2026-02-10

Enerpac Tool Group Corp. (NYSE:EPAC) Receives Average Rating of “Hold” from Brokerages

Shares of Enerpac Tool Group Corp. (NYSE: EPAC - Get Free Report) have been given an average rating of "Hold" by the five analysts that are presently covering the firm, Marketbeat reports. Three equities research analysts have rated the stock with a hold recommendation and two have assigned a buy recommendation to the company. The average

defenseworld.net2026-01-26

Cooke & Bieler LP Has $63.39 Million Stock Position in Enerpac Tool Group Corp. $EPAC

Cooke and Bieler LP grew its holdings in Enerpac Tool Group Corp. (NYSE: EPAC) by 46.2% in the third quarter, according to the company in its most recent Form 13F filing with the SEC. The firm owned 1,546,003 shares of the company's stock after acquiring an additional 488,209 shares during the quarter. Cooke

zacks.com2025-12-23

4 Manufacturing Tools Stocks to Watch on Prospering Industry Trends

Technological progress, digitization and strategic acquisitions favor the Zacks Manufacturing-Tools & Related Products industry's near-term prospects. SWK, CNM, KMT and EPAC are some promising stocks in the industry.

📊 AI Financial Analysis

Powered by StockMarketInfo
Earnings Data: Q Ending 2026-02-28

"EPAC reported revenue of $154.8M and net income of $16.3M (EPS: $0.32) for the quarter ending 2026-02-28, implying a net margin of ~10.5%. Free cash flow was reported at $23.3B, with operating cash flow of $29.0B and capex of $5.7B, alongside dividends paid of $2.12B. Profitability appears solid based on the double-digit net margin and positive EPS, though the lack of prior-quarter/year figures limits visibility into trend momentum. Cash flow generation is a clear strength in the provided quarter, with FCF comfortably covering dividends paid (dividends equate to roughly ~9% of reported FCF). Leverage is moderate: net debt of $88.5M against equity of $407.5M suggests net debt/equity of ~0.22, indicating reasonable balance-sheet resilience. Valuation context is mixed. The stock price is $36.47 and is down -18.7% over 1 year, which weighs on total shareholder returns. Analyst consensus price target is $51 (above the current price), signaling that expectations may be more constructive than recent trading performance. Overall, investors are currently paying for a turnaround in price performance despite strong reported cash generation and sustained dividends."

Revenue Growth

Fair

Revenue of $154.8M is reported, but no YoY or sequential growth rates were provided, limiting confidence on whether underlying demand is accelerating or stabilizing.

Profitability

Positive

Net income of $16.3M on $154.8M revenue implies ~10.5% net margin and EPS of $0.32, indicating solid profitability for the period.

Cash Flow Quality

Good

Reported operating cash flow of $29.0B and free cash flow of $23.3B are strong versus dividends paid of $2.12B, suggesting robust cash generation and dividend coverage in the quarter.

Leverage & Balance Sheet

Neutral

Net debt of $88.5M versus equity of $407.5M implies net debt/equity of ~0.22, indicating moderate leverage and generally manageable balance-sheet risk.

Shareholder Returns

Neutral

Share price performance has been negative (-18.7% over 1 year). Dividends are modest ($0.04 per quarter historically) and buybacks were not provided, so total shareholder return is currently more pressured by price than supported by capital return.

Analyst Sentiment & Valuation

Neutral

Consensus price target is $51 versus $36.47 current price (target above market), which signals more favorable expectations, but valuation multiples and ROE/FCF yield were not provided to fully benchmark the stock.

Disclaimer:This analysis is AI-generated for informational purposes only. Accuracy is not guaranteed and this does not constitute financial advice.

Fundamentals Overview

Loading fundamentals overview...

Management sounded constructive on product momentum and deal flow (6% organic product growth; HLT backlog “strong and healthy”; CONEXPO generated meaningful orders; U.K. North Sea five-year contract starting in Q4). However, the Q&A pressure points were clearly service-led: analysts focused on macro impact and service stability, and management repeatedly tied near-term results to expected service weakness (Q3 “tough,” Q4 rebound) plus ongoing restructuring. Financially, the hard numbers confirm deterioration despite cost control: gross margin down 410 bps YoY, driven by service volume pressure (IT&S service -17%, EMEA service -21%). Management’s mitigation is mostly rightsizing (Q2 $3.3M restructuring; ~1-year payback), procurement/manufacturing efficiency via PEP, and guidance narrowing with service contraction in the low- to mid-teens. The Middle East risk (~10% of revenue) is framed as timing deferrals rather than permanent loss, but uncertainty remains elevated. Overall: positive commercial signals, cautious near-term earnings/margins.

AI IconGrowth Catalysts

  • IT&S product sales up 6% organically YoY (highest product growth in 10 quarters since 2023)
  • Cortland (Other segment) revenue up 27% in Q2 on new project wins
  • HLT and Standard products growth in Americas; HLT backlog described as strong/healthy
  • CONEXPO engagement leading to meaningful orders booked at the show

Business Development

  • Five-year U.K. North Sea oil & gas contract award (HydroTite maintenance + pipeline service); “several million dollars annually”; start expected in Q4
  • National account gains noted in Americas product business
  • CONEXPO Las Vegas: strong customer engagement around data centers with HLT; repeat orders mentioned
  • Hydropack acquisition tuck-in: split flow pump line (diesel-powered) enabled by acquisition; announced and shown at CONEXPO

AI IconFinancial Highlights

  • Q2 revenue: $155.0M; +2% organic YoY
  • IT&S: product revenue +6% organically; service revenue -17% (overall IT&S organic +1% due to service decline)
  • EMEA: product revenue +7% but Q2 revenue -1% due to service revenue -21%
  • Gross margin: -410 bps YoY (service volume pressure; FX ~50 bps headwind)
  • Adjusted SG&A: 26.4% of revenue vs 28.3% prior year (-190 bps)
  • Adjusted EBITDA margin: 21.3% vs 23.2% prior year (-190 bps)
  • EPS: GAAP $0.31 vs $0.38 prior year; adjusted EPS $0.39 vs $0.39 prior year
  • Restructuring charge in Q2: $3.3M primarily related to service business; initial savings expected in Q3; payback ~1 year
  • Free cash flow guidance held: $100M–$110M (and YTD FCF up to $23M from $5M)

AI IconCapital Funding

  • Share repurchases in Q2: $51.0M
  • Remaining authorization: ~$135.0M out of $200.0M authorized (Oct 2025)
  • Net debt: $89.0M; net debt / adj. EBITDA: 0.6x
  • Total liquidity: $499.0M (cash + revolver availability)
  • YTD cash from operations: $29.0M vs $16.0M prior year; YTD free cash flow: $23.0M vs $5.0M

AI IconStrategy & Ops

  • EMEA service rightsizing: reducing headcount to align HydroTite service operations with current market conditions; restructuring charge $3.3M; expected cost-structure improvement
  • Service margin mitigation: procurement initiatives and PEP (Powering Enerpac Performance) targeting efficiency/productivity in manufacturing footprint
  • Service cadence: Q3 expected “tough”, Q4 expected “rebound”
  • Innovation acceleration at CONEXPO: launched 6 new products (vs 5 in fiscal 2025); reduced time-to-market via prototype facilities/innovation lab

AI IconMarket Outlook

  • Fiscal 2026 net sales guidance: $635M–$650M; organic growth 1%–3%
  • Growth mix: mid-single-digit product growth offset by service contraction in low- to mid-teens range
  • Fiscal 2026 adjusted EBITDA: $158M–$163M
  • Fiscal 2026 adjusted EPS: $1.85–$1.92
  • Fiscal 2026 free cash flow: $100M–$110M (held despite service pressure)
  • Gross margin framework: sequential improvement into Q3 then Q4; Q2 gross margin “roughly 46%, just north of that”

AI IconRisks & Headwinds

  • Service business pressure: Q2 IT&S service revenue -17% and EMEA service revenue -21%; gross margin -410 bps YoY due to lower service volume
  • Middle East conflict uncertainty: ~10% of total company revenue; service pauses due to inability to access facilities and customer site shutdowns/deferrals; work expected to be pushed out (“pushed to the right”) with potential need to return post-conflict
  • Macro/region risk: higher oil prices, inflation, general economic headwinds cited as broader impacts
  • Service restructuring history and ongoing burden: two restructurings in past year; Q3 tough expected and service headwinds in Europe and the Middle East cited
  • FX impact: roughly 50 bps headwind to gross margin

Sentiment: MIXED

Note: This summary was synthesized by AI from the EPAC Q2 2026 earnings transcript. Financial data is complex; please verify all metrics against official SEC filings before making investment decisions.

📋 Official Regulatory 10-K / 10-Q SEC Filings

Direct authenticated documentation links to audited SEC database reports for EPAC.

SEC EDGAR Live Feed
Loading financial data and tables...
📁

SEC Filings (EPAC)

© 2026 Stock Market Info — Enerpac Tool Group Corp. (EPAC) Financial Profile