Five Below, Inc.

Five Below, Inc. (FIVE) Market Cap

Five Below, Inc. has a market capitalization of $12.01B.

Price: $217.13

-2.04 (-0.93%)

Market Cap: 12.01B

NASDAQ · time unavailable

CEO: Winifred Y. Park

Sector: Consumer Cyclical

Industry: Specialty Retail

IPO Date: 2012-07-19

Website: https://www.fivebelow.com

Five Below, Inc. (FIVE) - Company Information

Market Cap: 12.01B|Sector: Consumer Cyclical

Company Profile

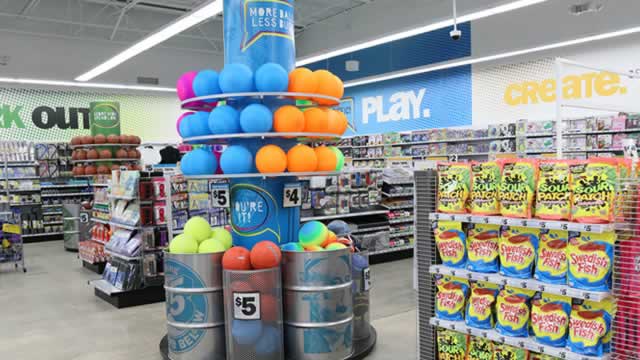
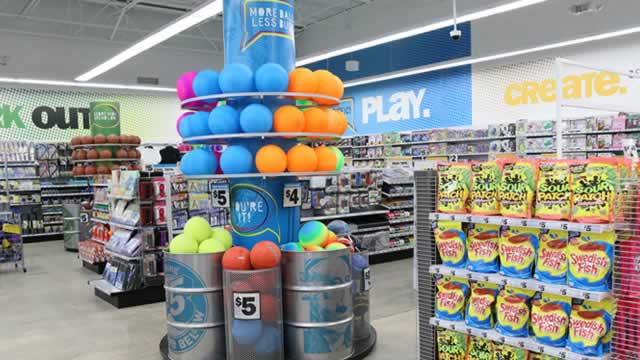
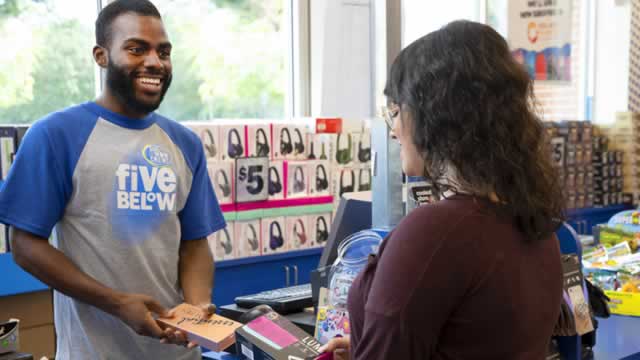
Five Below, Inc. operates as a prominent specialty discount retailer primarily serving the United States market. The company's diverse inventory spans a wide array of personal accessories, from fashionable novelty socks, sunglasses, and jewelry to scarves, gloves, hair accessories, and athletic apparel like tops, bottoms, and t-shirts. Shoppers can also find a comprehensive selection of beauty products, including nail polish, lip gloss, fragrances, and various branded cosmetics. For home and personal spaces, Five Below provides an assortment of items such as lamps, posters, picture frames, cozy fleece blankets, plush toys, pillows, candles, incense, and diverse lighting and novelty décor. This section also includes accent furniture and practical storage solutions. Athletic and recreational interests are covered with sports balls, team merchandise, and fitness essentials like hand weights, jump ropes, and gym balls. The store also boasts a variety of games, from classic board games and puzzles to collectibles and remote-control toys, alongside seasonal outdoor and water-based fun items for pools and beaches. Furthermore, the company caters to technology enthusiasts with accessories for cell phones, tablets, audio devices, and computers, offering cases, chargers, headphones, and related gadgets. Media products, including books, video games, and DVDs, are also available. Creativity is encouraged through a selection of craft activity kits and art supplies like crayons, markers, and stickers. Students can find school essentials such as backpacks, trendy notebooks and journals, novelty pens and pencils, and locker embellishments. For celebrations, Five Below offers party goods, decorations, gag gifts, and greeting cards, encompassing both everyday and special occasion merchandise. A sweet tooth is satisfied with a range of classic and novelty candy bars, movie-sized boxes, seasonal treats, gum, and snack foods, complemented by chilled beverages. Additionally, the retailer stocks a rotating selection of seasonally-themed items for holiday decorating and events. Initially founded as Cheap Holdings, Inc., the company officially adopted the name Five Below, Inc. in August 2002, the same year it was incorporated. Its corporate headquarters are situated in Philadelphia, Pennsylvania.

Analyst Sentiment

72%
Strong Buy

From 27 Active Polls

1Y Forecast: $245.11

▲ +12.9% Potential Upside

Consensus Target Metrics

Low Bound

$215

Median

$242

High Bound

$285

Average

$245

Price & Moving Averages

Loading chart...

🎯 Wall Street Analyst Intelligence Report

1-Year structural target targets, chart projections, and sentiment maps.

Average 1Y Target
$245.11
▲ +12.89% Upside
Low Target
$215.00
-1% Risk
Median Target
$242.00
11% Mid
High Target
$285.00
31% Max
Consensus
Buy
31 / 50 Buys

Consensus Trend Projection

Trailing closures vs. 12-month metrics map.

Analyst Vote Distribution

Aggregate institutional coverage sentiment weights.

📊 Historical Valuation Multiples

Real-time Trailing Twelve Month (TTM) momentum side-by-side with discrete quarterly metrics.

Fiscal QuarterTTMQ2 2026Q1 2026Q4 2025Q3 2025Q2 2025Q1 2025Q4 2024Q3 2024
Period EndingTrailing 12MMay 2, 2026Jan 31, 2026Nov 1, 2025Aug 2, 2025May 3, 2025Jan 31, 2025Nov 2, 2024Aug 3, 2024
Market Cap ($M)12,00612,73910,5758,6747,3334,6415,1605,2773,807
Enterprise Value ($M)13,36614,09911,88310,3378,7896,1896,8097,0755,493
Price to Earnings Ratio (P/E)27.1825.8411.0959.5742.6828.106.88781.1928.83
Price/Earnings-to-Growth Ratio (PEG)0.1753.447.350.11475.3612.86
Price to Sales Ratio (P/S)2.369.916.128.357.144.783.716.254.59
Price to Book Ratio (P/B)5.195.514.824.453.852.502.853.272.37
Price to Free Cash Flow Ratio (P/FCF)23.7667.0426.43-65.14151.9048.1216.57-47.55-117.69
Enterprise Value to Sales (EV/Sales)10.976.879.968.566.384.908.396.62
Enterprise Value to EBITDA (EV/EBITDA)17.0766.0032.48105.4883.2460.0522.98155.5663.85
Debt to Equity Ratio1.740.860.931.031.061.061.101.221.18

📘 Full Research Report

ℹ️

AI-Generated Research: This report is for informational purposes only.

📘 FIVE BELOW INC (FIVE) — Investment Overview

🧩 Business Model Overview

Five Below operates an off-price specialty retail model focused on value-oriented discretionary categories, primarily serving children, teens, and families. The company sources a broad assortment of giftable and trend-sensitive products (including seasonal items, games, arts & crafts, phone accessories, and entertainment-related merchandise) and sells them through a dense store footprint designed for fast inventory turnover and low price points. A consistent “value architecture” (clean merchandising, constrained price bands, and rapid assortment refresh) supports store traffic and repeated visits, while distribution and procurement scale help manage total landed cost.

💰 Revenue Streams & Monetisation Model

Revenue is overwhelmingly transactional: merchandise sales generated in stores (with limited relative contribution from e-commerce). Monetisation is driven by (1) product mix within the company’s curated value tiers, (2) inventory availability and sell-through, and (3) operating leverage as fixed costs are spread across a growing store base. Margin structure is primarily influenced by gross margin discipline (sourcing cost and markdown control) and operating expenses (labor productivity, shrink, and logistics efficiency). Because the business is inventory-led rather than subscription-led, earnings power tends to move most with inventory turns, demand forecasting quality, and the ability to keep markdown rates contained.

🧠 Competitive Advantages & Market Positioning

Moat: Scale-enabled cost advantage + merchandising execution—not a “switching cost” moat, but rather an operational and sourcing advantage that supports sustained value pricing.

  • Scale/Distribution leverage: A larger store base increases purchasing volume and bargaining power with vendors, improving the company’s ability to secure attractive landed costs and manage supply continuity across fast-moving categories.
  • Private-label / proprietary assortment resistance (selectively): Where the company uses differentiated product development and vendor partnerships, it reduces direct price competition on identical items and supports more stable gross margins than pure commodity-based retailers.
  • Retail merchandising discipline: The company’s value-tier approach relies on tighter assortment curation and rapid refresh cycles to match demand patterns typical of younger consumers.

Competitive benchmarking: The company’s core competitors include:

  • Dollar General (DG) and Dollar Tree (DLTR): more heavily weighted toward replenishment (consumables) and broad dollar-store assortments, with lower emphasis on trend-driven discretionary categories.
  • Ross Stores (ROST) and TJX Companies (TJX) (off-price department store operators): stronger in branded off-price apparel and home categories, typically with different sourcing dynamics and less “single-customer value architecture” around teens.

Five Below differentiates by concentrating on value-first, youth-oriented discretionary merchandise and maintaining a disciplined price presentation, whereas dollar stores compete on everyday replenishment breadth and off-price department stores compete on branded treasure-hunt inventory and vendor opportunistic buying.

🚀 Multi-Year Growth Drivers

  • Store penetration with productivity discipline: Expanding the store base in markets with suitable demographics can raise total sales while maintaining operational throughput, provided new locations achieve acceptable sales density and inventory efficiency.
  • Category depth within discretionary value: Growth can come from expanding high-performing categories (games, seasonal gifting, arts/crafts, tech accessories) and improving assortment “velocity” to keep shelves aligned with consumer preferences.
  • Gross margin resilience through sourcing and mix: Continued refinement of vendor strategy, merchandise architecture, and markdown management can support margin durability even when promotional intensity rises across retail.
  • Omnichannel evolution: A gradual expansion of online capabilities (where execution costs remain controlled) can provide incremental demand access and improve inventory visibility, without displacing the core in-store traffic engine.

⚠ Risk Factors to Monitor

  • Inventory and merchandising risk: Demand forecasting errors in fast-moving categories can lead to higher markdowns, margin compression, and working-capital strain.
  • Competitive intensity in value retail: Aggressive promotional strategies by dollar-store operators and off-price retailers can pressure traffic and force more discounting, impacting gross margin.
  • Execution risk in store growth: New store productivity can vary by site selection, local competition, and labor availability; underperformance can dilute consolidated earnings power.
  • Cost inflation: Wage inflation, freight/transport costs, and wage-related scheduling costs can pressure operating margins if not offset by merchandise sourcing efficiency.
  • Real estate and lease economics: Store expansion and lease renewals depend on favorable rent terms and durable traffic patterns in targeted trade areas.

📊 Valuation & Market View

Equity valuation for specialty and off-price retailers typically tracks earnings power and cash generation rather than a recurring revenue multiple. Markets often frame value through metrics such as EV/EBITDA and earnings yield, with sensitivity to (1) same-store sales durability, (2) gross margin and markdown trajectory, (3) operating leverage from store growth, and (4) inventory turnover and working-capital efficiency. The valuation “needle movers” are sustained margin resilience and credible store productivity, which determine whether incremental stores add to earnings power or become a drag through inventory mismatch and higher fixed costs.

🔍 Investment Takeaway

Five Below offers a structurally compelling off-price specialty model anchored by scale-enabled sourcing, a value-tier merchandising engine, and disciplined execution that can support resilient gross margins through cycle variation. The long-term thesis depends on the company’s ability to maintain inventory discipline, protect markdown performance, and expand store footprint with consistent sales productivity amid intensifying value retail competition.


⚠ AI-generated — informational only. Validate using filings before investing.

📰 Market News & Coverage

15 Stories Available

Real-time institutional reporting and market updates for FIVE.

zacks.com2026-07-30

Best Growth Stocks to Buy for July 30th

FIVE, CRDO and HPE made it to the Zacks Rank #1 (Strong Buy) growth stocks list on July 30, 2026.

zacks.com2026-07-29

Here is Why Growth Investors Should Buy Five Below (FIVE) Now

Five Below (FIVE) possesses solid growth attributes, which could help it handily outperform the market.

zacks.com2026-07-29

Consumer Confidence Drops: Why These 4 Retail Stocks Are Still a Buy

Five Below, Casey's, Maplebear and Target combine brand strength, value and omnichannel reach with solid growth prospects despite weaker consumer confidence.

zacks.com2026-07-29

Five Below vs. Macy's: Which Retail Stock Holds More Promise?

FIVE expands through new stores, value pricing and digital engagement, while M advances its turnaround with Reimagine stores, luxury banners and AI initiatives.

zacks.com2026-07-28

Here's Why Five Below (FIVE) is a Strong Momentum Stock

Wondering how to pick strong, market-beating stocks for your investment portfolio? Look no further than the Zacks Style Scores.

defenseworld.net2026-07-28

Arrowstreet Capital Limited Partnership Acquires 4,711 Shares of Five Below, Inc. $FIVE

Arrowstreet Capital Limited Partnership grew its holdings in shares of Five Below, Inc. (NASDAQ: FIVE) by 1.9% in the first quarter, according to the company in its most recent 13F filing with the Securities and Exchange Commission (SEC). The firm owned 258,218 shares of the specialty retailer's stock after acquiring an additional 4,711

zacks.com2026-07-27

Five Below's Product Innovation Efforts Strengthen Customer Appeal

FIVE wins shoppers with trend-driven products, exclusive launches and value pricing, helping fuel stronger sales and an upbeat fiscal 2026 outlook.

defenseworld.net2026-07-24

Five Below, Inc. $FIVE Shares Sold by Atika Capital Management LLC

Atika Capital Management LLC trimmed its position in shares of Five Below, Inc. (NASDAQ: FIVE) by 29.8% in the undefined quarter, according to its most recent disclosure with the SEC. The institutional investor owned 39,480 shares of the specialty retailer's stock after selling 16,720 shares during the quarter. Five Below makes up approximately

zacks.com2026-07-23

Here's Why Five Below (FIVE) is a Strong Growth Stock

Wondering how to pick strong, market-beating stocks for your investment portfolio? Look no further than the Zacks Style Scores.

zacks.com2026-07-23

Best Growth Stocks to Buy for July 23rd

BMA, FIVE, and DY it to the Zacks Rank #1 (Strong Buy) growth stocks list on July 23, 2026.

defenseworld.net2026-07-23

Five Below, Inc. $FIVE Shares Acquired by California Public Employees Retirement System

California Public Employees Retirement System increased its position in shares of Five Below, Inc. (NASDAQ: FIVE) by 10.0% during the undefined quarter, according to the company in its most recent 13F filing with the SEC. The firm owned 106,692 shares of the specialty retailer's stock after buying an additional 9,682 shares during the

247wallst.com2026-07-21

Here Are Tuesday’s Top Wall Street Analyst Research Calls: Adobe, Datadog, Five Below, Fortinet, Gilead Sciences, Goldman Sachs, Microsoft, Salesforce, and More

Wall Street analysts are making bold moves on Tuesday, shaking up ratings for some of the biggest names in tech, biotech, and retail in ways that could catch investors off guard. Find out which stocks got slashed and which ones earned surprise upgrades.

zacks.com2026-07-21

Best Growth Stocks to Buy for July 17th

BMA, FIVE, and DY it to the Zacks Rank #1 (Strong Buy) growth stocks list on July 17, 2026.

zacks.com2026-07-20

FIVE's Pricing Simplification Makes Shopping Easier & Drives Growth

Five Below simplifies pricing to make stores easier to shop and reinforce its value-focused merchandising.

zacks.com2026-07-17

5 Solid Stocks to Boost Your Portfolio as Retail Sales Continue to Surge

Retail sales rose in June as online spending surged, highlighting AMZN, FIVE, DLTR, TGT and TJX as retail stocks to watch.

📊 AI Financial Analysis

Powered by StockMarketInfo
Earnings Data: Q Ending 2026-05-02

"Headline (2026-05-02 / Q1): Revenue $1.29B and Net Income $123.1M (EPS $2.23, diluted $2.21). YoY growth vs 2025-05-03: Revenue +32.5%, Net Income +199.1%, with net margin improving to 9.6% from ~4.2%. QoQ vs 2026-01-31: Revenue declined -25.6% and Net Income fell -48.4%, but profitability remained elevated relative to the prior-year quarter. Profitability: Over the last four quarters, margins were cyclical—very weak in Q3/Q2 2025 (net margin ~3.5–4.2%), improving sharply by Q4 2025 (13.8%) and staying strong in Q1 2026 (9.6% despite the QoQ earnings drop). Operating margin followed a similar pattern (Q4 17.99% → Q1 12.00%), suggesting cost control/operating leverage helped even when revenue softened. Cash flow & balance sheet: Q1 2026 operating cash flow was $227.2M and free cash flow $190.0M (OCF margin ~17.7%). Cash increased slightly QoQ to $639M; leverage appears moderate with total assets $5.06B and equity $2.31B. No dividends paid and no buybacks reported in the quarter. Total shareholder returns: The stock closed at $236.26, up +276.7% YoY, indicating strong capital appreciation momentum that should outweigh the lack of yield. Valuation appears demanding versus recent historical profitability (P/E ~25.9)."

Revenue Growth

Good

YoY revenue growth of +32.5% (Q1’26 vs Q1’25) despite a QoQ decline of -25.6% (Q1’26 vs Q4’25), indicating strong underlying expansion but quarter-to-quarter volatility.

Profitability

Strong

Net income +199.1% YoY and net margin improved to 9.6% from ~4.2% in Q1’25. Operating margin remains elevated (12.0% in Q1’26 vs 5.2% in Q1’25), though QoQ net income fell -48.4%.

Cash Flow Quality

Positive

Q1’26 operating cash flow $227.2M and free cash flow $190.0M were solid and positive; however, the quarter’s cash generation softened QoQ versus Q4’25 OCF ($440.9M) consistent with earnings decline. No dividends/repurchases reported.

Leverage & Balance Sheet

Positive

Assets rose to $5.06B and equity to $2.31B (QoQ equity +5.5%). Net debt remains positive but appears manageable (net debt ~$1.36B) with a steady balance sheet profile.

Shareholder Returns

Excellent

Total return momentum is exceptionally strong: price is up +276.7% over 1 year. Dividend yield is 0% and buybacks were not reported, so returns are driven by capital appreciation.

Analyst Sentiment & Valuation

Positive

Consensus target ($234.56) is slightly below the current price ($236.26), with a wide range (Low $200 / High $285), implying uncertainty but still bullish longer-term upside.

Disclaimer:This analysis is AI-generated for informational purposes only. Accuracy is not guaranteed and this does not constitute financial advice.

Fundamentals Overview

Loading fundamentals overview...

Five Below delivered a very strong Q1 2026: sales nearly +33% to ~$1.3B with comps of ~23% (19% transaction growth, 4% ticket), producing adjusted EPS of $2.22 (+158%). Margin expanded sharply—gross rate +~340 bps, SG&A rate -~250 bps, and operating margin up ~600 bps—supported by fixed-cost leverage, distribution efficiencies, and lower shrink accrual. Management emphasized that the growth is not a single-product story: trend activation (notably Squishy Dumpling and social-first engagement) is embedded into an assortment “flywheel,” with positive comp breadth across departments and income cohorts. Guidance was raised for Q2 and full-year, but management remains cautious: Half 2 cycles ~15% comp growth and the consumer backdrop faces sticky inflation and higher fuel costs. Tariff benefit assumptions are time-bound through July 24 (10% global tariff) with no IEEPA tariff refund assumed.

AI IconGrowth Catalysts

  • 49 net new stores opened in Q1 (to 1,970 total stores); strong new store performance
  • 23% comparable sales growth driven by 19% transaction growth with 4% ticket growth (traffic-led comp)
  • Social-driven trend amplification, including Squishy Dumpling and RMS Squishy Dumpling as a “zero to hero” trend via social listening, reposting/engagement, and expanded squishy assortment
  • Sector strength: games and toys growth led by collectibles and squishy trends; Valentine/Easter seasonal demand
  • Operational improvements: better in-stock positions, streamlined pricing, simplified pricing structure, and store layout/testing post “Five Beyond product” line integration

Business Development

  • Exclusive collaboration with Winnie The Pooh licensed product (curated licensed merchandising)
  • Pokemon-related customer engagement: National Pokemon Day in-store activations and trading card demand evidenced by results
  • Creator/AI marketing execution through connected TV and social/digital channels (not a named customer, but a specific go-to-market capability deployment)
  • Ongoing discussions to increase trading-card allocation (explicitly: “further opportunities to chase Pokemon but other trading cards”; also anime collectible merchandising expansion)

AI IconFinancial Highlights

  • Net sales: nearly 33% to $1.3B; comp sales ~23%; 2-year stack comp ~30%
  • Adjusted EPS: $2.22, up 158% YoY (described as over 2.5x)
  • Adjusted gross profit: up 46% to $479M; gross profit rate of sale 37.2%, +~340 bps YoY
  • Adjusted SG&A: $324M or 25.2% rate of sale, down ~250 bps YoY
  • Adjusted operating margin: ~12%, up ~600 bps YoY (adjusted operating income +160% to $155M)
  • Inventory $813M (+~16%) with units +~10%; company cited tariff environment opportunistic buying and supply chain-flow preparation
  • Tax/tariff guidance sensitivity: tariff benefits from 10% global tariff rate flowed through to July 24; guidance excludes any impact from IEEPA tariff refunds
  • Q2 margin and cost puts: Q2 adjusted operating margin midpoint 7% vs 5.4% prior-year (implies +160 bps); effective tax rate ~25%; adjusted diluted EPS $1.23 vs $0.81 prior-year

AI IconCapital Funding

  • Cash position: approximately $1.1B cash, cash equivalents and investments at quarter end
  • No buyback/debt amounts disclosed in the provided transcript excerpt
  • Capital expenditures expected full year: $230M–$250M excluding tenant allowances (for ~150 net new stores plus technology/infrastructure investment)

AI IconStrategy & Ops

  • Operating model framed as “3 legs”: curated product storytelling, relevant social/digital marketing, and easier/funner in-store shopping with better in-stock positions and streamlined pricing
  • Testing and layout/design work after integrating Five Beyond product in line with merchandising “worlds”
  • Labor model designed to ensure in-stock positions; pricing simplification and improved store visuals to streamline shopping
  • Marketing automation/enhancement: progress building an email database to capture customer emails and enable more personalized outreach
  • “6 curtain-up moments” operating cadence for seasonal milestones (Valentine/Easter, plus other events including Pokemon milestones)

AI IconMarket Outlook

  • Half 2 comparable sales assumptions unchanged vs prior guidance
  • On tariffs: assumes 10% global tariff rate benefits through July 24, then revert to beginning-of-fiscal-year rates; no IEEPA tariff refund impact assumed
  • Q2 total sales raised to $1.18B–$1.2B (+16% at midpoint); comp sales 7%–9%
  • Q2 new store openings: ~50 (vs 32 prior year)
  • Full year sales guidance: $5.4B–$5.48B (+14% at midpoint); comp growth 6%–8% (nearly 20% at midpoint on a 2-year stack basis)
  • Full year adjusted operating margin guidance: 11.6% at midpoint (+170 bps); full year adjusted diluted EPS $8.85 at midpoint (55.7M shares; +33% vs 2025)

AI IconRisks & Headwinds

  • Macro/consumer caution: management highlighted rising fuel costs, sticky inflation, and a somewhat soft labor market; tax-proceeds tailwind in Q1 may not repeat
  • Potential comp cycling: back half includes higher anniversary hurdles (noted: Half 2 cycling 15% comp growth year-over-year)
  • Transitory cost headwind: fuel/diesel per gallon rising cost sized at ~20–25 bps for the year, offset via tariff cost flow-through and distribution center productivity/efficiencies
  • Marketing investment increases: intentional marketing spend up ~20–25 bps YoY in 2026 (management noted it is pullback-able if environment worsens)
  • Supply chain: “seamless flow” management amid more challenging global supply chain environment (inventory increased accordingly)

Q&A: Analyst Interest

  • Cost and margin bridge: Management quantified transitory fuel/diesel headwind sized at 20–25 bps for the year, but said it is fully offset via tariff cost flow-through and distribution-center productivity/efficiency. They also flagged an intentional 20–25 bps YoY marketing investment that is producing “terrific returns.”
  • Comp durability vs trend spikes: Management cautioned against attributing Q1 comp primarily to a single item/trend (e.g., Squishy Dumpling). They reframed outcomes through the flywheel model—social listening, amplification, and broader assortment effects—arguing that multiple “worlds” comp positively and traffic lift is not intended as a one-quarter-only catalyst.
  • Traffic vs ticket mechanics: Management explained that Squishy-driven marketing lifted traffic, but baskets were smaller than average, leading ticket growth to lag traffic. They tied the deceleration to basket size rather than demand collapse and expected marketing agility to continue driving footsteps across seasonal trends and into summer.

Sentiment: POSITIVE

Note: This summary was synthesized by AI from the FIVE Q1 2026 earnings transcript. Financial data is complex; please verify all metrics against official SEC filings before making investment decisions.

📋 Official Regulatory 10-K / 10-Q SEC Filings

Direct authenticated documentation links to audited SEC database reports for FIVE.

SEC EDGAR Live Feed
Loading financial data and tables...
📁

SEC Filings (FIVE)

© 2026 Stock Market Info — Five Below, Inc. (FIVE) Financial Profile