Funko, Inc.

Funko, Inc. (FNKO) Market Cap

Funko, Inc. has a market capitalization of $325.5M.

Price: $5.83

-0.22 (-3.64%)

Market Cap: 325.54M

NASDAQ · time unavailable

CEO: Josh Simon

Sector: Consumer Cyclical

Industry: Leisure

IPO Date: 2017-11-02

Website: https://www.funko.com

Funko, Inc. (FNKO) - Company Information

Market Cap: 325.54M|Sector: Consumer Cyclical

Company Profile

Funko, Inc. specializes in designing, sourcing, and marketing licensed consumer products rooted in popular culture, reaching customers throughout the United States, Europe, and other international markets. Their extensive product catalog comprises collectible figures (including vinyl, miniature blind-box, and action figures), fashion accessories like bags, backpacks, and wallets, and apparel such as t-shirts and hats. The offerings also span board games, plush items, small accessories like keychains, pens, and pins, and various home goods including drinkware. Furthermore, they delve into digital collectibles, such as non-fungible tokens (NFTs). These diverse items are sold under numerous well-known brand names, including Funko, Pop!, Loungefly, Mystery Minis, Paka Paka, Vinyl Gold, Funko Soda, Funko Games, Funko action figures, Funko Plush, Funko Gold, and Popsies. Funko secures licenses for intellectual properties spanning classic evergreen franchises, new film releases, contemporary television series, and current video games. Their products reach consumers via diverse channels, including specialty and mass-market retailers, online e-commerce platforms, and wholesale distributors. Direct-to-consumer sales occur through their own e-commerce website and at major pop culture events, such as specialized licensing shows, comic book conventions, and exhibitions. Established in 2017, Funko, Inc. maintains its corporate headquarters in Everett, Washington.

Analyst Sentiment

67%
Buy

From 2 Active Polls

1Y Forecast: $6.25

▲ +7.2% Potential Upside

Consensus Target Metrics

Low Bound

$6

Median

$6

High Bound

$7

Average

$6

Price & Moving Averages

Loading chart...

🎯 Wall Street Analyst Intelligence Report

1-Year structural target targets, chart projections, and sentiment maps.

Average 1Y Target
$6.25
▲ +7.20% Upside
Low Target
$6.00
3% Risk
Median Target
$6.25
7% Mid
High Target
$6.50
11% Max
Consensus
Hold
6 / 14 Buys

Consensus Trend Projection

Trailing closures vs. 12-month metrics map.

Analyst Vote Distribution

Aggregate institutional coverage sentiment weights.

📊 Historical Valuation Multiples

Real-time Trailing Twelve Month (TTM) momentum side-by-side with discrete quarterly metrics.

Fiscal QuarterTTMQ1 2026Q4 2025Q3 2025Q2 2025Q1 2025Q4 2024Q3 2024Q2 2024
Period EndingTrailing 12MMar 31, 2026Dec 31, 2025Sep 30, 2025Jun 30, 2025Mar 31, 2025Dec 31, 2024Sep 30, 2024Jun 30, 2024
Market Cap ($M)326175185188259367697642484
Enterprise Value ($M)571420436461541618923917747
Price to Earnings Ratio (P/E)-5.52-2.39-250.0052.12-1.61-3.30-117.8737.0823.63
Price/Earnings-to-Growth Ratio (PEG)-28.271.76-1.12-357.972.041.59
Price to Sales Ratio (P/S)0.350.870.680.751.341.932.372.191.95
Price to Book Ratio (P/B)1.911.031.001.031.431.732.992.712.16
Price to Free Cash Flow Ratio (P/FCF)-44.4189.999.6455.57-8.13-12.7414.58-153.2513.15
Enterprise Value to Sales (EV/Sales)2.091.591.842.803.243.143.133.02
Enterprise Value to EBITDA (EV/EBITDA)21.0389.5920.5120.66-25.62-76.2738.9433.4429.80
Debt to Equity Ratio9.031.651.581.711.831.301.121.291.37

📘 Full Research Report

ℹ️

AI-Generated Research: This report is for informational purposes only.

📘 FUNKO INC CLASS A (FNKO) — Investment Overview

🧩 Business Model Overview

Funko designs and markets licensed “pop culture” collectible products—most notably vinyl figures, specialty collectibles, and related merchandise—then sells them through a mix of wholesale distribution (to specialty retailers and mass-market channels) and direct-to-consumer (primarily e-commerce).

The value chain is centered on (1) securing and maintaining licenses to media and entertainment IP, (2) translating that IP into mass-collectible product formats with repeatable design rules, and (3) scaling distribution so retailers and consumers can source product efficiently throughout the product life cycle (launches, waves, and seasonal cycles).

Customer stickiness comes less from “subscription-style” lock-in and more from the breadth of the catalog, the cadence of new IP releases, and the expectation among collectors that Funko will release new characters and variants tied to mainstream franchises.

💰 Revenue Streams & Monetisation Model

Revenue is largely transactional, driven by product launches tied to licensed IP and ongoing replenishment of catalog items. Monetisation is supported by a layered SKU strategy (core figures plus variants and specialty lines), which can expand the opportunity per franchise and season.

Margin drivers are typically a function of:

  • Gross margin resilience: product mix, manufacturing cost efficiency, and the ability to manage discounting when sell-through varies.
  • Operating leverage: overhead absorption as unit volumes rise, and packaging/fulfillment efficiency in e-commerce channels.
  • Channel mix: wholesale generates scale and predictable throughput, while direct-to-consumer can improve profitability per unit but carries marketing and fulfillment costs.

Although there is no meaningful subscription revenue, the business can still exhibit a “quasi-recurring” pattern through repeat franchise monetisation (new waves, re-releases, and spin-offs) within the licensed ecosystem.

🧠 Competitive Advantages & Market Positioning

Funko’s moat is primarily based on intangible asset depth (licensed IP relationships) and distribution/scale execution, supported by an established product platform that reduces design and manufacturing friction across many franchises.

Licensing and IP track record (Intangible Asset Moat): Many competitors can make toys; fewer can consistently secure and execute a large portfolio of mainstream entertainment licenses into a standardized collectible format at scale. License renewals, expansion packs, and new-character releases create an ongoing pipeline that is difficult to replicate without comparable relationships and demonstrated retail sell-through.

Scale and distribution leverage (Cost/Execution Moat): Funko’s scale supports better unit economics in sourcing and packaging and enables retailers to treat Funko as a standing collectible destination. That lowers retailer procurement complexity versus constantly introducing entirely new, unaffiliated product categories.

Collector ecosystem (Weak network effect / catalog reinforcement): Collectors and retailers tend to anticipate continued franchise coverage (e.g., sequels, anniversaries, spinoffs). Competitors with narrower franchise coverage can find it harder to meet that breadth expectation.

Competitive benchmarking (2–3 primary competitors):

  • Hasbro — broader play/toy portfolio with franchise licensing across games and entertainment properties; competition comes from shelf share allocation and licensed product variety rather than a single standardized collectible format.
  • Mattel — strong in global toy brands and licensed lines; competes for mass and specialty distribution capacity but typically offers fewer “collectible-per-franchise” wave opportunities than Funko’s format-led approach.
  • Spin Master — diversified kids’ products and entertainment IP; emphasizes play patterns and seasonal momentum, which can shift retailer attention away from collectibles.

Contrast: Funko’s focus is narrower and more concentrated on collectible figures and specialty merchandise tied to pop-culture IP, executed through an identifiable product platform. The rivals above generally compete with wider categories and different product physics (play vs. display), creating a different value proposition for retailers and consumers.

🚀 Multi-Year Growth Drivers

  • IP monetisation tailwinds: Continued global production of films, series, gaming franchises, and live entertainment expands the pool of licensable characters and themes—fuel for collectible “waves.”
  • Catalog depth and franchise expansion: Many licenses can support multiple product generations (core releases, variant skins, specialty lines), improving the addressable revenue per franchise without requiring entirely new licensing ecosystems.
  • International retail penetration: Growth opportunity exists through deeper distribution in additional geographies and improving localized fulfillment to support collectors.
  • Channel and format mix optimization: Expanding higher-margin specialty SKUs and selectively increasing direct-to-consumer assortment can improve profitability, provided inventory risk is managed.
  • Evolving consumer behavior toward collectibles: Display-oriented collectibles benefit from trends in fandom and the desire for tangible representations of media identities.

⚠ Risk Factors to Monitor

  • License concentration and renewal risk: Revenue can depend on a subset of high-visibility IP. License economics can change with renewals, and new characters may not always translate into stable demand.
  • Inventory and assortment risk: Collectibles are demand- and trend-sensitive. Over-ordering or slower sell-through can lead to discounting and margin compression.
  • Retail cycle and shelf-space allocation: Wholesale volumes can be pressured when retailers tighten inventories or reallocate shelf space to other categories.
  • Manufacturing and cost inflation: Input cost changes and freight volatility can affect gross margin if not offset by pricing, mix, or sourcing improvements.
  • Counterfeits and unauthorized products: Unauthorized goods can dilute the perceived value of licensed collectibles and create pricing pressure.

📊 Valuation & Market View

Markets typically value consumer durable/brand-led product companies using a blend of EV/EBITDA, EV/Sales (or P/S), and equity multiples that reflect operating leverage potential. The key valuation drivers are usually:

  • Gross margin stability through product mix and disciplined discounting.
  • Inventory turns and working-capital efficiency (trend sensitivity management).
  • Operating leverage as overhead scales with units and as channel mix evolves.
  • Credible licensing pipeline that supports sustainable franchise wave cadence.

In this context, deterioration in sell-through discipline or licensing-driven growth visibility can compress multiples, while improved mix, reduced markdown intensity, and a steadier inventory profile can support rerating.

🔍 Investment Takeaway

Funko’s long-term case rests on licensed IP intangible assets and a scalable collectible product platform that converts pop-culture demand into repeat franchise waves. The business can compound when it maintains licensing momentum, achieves disciplined inventory management, and sustains operating leverage through mix and channel optimization. The principal risks are trend- and license concentration, plus working-capital pressure from demand variability—factors that investors should evaluate alongside the company’s ability to consistently execute within its licensing pipeline.


⚠ AI-generated — informational only. Validate using filings before investing.

📰 Market News & Coverage

15 Stories Available

Real-time institutional reporting and market updates for FNKO.

businesswire.com2026-07-31

Funko Announces Inducement Grants Under Nasdaq Listing Rule 5635(c)(4)

EVERETT, Wash.--(BUSINESS WIRE)--Funko, Inc. (Nasdaq: FNKO), a leading pop culture lifestyle brand, today announced that, on July 28, 2026, the Compensation Committee of the Board of Directors (Compensation Committee) of Funko granted inducement awards consisting of restricted stock units (RSUs) underlying 29,483 shares of Funko's Class A common stock to three (3) new employees under the Funko, Inc. 2024 Inducement Award Plan (Inducement Plan). The Compensation Committee approved the awards as a.

businesswire.com2026-07-22

Funko to Announce 2026 Second Quarter Financial Results and Host Video Webcast on Thursday, August 6, 2026

EVERETT, Wash.--(BUSINESS WIRE)--Funko, Inc. (Nasdaq: FNKO), a leading pop culture lifestyle brand, today announced that it will issue its financial results for the second quarter ended June 30, 2026, and host a video webcast on Thursday, August 6, 2026, at 4:30 p.m. ET.Ahead of the webcast, Funko stockholders may submit questions to be considered for inclusion during the Q&A portion of the presentation. Questions can be submitted via email to [email protected] webcast can be a.

forbes.com2026-07-17

Funko Expands ‘KPop Demon Hunters' Pops! Line With Demon Saja Boys And SDCC Experience

The KPop Demon Hunters Funko Pops! line will soon expand to include the demon versions of the Saja Boys as the company plans to launch its Pop!

forbes.com2026-07-11

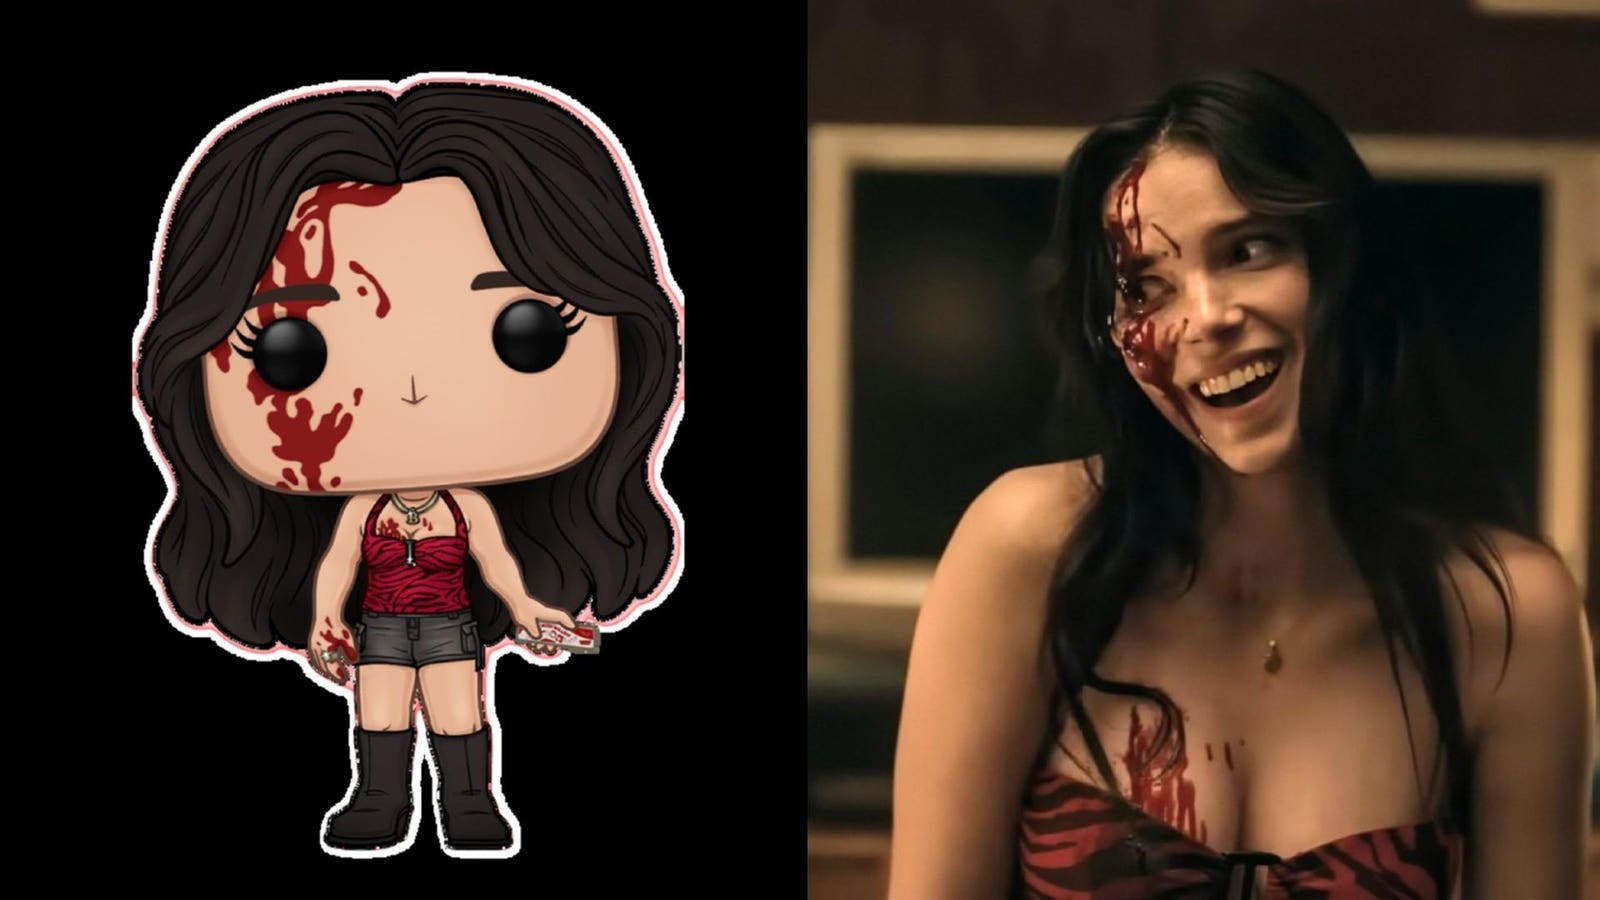
Funko Is Making An ‘Obsession' Pop! Figure Of Nikki

Collectibles company Funko is producing a freaky Pop! figure of Inde Navarrette's spellbinding character, Nikki, from Curry Barker's horror movie blockbuster Obsession.

forbes.com2026-06-24

‘Heated Rivalry' Funko Pops! Revealed And Go On Pre-Sale

Exclusive: Heated Rivalry Funko Pops! figures of Connor Storrie's Ilya Rozanov and Hudson Williams' Shane Hollander are on the way from the pop culture collectibles company.

seekingalpha.com2026-06-15

Funko's Surge Shows Management's Not Playing Around

Funko has rebounded strongly, with shares up 52% since March and profitability metrics improving, justifying a continued ‘strong buy' rating. Core Collectible revenue surged, driven by renewed demand for Pop! Products and successful launches like KPop Demon Hunters and Pop! Yourself. Management guides for flat to 3% revenue growth in 2026 but expects EBITDA to rise from $26.6M to $70–80M, supporting a compelling valuation.

seekingalpha.com2026-05-07

Funko, Inc. (FNKO) Q1 2026 Earnings Call Transcript

Funko, Inc. (FNKO) Q1 2026 Earnings Call Transcript

businesswire.com2026-05-07

Funko Reports Strong First Quarter 2026 Financial Results; Reiterates 2026 Full-Year Outlook

EVERETT, Wash.--(BUSINESS WIRE)--Funko, Inc. (Nasdaq: FNKO), a leading pop culture lifestyle brand, today reported its consolidated financial results for the first quarter ended March 31, 2026. First Quarter Financial Results Summary: 2026 vs 2025 Net sales were $200.9 million compared with $190.7 million Gross profit was $88.8 million, equal to gross margin of 44.2%, compared with $76.9 million, equal to gross margin of 40.3% SG&A expenses were $83.7 million compared with $84.8 million Net.

businesswire.com2026-05-01

Funko Announces Inducement Grants Under Nasdaq Listing Rule 5635(c)(4)

EVERETT, Wash.--(BUSINESS WIRE)--Funko, Inc. (Nasdaq: FNKO), a leading pop culture lifestyle brand, today announced that, on April 29, 2026, the Compensation Committee of the Board of Directors (Compensation Committee) of Funko granted inducement awards consisting of restricted stock units (RSUs) underlying 109,723 shares of Funko's Class A common stock to nine (9) new employees under the Funko, Inc. 2024 Inducement Award Plan (Inducement Plan). The Compensation Committee approved the awards as.

businesswire.com2026-04-28

Nik Rupp Joins Funko as Senior Vice President of Brand and Marketing

EVERETT, Wash.--(BUSINESS WIRE)--Funko, Inc. (Nasdaq: FNKO), a leading pop culture lifestyle brand, today announced the appointment of Nik Rupp as Senior Vice President of Brand and Marketing. In this role, Rupp will lead global marketing strategy, brand storytelling, and events. Funko CEO Josh Simon said: “Nik has spent his career at the intersection of products, culture and fandom and he brings enormous expertise connecting with fans across both physical and digital experiences. His ability t.

businesswire.com2026-04-22

Funko To Announce 2026 First Quarter Financial Results and Host Video Webcast On Thursday, May 7, 2026

EVERETT, Wash.--(BUSINESS WIRE)--Funko, Inc. (Nasdaq: FNKO), a leading pop culture lifestyle brand, today announced that it will issue its financial results for the first quarter ended March 31, 2026 and host a video webcast on Thursday, May 7, 2026, at 4:30 p.m. ET. Ahead of the webcast, Funko stockholders may submit questions to be considered for inclusion during the Q&A portion of the presentation. Questions can be submitted via email to [email protected]. The webcast can be ac.

defenseworld.net2026-03-27

Critical Review: Hengan International Group (OTCMKTS:HEGIY) versus Funko (NASDAQ:FNKO)

Funko (NASDAQ: FNKO - Get Free Report) and Hengan International Group (OTCMKTS:HEGIY - Get Free Report) are both consumer discretionary companies, but which is the superior investment? We will compare the two companies based on the strength of their valuation, profitability, dividends, analyst recommendations, earnings, institutional ownership and risk. Volatility and Risk Funko has a beta

seekingalpha.com2026-03-21

Funko: The Storm Has Passed

Funko remains a 'strong buy' despite a 21.6% post-earnings selloff and recent underperformance versus the S&P 500. Management forecasts flat to 3% revenue growth in 2026, with core collectibles expected to grow high single digits and EBITDA projected at $70–80 million. Net debt has fallen to $183.2 million, inventories are down, and near-term 'going concern' risk has been alleviated through credit agreement extension.

defenseworld.net2026-03-16

Head to Head Contrast: Funko (NASDAQ:FNKO) & Creative Global Technology (NASDAQ:CGTL)

Creative Global Technology (NASDAQ: CGTL - Get Free Report) and Funko (NASDAQ: FNKO - Get Free Report) are both small-cap consumer discretionary companies, but which is the superior investment? We will compare the two businesses based on the strength of their analyst recommendations, risk, institutional ownership, profitability, earnings, dividends and valuation. Profitability This table compares Creative Global

seekingalpha.com2026-03-12

Funko, Inc. (FNKO) Q4 2025 Earnings Call Transcript

Funko, Inc. (FNKO) Q4 2025 Earnings Call Transcript

📊 AI Financial Analysis

Powered by StockMarketInfo
Earnings Data: Q Ending 2026-03-31

"FNKO reported Q1’26 revenue of $200.9M and a net loss of $18.1M (EPS: -$0.33). QoQ, revenue declined from $273.1M (Q4’25) to $200.9M (-26.5%), and net income worsened from roughly breakeven loss (-$0.2M) to -$18.1M. YoY, revenue increased from $190.7M (Q1’25) to $200.9M (+5.3%), while net income deteriorated sharply from a -$27.6M loss to -$18.1M (an improvement of ~34.5% in the loss magnitude, but still negative). Profitability remains fragile. Net margin was -9.0% in Q1’26 versus -0.1% in Q4’25 and -14.5% in Q1’25, indicating margins have improved versus last year but contracted materially sequentially. Gross margin data is not provided for Q1’26 (grossProfitRatio=0), but operating income was -$9.6M (operating margin -4.8%). Cash flow quality was only modestly positive: operating cash flow was +$10.2M and free cash flow was +$1.9M, despite a net loss. Balance sheet leverage appears elevated: total assets were $625.9M with total stockholders’ equity of $169.1M, while net debt was about $243.5M (up slightly vs Q4’25). Shareholder returns are mixed on the data provided: price is $4.37 with +8.7% 1Y momentum (not >20%), and the company pays no dividend in the dataset; buybacks are shown as zero in Q1’26."

Revenue Growth

Neutral

YoY revenue grew +5.3% ($190.7M to $200.9M) but QoQ revenue fell -26.5% ($273.1M to $200.9M), suggesting volatility.

Profitability

Caution

Net margin was -9.0% in Q1’26 vs -0.1% in Q4’25 and -14.5% in Q1’25; operating income turned negative (-$9.6M) sequentially.

Cash Flow Quality

Fair

Despite a net loss (-$18.1M), operating cash flow was +$10.2M and free cash flow was +$1.9M, indicating partial cash support but limited earnings-to-cash conversion.

Leverage & Balance Sheet

Caution

Total assets were $625.9M with equity of $169.1M; net debt rose to ~$243.5M. Leverage remains a headwind, though liquidity (cash ~$34.3M) is not collapsing.

Shareholder Returns

Fair

No dividends and no repurchases in Q1’26 (per data). Price momentum is +8.7% over 1Y, which helps but is below the >20% threshold.

Analyst Sentiment & Valuation

Fair

Consensus price target is $6.50 vs current ~$4.37 (notable upside). However, profitability deterioration sequentially tempers confidence.

Disclaimer:This analysis is AI-generated for informational purposes only. Accuracy is not guaranteed and this does not constitute financial advice.

Fundamentals Overview

Loading fundamentals overview...

FNKO started 2026 strongly, reporting Q1 sales up 5% overall and Core Collectibles up 17%, alongside its highest-ever 44% gross margin and $11m adjusted EBITDA above expectations. Management tied the profitability to real levers: less discounting, renewed licensing agreements, and favorable mix—while expecting gross margin to remain 42%–44% through the year. Demand signals strengthened, with global POS up 6% and wholesale POS up 12%, including Europe POS up 28%, supporting confidence that Q4 momentum is carrying into Q2. Guidance calls for Q2 sales up low single digits to mid-single digits and adjusted EBITDA of $5m–$10m, while reiterating full-year sales flat to up 3% and adjusted EBITDA $70m–$80m. Upside may come from lower-than-planned tariff rates and potential IEEPA refund monetization (about $20m paid), though refund timing remains uncertain. Loungefly executes a 50% SKU reduction to improve productivity despite a planned sales dip.

AI IconGrowth Catalysts

  • Core Collectibles sales up 17% in Q1; overall sales up 5% (momentum carried from Q4 into 2026)
  • Core IP/product momentum: KPop Demon Hunters, Stranger Things (final season), One Piece, Star Wars growth, and Mando/Grogu launches
  • Bitty Pop! strength extending from Q4 roll-out into Walmart, including seasonal “Bitty Bouquet” customization concept for Valentine’s
  • D2C and creator-speed execution: Pop! Yourself and limited edition WWE covers tied to WrestleMania; fast turn-in-moment launches

Business Development

  • WWE Fan Expo (WrestleMania 42): Pop! Yourself experience with exclusive WWE gear; limited edition WWE covers launched on D2C and Fanatics
  • Inter Miami Stadium: new shop-in-shop opened at the stadium; exclusive Messi Pop! available only at the stadium
  • Disney licensing relationships referenced for IP pipeline and international expansion (e.g., Zootopia noted; long-standing Disney relationship)
  • Loungefly key retailer relationships: BoxLunch and Hot Topic
  • Loungefly premium: first Swarovski collection launched; Disney parks placement highlighted

AI IconFinancial Highlights

  • Sales: up 5% overall in Q1; Core Collectibles up 17%
  • Gross margin: highest gross margin ever at 44% (no accounting adjustment mentioned)
  • Adjusted EBITDA: $11 million in Q1, described as significantly above expectations
  • Wholesale/territory POS: global POS up 6% in Q1; wholesale channel POS up 12%; U.S. POS up 6% and Europe POS up 28%
  • Gross margin guidance: 42% to 44% for remainder of year; management expects trend to hold
  • Tariffs/refunds: approximately $20 million paid in IEEPA tariffs; exploring options to monetize tariff claims; timing uncertain

AI IconCapital Funding

    AI IconStrategy & Ops

    • Loungefly business reset: cut SKUs by 50% in 2026 to improve SKU productivity and profitability; management expects planned sales decline this year
    • Loungefly product direction: expand beyond iconic mini backpack into more wearable storytelling; emphasize accessories (bag charms, pins) showing double-digit growth
    • Distribution/retail experimentation: Pop! Yourself kiosk concept expansion with partners; testing retail partner rollout later in 2026 (not yet named)
    • Speed-to-market: new creator and in-moment execution (IShowSpeed Pop! dropped on-site and on Fanatics.com and the site during WrestleMania)

    AI IconMarket Outlook

    • Q2 guidance issued: sales expected up low single digits to mid-single digits; adjusted EBITDA between $5 million and $10 million
    • Full-year outlook reiterated: sales flat to up 3%; adjusted EBITDA between $70 million and $80 million
    • Second-half macro item: tariff rates currently in effect are lower than planned; management hopes this continues
    • International demand monitoring: POS trend described as healthy alignment of sell-in vs sell-through

    AI IconRisks & Headwinds

    • Loungefly 2026 SKU reduction implies planned sales decline in the segment, despite improved profitability goals
    • Tariff refund timing uncertainty: management paid ~$20 million in IEEPA tariffs; refund/monetization timing not clear
    • Oil price exposure monitored: management stated no negative impact yet but it is still early and being watched

    Q&A: Analyst Interest

    • POS trend durability: Management said Q4 POS improvements continued into Q1, with global POS up 6% and wholesale POS up 12%. By territory, U.S. POS rose 6% and Europe rose 28%. They emphasized this aligns with sell-in/sell-through health.
    • Gross margin drivers (Q1/Q2): Management attributed the record 44% gross margin to operational drivers rather than accounting changes: reduced discounting/promotional activity, renewed licensing agreements with major partners, and channel/sales mix. They guided 42%–44% gross margin for the rest of the year.
    • Tariff and refund upside: Management stated Funko paid approximately $20 million in IEEPA tariffs and is taking steps to obtain refunds. They said timing is uncertain and that there is a market to monetize tariff claims; they are exploring options, with more to come.

    Sentiment: POSITIVE

    Note: This summary was synthesized by AI from the FNKO Q1 2026 earnings transcript. Financial data is complex; please verify all metrics against official SEC filings before making investment decisions.

    📋 Official Regulatory 10-K / 10-Q SEC Filings

    Direct authenticated documentation links to audited SEC database reports for FNKO.

    SEC EDGAR Live Feed
    Loading financial data and tables...
    📁

    SEC Filings (FNKO)

    © 2026 Stock Market Info — Funko, Inc. (FNKO) Financial Profile