Gladstone Commercial Corporation

Gladstone Commercial Corporation (GOOD) Market Cap

Gladstone Commercial Corporation has a market capitalization of $605.1M.

Price: $12.50

β–Ό -0.02 (-0.16%)

Market Cap: 605.09M

NASDAQ Β· time unavailable

CEO: Arthur S. Cooper

Sector: Real Estate

Industry: REIT - Diversified

IPO Date: 2003-08-14

Website: https://www.gladstonecommercial.com

Gladstone Commercial Corporation (GOOD) - Company Information

Market Cap: 605.09M|Sector: Real Estate

Company Profile

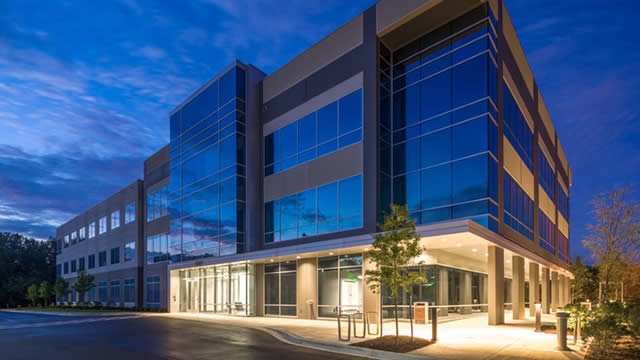
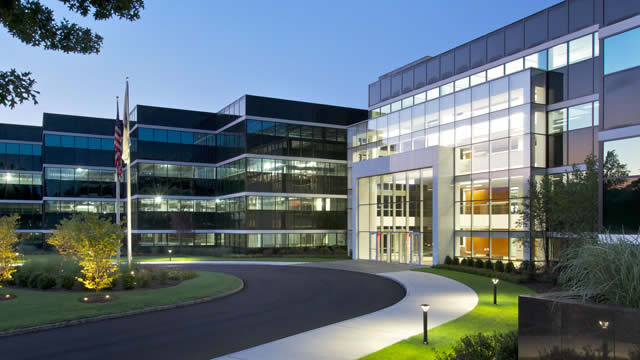
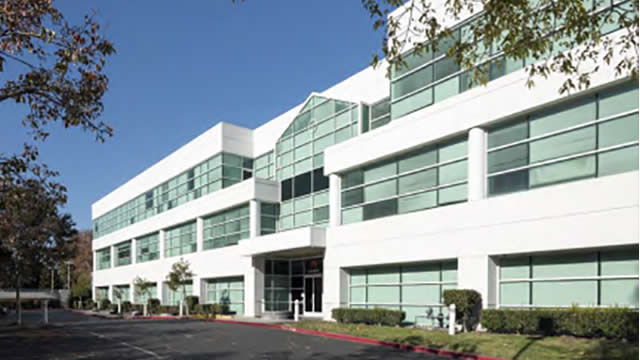
Gladstone Commercial Corporation functions as a real estate investment trust (REIT), primarily focused on acquiring, holding, and managing industrial and office properties under net leases across the United States. The company demonstrates a strong history of investor payouts, having delivered 189 continuous monthly cash dividends to its common stockholders up to September 2020. This followed an initial period where five consecutive quarterly cash distributions were made. Additionally, preferred stockholders have experienced uninterrupted payments: 53 consecutive monthly distributions for its Series D Preferred Stock, 12 for its Series E, and 3 for its Series F. Since its inception in 2003, Gladstone Commercial has consistently met its distribution commitments, never missing, decreasing, or delaying a payment.

Analyst Sentiment

79%
Strong Buy

From 4 Active Polls

1Y Forecast: $14.00

β–² +12.0% Potential Upside

Consensus Target Metrics

Low Bound

$13

Median

$14

High Bound

$15

Average

$14

Price & Moving Averages

Loading chart...

🎯 Wall Street Analyst Intelligence Report

1-Year structural target targets, chart projections, and sentiment maps.

Average 1Y Target
$14.00
β–² +12.00% Upside
Low Target
$13.00
4% Risk
Median Target
$14.00
12% Mid
High Target
$15.00
20% Max
Consensus
Buy
9 / 14 Buys

Consensus Trend Projection

Trailing closures vs. 12-month metrics map.

Analyst Vote Distribution

Aggregate institutional coverage sentiment weights.

πŸ“Š Historical Valuation Multiples

Real-time Trailing Twelve Month (TTM) momentum side-by-side with discrete quarterly metrics.

Fiscal QuarterTTMQ1 2026Q4 2025Q3 2025Q2 2025Q1 2025Q4 2024Q3 2024Q2 2024
Period EndingTrailing 12MMar 31, 2026Dec 31, 2025Sep 30, 2025Jun 30, 2025Mar 31, 2025Dec 31, 2024Sep 30, 2024Jun 30, 2024
Market Cap ($M)605540504582662668701695568
Enterprise Value ($M)1,4401,3751,3491,4131,4521,4061,3881,3811,285
Price to Earnings Ratio (P/E)27.6435.728.34148.08113.7393.6323.8820.30-88.13
Price/Earnings-to-Growth Ratio (PEG)β€”β€”1.3044.7520.99277.72β€”3.45-23.56
Price to Sales Ratio (P/S)3.6512.8811.5914.2416.7517.8218.7717.7115.34
Price to Book Ratio (P/B)3.613.301.473.153.743.654.104.113.90
Price to Free Cash Flow Ratio (P/FCF)6.8031.1215.2167.0622.1640.5930.78125.4454.33
Enterprise Value to Sales (EV/Sales)β€”32.8131.0534.6136.7337.4837.1335.2034.67
Enterprise Value to EBITDA (EV/EBITDA)22.5241.37-47.6046.9250.1551.0747.1440.1947.44
Debt to Equity Ratio13.065.162.514.604.524.084.074.124.99

πŸ“˜ Full Research Report

ℹ️

AI-Generated Research: This report is for informational purposes only.

πŸ“˜ GLADSTONE COMMERCIAL REIT CORP (GOOD) β€” Investment Overview

🧩 Business Model Overview

GLADSTONE COMMERCIAL REIT CORP (GOOD) operates as a real estate investment trust focused on owning and managing income-producing commercial properties financed through a blend of equity and debt. The investment model emphasizes long-duration, tenant-occupied assets where tenant obligations are structured to pass through a meaningful portion of operating costs (commonly through net-lease characteristics). Revenue generation is therefore driven by contracted rent streams rather than property-by-property redevelopment cycles.

The value chain is straightforward: (1) source and underwrite properties with durable income characteristics, (2) negotiate lease terms that support stable cash flow and credit quality, and (3) manage the portfolio to maintain occupancy, lease performance, and capital efficiency across the cycle.

πŸ’° Revenue Streams & Monetisation Model

The monetisation model is primarily recurring: base rent from tenant leases, typically with contractual rent escalations or periodic rent adjustments that can help offset inflation over time. Where leases include reimbursement of property-level expenses (taxes, insurance, and maintenance), operating cash flow becomes more resilient because a larger share of cost risk shifts toward tenants.

Margin drivers in this model are less about operating leverage and more about: (a) lease duration and escalation terms, (b) tenant credit quality and rent coverage, and (c) capital structure discipline, since net lease cash flows translate into earnings power only if interest expense and refinancing risk remain controlled.

🧠 Competitive Advantages & Market Positioning

GOOD’s core moat is underwriting- and credit-driven rather than β€œasset uniqueness.” The strength lies in building a portfolio of tenant-occupied commercial properties with lease structures that support cash-flow stability. In practice, this moat is composed of:

  • Credit culture (Financial moat): disciplined tenant selection and lease structuring to reduce probability of rent disruptions.
  • Tenant stickiness (Switching costs proxy): lease commitments and location-specific operational setups increase tenant reluctance to relocate without material cost or disruption.
  • Portfolio management expertise (Execution moat): property sourcing, diligence, and ongoing leasing/asset oversight that aims to preserve occupancy and cash flow through varying economic conditions.

Competitive benchmarking (net-lease and income-oriented REIT peers):

  • Realty Income (O): Broad diversification across tenant types and geographies with a large-scale platform; competes for similar β€œnet income with contractual rent” profiles but often at different risk/return points due to scale.
  • National Retail Properties (NNN): Similar net-lease orientation with retail-focused exposures; differs in underlying tenant sector dynamics and lease structures tied to retail demand cycles.
  • STAG Industrial (STAG): Industrial-focused income strategy; competes for industrial tenant cash flows, but sector-specific supply/demand and lease maturity profiles can differ from GOOD’s commercial mix.

GOOD’s positioning centers on selecting commercial properties and lease terms intended to balance income durability with credit risk, contrasting with peers that may emphasize scale (Realty Income), sector concentration (NNN), or a narrower industrial thesis (STAG).

πŸš€ Multi-Year Growth Drivers

Over a 5–10 year horizon, growth prospects typically depend on the ability to compound cash flows and redeploy capital into attractive risk-adjusted acquisitions. Key drivers include:

  • Steady demand for occupied commercial space: Tenant preferences for existing, well-located facilities can support occupancy stability, especially when leases are structured with tenant obligations to sustain property economics.
  • Inflation-linked rent characteristics: Contractual rent escalations or reimbursement mechanisms can provide incremental cash-flow growth and help protect purchasing power.
  • Capital recycling and portfolio optimization: A disciplined acquisition pipeline and active management of lease expirations can reduce earnings volatility and sustain long-term compounding.
  • Balance-sheet and financing flexibility: Access to equity and debt markets (and a measured approach to leverage) can allow continued acquisition activity through market cycles.

⚠ Risk Factors to Monitor

  • Tenant credit risk: Even with net-lease structures, weakened tenant fundamentals can translate into lease renegotiations, downtime, or occupancy loss.
  • Refinancing and interest-rate sensitivity: Capital structure choices can amplify earnings volatility if debt maturities require refinancing under less favorable credit conditions.
  • Lease rollover concentration: Clustering of expirations or renewals can create periods of higher re-leasing risk and reduced cash-flow visibility.
  • Property-level operational shocks: While net-lease terms shift many costs to tenants, tax/insurance exposure and certain maintenance or capex requirements can still pressure cash flows.
  • Acquisition discipline in competitive environments: In periods of strong demand for income assets, cap-rate compression risk can lead to lower future returns if underwriting standards loosen.

πŸ“Š Valuation & Market View

Income-oriented REITs are typically valued through asset-income frameworks rather than pure growth multiples. Market participants often focus on: (1) cash-flow yield metrics tied to funds from operations and distributions, (2) implied cap rates and spread versus financing costs, and (3) balance-sheet durability, including leverage and refinancing runway. Key valuation-moving factors usually include portfolio occupancy, rent escalations, tenant credit performance, and changes in debt markets that affect interest expense and refinancing availability.

πŸ” Investment Takeaway

GOOD offers a compounding opportunity anchored in stable, contracted rental cash flows and a portfolio built around tenant credit selection and lease structuring. The durable advantage is less about proprietary technology and more about execution: disciplined underwriting, lease characteristics that support cash-flow resilience, and balance-sheet management that aims to preserve income through market cycles. The investment case remains most compelling when tenant credit quality holds, lease maturities remain manageable, and financing conditions do not undermine distribution sustainability.


⚠ AI-generated β€” informational only. Validate using filings before investing.
πŸ“° Market News & Coverage

15 Stories Available

Real-time institutional reporting and market updates for GOOD.

zacks.comβ€’2026-07-30

Gladstone Commercial (GOOD) Stock Declines While Market Improves: Some Information for Investors

Gladstone Commercial (GOOD) reached $12.52 at the closing of the latest trading day, reflecting a -2.64% change compared to its last close.

zacks.comβ€’2026-07-30

Here is What to Know Beyond Why Gladstone Commercial Corporation (GOOD) is a Trending Stock

Gladstone Commercial (GOOD) has received quite a bit of attention from Zacks.com users lately. Therefore, it is wise to be aware of the facts that can impact the stock's prospects.

zacks.comβ€’2026-07-23

Gladstone Commercial (GOOD) Suffers a Larger Drop Than the General Market: Key Insights

In the closing of the recent trading day, Gladstone Commercial (GOOD) stood at $12.78, denoting a -1.69% move from the preceding trading day.

accessnewswire.comβ€’2026-07-23

Gladstone Commercial Provides Summary of Mid-Year Business Developments

MCLEAN, VA / ACCESS Newswire / July 23, 2026 / Gladstone Commercial Corporation (Nasdaq:GOOD) ("Gladstone Commercial") is pleased to report another successful six months (for the period ended June 30, 2026) of investing, leasing, and disposition activity in the net lease space. We continue to create shareholder value by increasing our industrial exposure and disposing of non-core office assets.

defenseworld.netβ€’2026-07-23

Gladstone Commercial (NASDAQ:GOOD) Share Price Passes Above 200-Day Moving Average – Time to Sell?

Gladstone Commercial Corporation (NASDAQ: GOOD - Get Free Report) crossed above its two hundred day moving average during trading on Wednesday. The stock has a two hundred day moving average of $12.15 and traded as high as $13.13. Gladstone Commercial shares last traded at $13.00, with a volume of 405,761 shares traded. Wall Street Analyst

seekingalpha.comβ€’2026-07-20

Sell Alert: 3 REITs Facing Likely Dividend Cuts

Most REIT dividends remain safe, but not all. High yields can hide serious balance sheet risks. Three REITs may cut dividends soon.

zacks.comβ€’2026-07-15

Gladstone Commercial (GOOD) Rises Higher Than Market: Key Facts

Gladstone Commercial (GOOD) reached $12.71 at the closing of the latest trading day, reflecting a +1.11% change compared to its last close.

accessnewswire.comβ€’2026-07-14

Gladstone Commercial Corporation Announces Monthly Cash Distributions for July, August and September 2026 and Earnings Release and Conference Call Dates for its Second Quarter Ended June 30, 2026

MCLEAN, VA / ACCESS Newswire / July 14, 2026 / Gladstone Commercial Corporation (Nasdaq:GOOD) (the "Company") announced today that its board of directors declared cash distributions for the months of July, August and September 2026 and also announced its plan to report earnings for the second quarter ended June 30, 2026. Cash Distributions: Common Stock: $0.10 cash distribution per common share for each of July, August and September 2026, payable per Table 1 below.

seekingalpha.comβ€’2026-07-14

Gladstone Commercial: The Preferreds Offer A Hedge Against Common Equity Dilution

Gladstone Commercial is paying out a well-covered 9.6% dividend yield as it continues a strategic shift toward industrial real estate. GOOD is actively reducing office exposure and recycling capital into higher-growth industrial assets. The REIT's occupancy rate came in at 98.7% at the end of its fiscal 2026 first quarter. Equity dilution and a front-loaded debt maturity ladder pose risks, even as CFFO covers the dividend by 117%.

zacks.comβ€’2026-07-10

Gladstone Commercial Corporation (GOOD) is Attracting Investor Attention: Here is What You Should Know

Gladstone Commercial (GOOD) has received quite a bit of attention from Zacks.com users lately. Therefore, it is wise to be aware of the facts that can impact the stock's prospects.

zacks.comβ€’2026-07-07

Gladstone Commercial (GOOD) Declines More Than Market: Some Information for Investors

Gladstone Commercial (GOOD) closed at $12.53 in the latest trading session, marking a -1.49% move from the prior day.

zacks.comβ€’2026-07-07

Are Investors Undervaluing Gladstone Commercial (GOOD) Right Now?

Here at Zacks, our focus is on the proven Zacks Rank system, which emphasizes earnings estimates and estimate revisions to find great stocks. Nevertheless, we are always paying attention to the latest value, growth, and momentum trends to underscore strong picks.

zacks.comβ€’2026-07-03

Wall Street Analysts Think Gladstone Commercial (GOOD) Is a Good Investment: Is It?

When deciding whether to buy, sell, or hold a stock, investors often rely on analyst recommendations. Media reports about rating changes by these brokerage-firm-employed (or sell-side) analysts often influence a stock's price, but are they really important?

zacks.comβ€’2026-07-02

What Does Gladstone Commercial's New Ohio Lease Mean for Investors?

GOOD's new Ohio lease lifts its New Albany office and R&D property to full occupancy, supporting steadier rents. Meanwhile, revenue and FFO pressures linger.

zacks.comβ€’2026-07-01

Gladstone Commercial (GOOD) Rises As Market Takes a Dip: Key Facts

In the latest trading session, Gladstone Commercial (GOOD) closed at $12.43, marking a +1.06% move from the previous day.

πŸ“Š AI Financial Analysis

Powered by StockMarketInfo
Earnings Data: Q Ending 2026-03-31

"GOOD reported Q1’26 revenue of $41.9M and net income of $7.0M (EPS $0.08). YoY, revenue grew to $41.9M vs. $37.5M in Q1’25 (+11.7%), while net income increased to $7.0M vs. $5.1M (+35.9%). QoQ, revenue edged down from $43.5M in Q4’25 to $41.9M (-3.6%), but net income improved from $5.4M to $7.0M (+29.4%). Profitability appears solid in the latest quarter: net margin was ~16.6% in Q1’26, vs. ~13.7% in Q1’25 and ~12.4% in Q4’25, indicating margin expansion over both comparisons. Operating income was reported as $0 in Q1’26, but β€œincome before tax” and net income are positive and higher sequentially, consistent with improved overall profitability. Cash flow quality is mixed-to-adequate: operating cash flow was $17.9M and free cash flow approximated $17.9M in Q1’26 (no capex shown), but cash declined to $13.5M from $16.6M at quarter-end, implying outflows elsewhere (financing). Balance sheet leverage is meaningful: total debt is $411M with equity of ~$164M; net debt remains high at ~$403M. Total shareholder return signals modest momentum: price is $12.8 with 1Y change of -8.7%, so no positive momentum uplift. There’s no dividend/buyback disclosure in Q1’26. Analyst consensus target is $14 (below current), implying valuation is slightly ahead of target."

Revenue Growth

Positive

Q1’26 revenue $41.9M rose YoY +11.7% (vs Q1’25) but fell QoQ -3.6% (vs Q4’25), suggesting growth but with short-term softness.

Profitability

Positive

Net income YoY +35.9% and QoQ +29.4%. Net margin improved to ~16.6% in Q1’26 vs ~13.7% in Q1’25 and ~12.4% in Q4’25, indicating expansion.

Cash Flow Quality

Fair

Operating cash flow was $17.9M and free cash flow ~ $17.9M in Q1’26, supported by net income. However, cash decreased QoQ ($16.6M to $13.5M), implying financing/other cash uses.

Leverage & Balance Sheet

Caution

High leverage: total debt $411M and net debt ~$403M. Equity is only ~$164M; liquidity ratios remain very low (current ratio ~0.14).

Shareholder Returns

Caution

1Y price change is -8.7% (no >20% momentum). No dividend/buyback amount is shown for Q1’26, so shareholder return support appears limited.

Analyst Sentiment & Valuation

Neutral

Consensus price target is $14 vs current $12.8 (modest upside). Without clear tailwinds from momentum, valuation upside looks moderate.

Disclaimer:This analysis is AI-generated for informational purposes only. Accuracy is not guaranteed and this does not constitute financial advice.

Fundamentals Overview

Loading fundamentals overview...

Gladstone Commercial delivered a steady earnings quarter with FFO and core FFO of $0.35 per share, up from $0.34 a year ago, alongside revenue growth to $41.9M. The operating story is strong execution rather than leverage: 98.7% occupancy, 7.3-year weighted lease life, and 100% cash-based rent collections. Q1 leasing was a clear catalyst, with 773,000 SF industrial and 32,000 SF office renewed, lifting straight-line rent by more than $86,000 annually. Costs rose due to a larger asset base and depreciation, partially offset by incentive fee credits. Capital positioning also supports the industrial pivot: cash of ~$7.8M, ~$77M revolver availability, and meaningful but staggered maturities ($17.9M in 2026). Near-term focus is to push toward ~70% industrial straight-line rent while managing known office and Austin GM lease renewal risks. Acquisition interest remains $300M–$350M with mid-6.5% cap expectations and a belief that Q2–Q3 volumes improve as financing shifts toward sale-leasebacks.

AI IconGrowth Catalysts

  • Renewed/leased 773,000 SF industrial and 32,000 SF office in Q1, driving straight-line rent increase of >$86,000 annually
  • Updated 2026 leasing momentum: all leases for '26 addressed per management; remaining 3–4 leases being worked
  • High portfolio execution: 98.7% occupancy, 7.3-year average remaining lease term, and 100% collection of cash-based rents for the period

Business Development

  • U.S. government tenant renewal discussed as impacting timing due to shutdown/completion timing (renewal process continuing)
  • Delta in Atlanta referenced as an office renewal discussion with decision-making pushed to 12/31/27
  • Austin property referenced as tied to a GM lease expiring 12/31/26

AI IconFinancial Highlights

  • FFO per share and core FFO per share: $0.35 in Q1 2026 vs $0.34 in Q1 2025 (both metrics increased +$0.01 YoY)
  • Total operating revenues: $41.9M in Q1 2026 vs $37.5M in Q1 2025; operating expenses: $25.2M vs $23.9M
  • Same-store lease revenue +1% (3 months ended 3/31/26 vs 3/31/25), attributed to higher recovery revenue and rental-rate increases from leasing activity
  • Expenses up mainly from higher depreciation due to a larger portfolio, partially offset by crediting back incentive fee in Q1 2026
  • Sold a portion of a land parcel for a gain on sale of ~ $1.8M; no share buybacks and no common stock ATM activity during the quarter

AI IconCapital Funding

  • Cash on hand ~ $7.8M (as of call date reference: 'as of today')
  • Revolver borrowings outstanding: $34.3M as of 3/31/26
  • Revolver availability: ~$77M under line of credit (as of call date reference)
  • Loan maturities: $17.9M in 2026 and $35.2M in first quarter 2027
  • Dividends: $0.30/share/quarter ($0.10/month)

AI IconStrategy & Ops

  • Near-term strategic target: move toward ~70% industrial annualized straight-line rent (management disclosed working toward [70%])
  • Capital recycling: no property sales in Q1; disposed of noncore land parcel (~$1.8M gain) and continued focus on selling office/noncore when opportune
  • Portfolio management execution: addressed all '26 leases (per management) and is positioned with access to line of credit, private placement bond market, cash on hand, and ATM to deploy into industrial acquisitions/improvements
  • Automation not discussed; tenant credit underwriting unchanged per management

AI IconMarket Outlook

  • Acquisition pipeline remains $300M–$350M under review; 2 transactions believed to close within the quarter
  • Cap-rate target for deals: 'mid-6.5' cap going in
  • Expectation of more robust Q2 and Q3 as private credit is 'in flux' and sale-leasebacks become more common for financing

AI IconRisks & Headwinds

  • Office environment described as challenging; specific short-term occupancy decline in office tied to a Pennsylvania tenant downsizing (expected to recover as a new tenant occupies beginning in Q3)
  • Austin property (GM lease) is a near-term concentration risk: lease expires 12/31/26, and management is actively working the renewal ahead of that date
  • Acquisition market competition is high; underwriting pipeline differentiation relies on performance/underwriting execution rather than relaxing tenant credit requirements
  • Private credit market described as somewhat in flux, increasing reliance on alternative financing (including sale-leasebacks) in the broader market

Q&A: Analyst Interest

  • Topic: Leasing spreads vs rentβ€”What drove Q1 outcomes and what remains ahead into 2026. Management: Mark-to-market optimization drove a plus-up in the quarter, mainly from an industrial renewal. They said all '26 leases are addressed, with only 3–4 working. Austin is the main near-term concern, with continued activity toward more information soon.
  • Topic: Acquisition pipeline scope and cap-rate environmentβ€”How much is under review and what yields are acceptable. Management: They target the mid-6.5 cap range without changing credit requirements. Competition is heavy, but differentiation is doing what they underwrite and commit to. Pipeline stays $300M–$350M under review with 2 LOIs (~$87M) and 13 opportunities under review.
  • Topic: Underwriting philosophy and sale-leaseback momentumβ€”Will tenant-credit standards change and what tenant profile supports their strategy. Management: They have not changed credit underwriting, citing no tenants asking for relief and no missed rentals. Sale-leaseback momentum is coming from industrial/manufacturing tenants with heavy bolt-down costs and equipment (not big-box), where tenant immobility supports durable returns.

Sentiment: POSITIVE

Note: This summary was synthesized by AI from the GOOD Q1 2026 earnings transcript. Financial data is complex; please verify all metrics against official SEC filings before making investment decisions.

πŸ“‹ Official Regulatory 10-K / 10-Q SEC Filings

Direct authenticated documentation links to audited SEC database reports for GOOD.

SEC EDGAR Live Feed
Loading financial data and tables...
πŸ“

SEC Filings (GOOD)

Β© 2026 Stock Market Info β€” Gladstone Commercial Corporation (GOOD) Financial Profile