Gulfport Energy Corporation

Gulfport Energy Corporation (GPOR) Market Cap

Gulfport Energy Corporation has a market capitalization of $3.02B.

Price: $168.06

-3.00 (-1.75%)

Market Cap: 3.02B

NYSE · time unavailable

CEO: Michael L. Hodges

Sector: Energy

Industry: Oil & Gas Exploration & Production

IPO Date: 2021-05-18

Website: https://www.gulfportenergy.com

Gulfport Energy Corporation (GPOR) - Company Information

Market Cap: 3.02B|Sector: Energy

Company Profile

Gulfport Energy Corporation engages in the exploration, development, acquisition, production of natural gas, crude oil, and natural gas liquids (NGL) in the United States. Its principal properties include Utica Shale covering an area approximately 187,000 net reservoir acres primarily located in Eastern Ohio; and SCOOP covering an area approximately 74,000 net reservoir acres primarily located in Garvin, Grady, and Stephens. As of December 31, 2021, it had 3.9 trillion cubic feet of natural gas equivalent to proved reserves; and proved undeveloped reserves comprising 8 MMbbl oil and 22 MMBbl NGL, and 1,550 Bcf natural gas. The company was incorporated in 1997 and is headquartered in Oklahoma City, Oklahoma.

Analyst Sentiment

82%
Strong Buy

From 13 Active Polls

1Y Forecast: $238.67

▲ +42.0% Potential Upside

Consensus Target Metrics

Low Bound

$219

Median

$245

High Bound

$252

Average

$239

Price & Moving Averages

Loading chart...

🎯 Wall Street Analyst Intelligence Report

1-Year structural target targets, chart projections, and sentiment maps.

Average 1Y Target
$238.67
▲ +42.01% Upside
Low Target
$219.00
30% Risk
Median Target
$245.00
46% Mid
High Target
$252.00
50% Max
Consensus
Buy
5 / 8 Buys

Consensus Trend Projection

Trailing closures vs. 12-month metrics map.

Analyst Vote Distribution

Aggregate institutional coverage sentiment weights.

📊 Historical Valuation Multiples

Real-time Trailing Twelve Month (TTM) momentum side-by-side with discrete quarterly metrics.

Fiscal QuarterTTMQ1 2026Q4 2025Q3 2025Q2 2025Q1 2025Q4 2024Q3 2024Q2 2024
Period EndingTrailing 12MMar 31, 2026Dec 31, 2025Sep 30, 2025Jun 30, 2025Mar 31, 2025Dec 31, 2024Sep 30, 2024Jun 30, 2024
Market Cap ($M)3,0203,9253,9893,2783,5623,2933,2792,7342,727
Enterprise Value ($M)3,8414,7474,7763,9674,2543,9893,9873,4343,414
Price to Earnings Ratio (P/E)5.255.927.537.364.83-1774.03-3.00-48.93-26.01
Price/Earnings-to-Growth Ratio (PEG)0.100.5516.07-86.01-0.09-3.54
Price to Sales Ratio (P/S)1.956.9311.2210.4811.439.5811.5112.6614.38
Price to Book Ratio (P/B)1.722.172.171.791.981.951.881.301.26
Price to Free Cash Flow Ratio (P/FCF)8.3525.3197.8641.4041.1247.6945.7647.43-841.79
Enterprise Value to Sales (EV/Sales)8.3713.4312.6813.6611.6114.0015.9017.99
Enterprise Value to EBITDA (EV/EBITDA)3.0710.9618.4416.6513.2251.99-16.9142.9958.48
Debt to Equity Ratio0.660.460.430.380.390.420.410.330.32

GPOR Growth Runway Model

Standard long term linear growth fade

Multi-Stage Discounted Cash Flow Sandbox

Market Price$168.06
Intrinsic Value$91.63
Market Alignment
Overvalued by 45.5%relative to calculated intrinsic value
9.00%
Exp: 8%8%
i

Growth runway slowdown

This value provides a time window for the growth rate to decline beyond Stage 1 toward the terminal rate. Longer windows are most useful for companies with high growth starting conditions or strong competitive advantages. This option stretches out the growth rate slowdown across 5, 10, or 15-year steps. A high-growth starting condition (exceeding a 25% initial growth rate) automatically applies a curve decay to simulate realistic, rapid market saturation.
i

Terminal growth rate

With long-term inflation between 3-5%, revenue must grow by that baseline to maintain flat real-world market share. This value sets the permanent terminal growth rate to factor into the valuation beyond the growth slowdown runway toward maturity.

3-Stage Financial Runway Horizon

🧠 Perpetuity Horizon Engine (Stage 3: Post-2035)

Terminal FCF Base$0.27B
Perpetuity TV Value$5.00B
Discounted TV (PV)$2.11B
TV Weighting %62.6%
⚠️
Financial Model Disclaimer & Risk Disclosure: This interactive scenario simulator is an educational sandbox provided strictly for informational and analytical research purposes. Core historical financial statements and consensus estimates are sourced directly via Financial Modeling Prep (FMP). All downstream outputs are entirely deterministic, hypothetical projections generated by combining automated mathematical formulas (including linear interpolation and Gaussian bell-curve decay models) with user-selected variables and third-party financial data inputs. Users assume all liability for trading decisions executed based on these sandbox calculations.

📘 Full Research Report

ℹ️

AI-Generated Research: This report is for informational purposes only.

📘 GULFPORT ENERGY CORP (GPOR) — Investment Overview

🧩 Business Model Overview

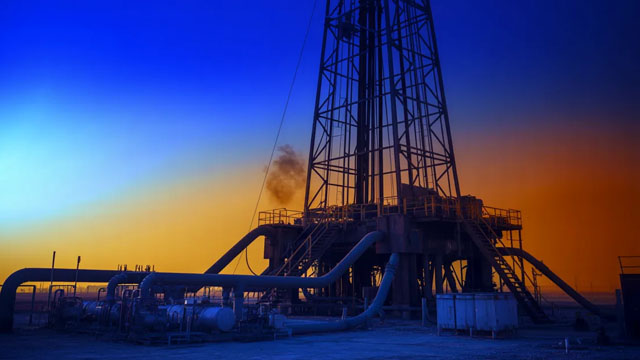
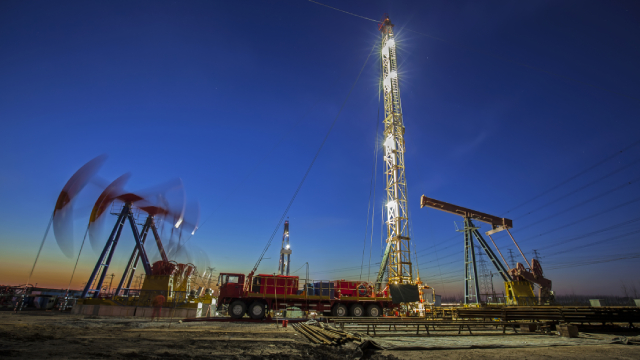
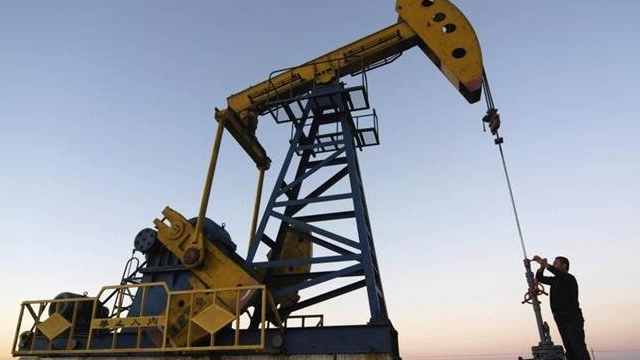
Gulfport Energy Corp (GPOR) is an upstream oil and natural gas producer that generates cash by drilling and operating wells in focused North American shale basins. The core value chain is: (1) acquire/hold acreage with development density, (2) drill horizontal wells and complete them using shale-specific stimulation, (3) produce oil, condensate, and gas that are gathered and processed through field infrastructure, and (4) market volumes into regional takeaway and processing markets. Profitability is driven less by marketing and more by execution—well productivity, field-level operating efficiency, and the ability to monetize production through reliable gathering, processing, and transportation.

Because the company develops and operates its own assets, it also benefits from operational learning curves (repeatable drilling/completion designs, reduced downtime, and improved well economics), which can raise the economic quality of its drilling inventory across cycles.

💰 Revenue Streams & Monetisation Model

GPOR monetizes production primarily through:

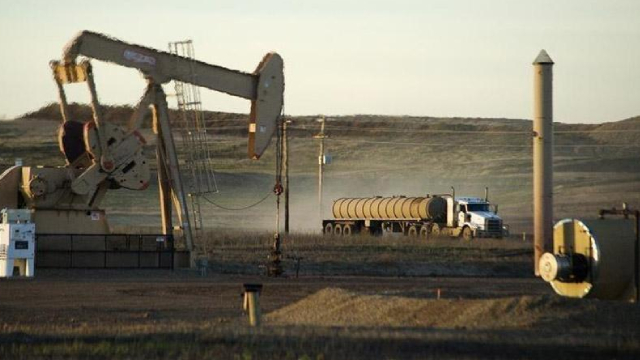
  • Oil (and condensate) sales: Typically the largest driver of revenue and a key determinant of margins because oil generally commands higher realized value per barrel than gas.
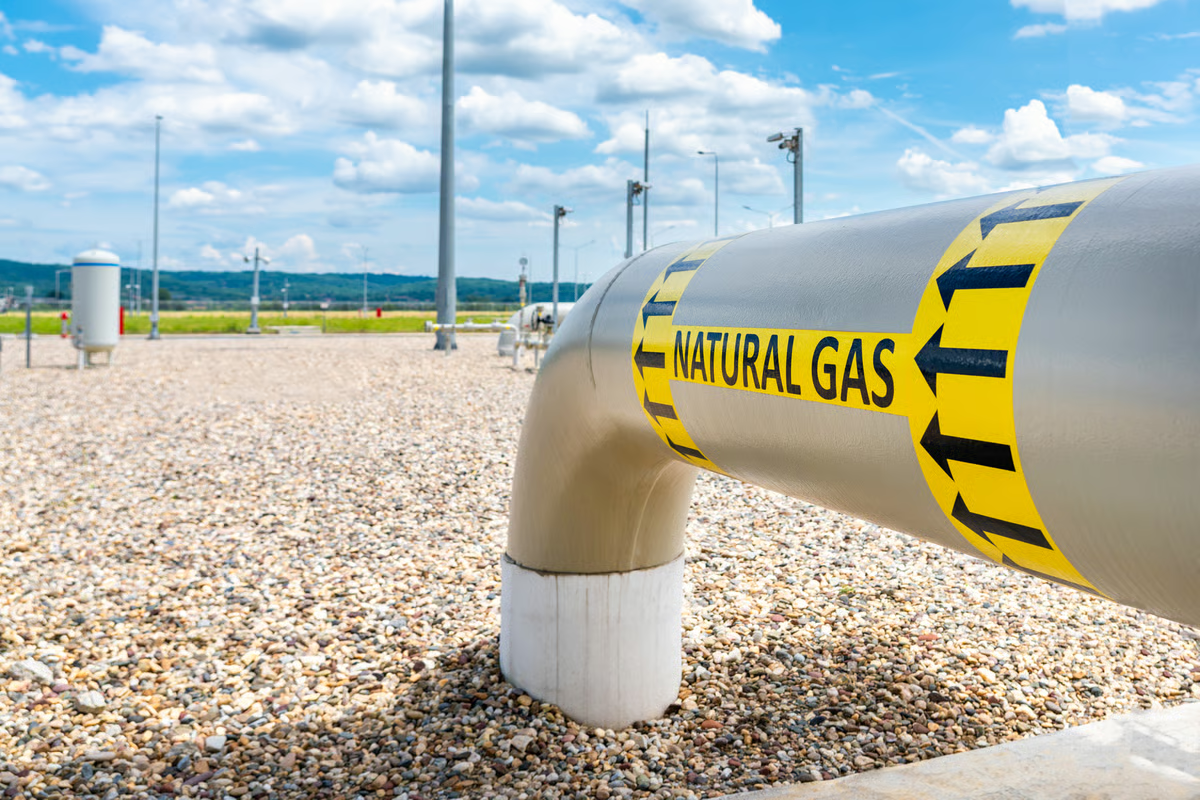
  • Natural gas sales: Monetized at regional pricing with exposure to gas basis differentials; often partially offset by processing and gathering efficiencies.
  • Natural gas liquids (NGLs), where applicable: Monetization depends on product mix and midstream arrangements for fractionation/processing.

The margin structure is influenced by (1) lease- and field-level operating costs (lifting, workovers, compression, processing fees), (2) transportation and gathering costs, and (3) realized pricing relative to benchmark markets. A key operational lever is maintaining a high share of liquids-rich production and minimizing per-unit costs through repeatable completions and dependable field infrastructure.

🧠 Competitive Advantages & Market Positioning

GPOR’s competitive positioning is best understood through geographic cost advantage and logistical infrastructure rather than proprietary technology or customer “switching costs” (typical for software). In shale plays, the ability to deliver hydrocarbons efficiently to market—while sustaining strong well performance—acts as an economic moat.

  • Low-cost feedstock exposure (liquids-rich shale oil): In upstream shale, value creation often depends on producing a high proportion of crude and condensate from targeted intervals. When an operator’s rock quality, completion design, and well spacing support strong economics, it can sustain drilling and operating activity through commodity cycles better than peers with less favorable productivity or higher cost structures.
  • Logistical infrastructure within the field: Dedicated gathering systems, processing arrangements, and established transportation paths reduce unit costs and reliability risk. This can lower “basis” exposure and improve netbacks by narrowing the gap between wellhead production and realized market pricing.
  • Operational density and repeatability: Concentrated acreage and development density support learning-by-doing (pad design optimization, sourcing efficiencies, and reduced completion variability), which can translate into lower cost per barrel and improved cash-flow conversion.

Competitive benchmarking (primary upstream peers):

  • Continental Resources (CLR): A focused Bakken operator with similar basin economics exposure, but with different acreage positioning and development plans.
  • Marathon Oil (MRO): Competes in North American liquids-focused plays with a broader portfolio profile, which can influence capital allocation and cost structure.
  • Hess (HES): An upstream producer with exposure to different basins and development strategies, affecting peer comparisons of basin-specific costs and decline rates.

Industry focus contrast: GPOR’s advantage is concentrated in specific shale development areas where it can leverage field infrastructure and operational density to improve netbacks and per-unit economics, rather than competing as a highly diversified producer across unrelated basins.

🚀 Multi-Year Growth Drivers

Growth over a 5–10 year horizon is less about expanding the overall market and more about sustaining capital discipline and compounding operational efficiency within the development inventory. Key drivers include:

  • Development inventory and well density: Future production growth is supported by drilling inventory where repeatable well designs can optimize capital efficiency.
  • Operational efficiency and cost-down: Improvements in drilling speed, completion execution, and workover planning can reduce all-in costs per unit, supporting more resilient cash flows across commodity cycles.
  • Infrastructure-led monetization: Enhancing or leveraging gathering/processing/transport capacity can improve realized pricing and reduce downtime or flaring-related losses.
  • Secular demand for oil and NGLs: Global energy demand dynamics continue to support long-term hydrocarbon consumption, with North American supply contributing to meeting that demand.
  • Capital allocation discipline: In upstream, value is created by directing capital toward the best risk-adjusted locations (highest return per unit of capital) rather than chasing volume.

⚠ Risk Factors to Monitor

  • Commodity price volatility: Oil and gas pricing drives revenue and cash generation; lower prices can compress drilling economics and increase balance-sheet stress.
  • Well performance and decline-rate uncertainty: Shale economics depend on reservoir quality and completion execution; adverse well results can impair reserve economics.
  • Regulatory and environmental constraints: Permitting, water disposal, flaring requirements, emissions rules, and local operating restrictions can increase costs and slow development.
  • Capital intensity and execution risk: Upstream requires ongoing capital; overbuilding or cost overruns can reduce returns.
  • Midstream and basis risk: Transportation/gathering bottlenecks, processing fees, and regional differentials can reduce realized netbacks.

📊 Valuation & Market View

The market typically values upstream E&P companies using a mix of EV/EBITDAX (or EV/EBITDA) and reserve-based valuation (NAV or standardized PV-style metrics). While valuation frameworks vary, the primary value drivers are consistent:

  • Net production profile and decline curves: Higher-quality reserves and durable decline performance support NAV durability.
  • Unit costs and netback strength: Sustained low operating expense and better transportation economics expand per-unit cash margins.
  • Drilling inventory quality: The economic quality of future well locations matters more than headline resource totals.
  • Balance-sheet flexibility: Leverage and debt maturity schedules influence downside resilience during weaker price environments.
  • Commodity sensitivity: Valuation moves with oil and gas price assumptions and realized pricing/basis differentials.

In practice, investors focus on whether an operator can convert development capital into reserves and cash flow with disciplined execution, and whether field infrastructure and costs preserve netbacks through cycles.

🔍 Investment Takeaway

GPOR’s long-term investment case rests on shale development economics supported by geographic cost advantages, field-level logistical infrastructure, and operational density. The moat is operational and structural: efficient monetization of liquids-rich production with repeatable execution. Key diligence should center on well performance durability, unit cost control, and the resilience of netbacks given midstream and regulatory constraints.


⚠ AI-generated — informational only. Validate using filings before investing.

📰 Market News & Coverage

15 Stories Available

Real-time institutional reporting and market updates for GPOR.

247wallst.com2026-06-04

Consolidation Wave Reshapes Energy Sector: 3 Stocks Vulnerable to Acquisition, Ranked

Energy sector consolidation has accelerated through 2026 so far, with majors and large independents acquiring scale, inventory, and strategic infrastructure.

zacks.com2026-05-19

Should Investors Buy Natural Gas Stocks as Prices Hit $3?

Gas futures break above $3 as heat and LNG exports lift demand; watch CRK, RRC and GPOR if the recovery holds into summer.

marketbeat.com2026-05-10

Gulfport Energy Q1 Earnings Call Highlights

Gulfport Energy NYSE: GPOR reported a strong start to 2026, with executives highlighting higher commodity pricing, continued capital returns and operational efficiency gains during the company's first-quarter earnings call.

seekingalpha.com2026-05-06

Gulfport Energy Corporation (GPOR) Q1 2026 Earnings Call Transcript

Gulfport Energy Corporation (GPOR) Q1 2026 Earnings Call Transcript

zacks.com2026-05-05

Gulfport Energy (GPOR) Lags Q1 Earnings Estimates

Gulfport Energy (GPOR) came out with quarterly earnings of $7.28 per share, missing the Zacks Consensus Estimate of $7.72 per share. This compares to earnings of $5.58 per share a year ago.

businesswire.com2026-05-05

Gulfport Energy Appoints Domenic J. Dell'Osso, Jr. Chief Executive Officer

OKLAHOMA CITY--(BUSINESS WIRE)--Gulfport Energy Corporation (NYSE: GPOR) (“Gulfport” or the “Company”) today announced that Domenic “Nick” Dell'Osso, Jr. has been appointed President and Chief Executive Officer, effective May 28, 2026. “Nick is a highly respected proven leader with the strategic vision, financial discipline and operational expertise to propel Gulfport forward into its next chapter of value creation,” said Timothy J. Cutt, Chairman of the Board. “He brings more than two decades.

businesswire.com2026-05-05

Gulfport Energy Reports First Quarter 2026 Financial and Operational Results

OKLAHOMA CITY--(BUSINESS WIRE)--Gulfport Energy Corporation (NYSE: GPOR) (“Gulfport” or the “Company”) today reported financial and operational results for the three months ended March 31, 2026, reaffirmed its 2026 development plan and provided an update on its financial position. First Quarter 2026 and Recent Highlights Delivered total net production of 996.8 MMcfe per day, an increase of 7% over first quarter 2025 Incurred capital expenditures of $121.7 million, which includes $117.9 million.

reuters.com2026-05-05

Exclusive: US shale producer Gulfport Energy to name Dell'Osso as CEO, sources say

Gulfport Energy is poised to name Domenic Dell'Osso as the ​next chief executive of the U.S. natural ‌gas-focused producer, people familiar with the matter said on Tuesday.

zacks.com2026-04-29

APA (APA) Expected to Beat Earnings Estimates: Should You Buy?

APA (APA) possesses the right combination of the two key ingredients for a likely earnings beat in its upcoming report. Get prepared with the key expectations.

zacks.com2026-04-28

Gulfport Energy (GPOR) Earnings Expected to Grow: What to Know Ahead of Next Week's Release

Gulfport (GPOR) possesses the right combination of the two key ingredients for a likely earnings beat in its upcoming report. Get prepared with the key expectations.

defenseworld.net2026-04-23

State of Alaska Department of Revenue Raises Stock Position in Gulfport Energy Corporation $GPOR

State of Alaska Department of Revenue increased its stake in Gulfport Energy Corporation (NYSE: GPOR) by 449.7% in the undefined quarter, according to the company in its most recent filing with the SEC. The institutional investor owned 3,914 shares of the company's stock after acquiring an additional 3,202 shares during the quarter. State

businesswire.com2026-04-21

Gulfport Energy Schedules First Quarter 2026 Earnings Release and Conference Call

OKLAHOMA CITY--(BUSINESS WIRE)--Gulfport Energy Corporation (NYSE: GPOR) announced today that it will host a teleconference and webcast to discuss its first quarter 2026 financial and operating results beginning at 9:00 a.m. ET (8:00 a.m. CT) on Wednesday, May 6, 2026. Gulfport plans to announce first quarter 2026 results on Tuesday, May 5, 2026, after market close. The conference call can be heard live through a link on the Gulfport website, www.gulfportenergy.com. In addition, you may partici.

zacks.com2026-04-20

Natural Gas Stuck Below $2.70: Can Demand Lift Prices Higher?

Natural gas stuck near $2.67 as mild weather and high supply cap gains; watch GPOR, RRC and LNG for summer demand and export upside.

defenseworld.net2026-04-09

Allspring Global Investments Holdings LLC Makes New $2.48 Million Investment in Gulfport Energy Corporation $GPOR

Allspring Global Investments Holdings LLC purchased a new position in shares of Gulfport Energy Corporation (NYSE: GPOR) during the undefined quarter, according to the company in its most recent disclosure with the SEC. The fund purchased 12,018 shares of the company's stock, valued at approximately $2,478,000. Allspring Global Investments Holdings LLC owned about

defenseworld.net2026-04-06

Gulfport Energy (NYSE:GPOR) Director Sells $85,360.00 in Stock

Gulfport Energy Corporation (NYSE: GPOR - Get Free Report) Director Jason Joseph Martinez sold 400 shares of the company's stock in a transaction that occurred on Thursday, April 2nd. The shares were sold at an average price of $213.40, for a total value of $85,360.00. Following the completion of the transaction, the director directly owned 3,888

📊 AI Financial Analysis

Powered by StockMarketInfo
Earnings Data: Q Ending 2026-03-31

"GPOR reported Q1’26 revenue of $437.5M and net income of $165.8M (EPS $8.94). On a YoY basis, revenue rose +27.4% versus Q1’25 ($343.6M), and net income swung from a loss of -$0.5M in Q1’25 to +$165.8M (+~$166.3M improvement). QoQ, revenue increased +23.0% from Q4’25 ($355.5M), while net income rose +25.2% from $132.4M. Profitability improved: Q1’26 operating margin was 52.0% and net margin 37.9%, both higher than Q4’25 (38.2% operating; 37.2% net). Across the last four quarters, margins appear structurally stronger than the prior-year trough (Q1’25 was loss-making). Cash flow quality remained solid. Q1’26 operating cash flow (OCF) was $292.9M, generating free cash flow (FCF) of $155.1M (after capex). Shareholder returns were supported by buybacks: Q1’26 repurchased $152.5M of stock and received no dividends. Balance sheet resilience is good for a non-bank: total assets were reported at $3.08B and equity at $1.81B, while net debt was high at $824.1M; however interest coverage was strong (14.8x), implying manageable debt service. On valuation, price was $193.48 with a consensus target of $242 (implied upside ~25%). Total shareholder return is positive, but momentum is moderate: the stock is up +13.8% over 1 year (not >20%)."

Revenue Growth

Good

Q1’26 revenue $437.5M: +23.0% QoQ (vs $355.5M in Q4’25) and +27.4% YoY (vs $343.6M in Q1’25), indicating accelerating demand.

Profitability

Good

Net income $165.8M in Q1’26 (up +25.2% QoQ; from -$0.5M YoY). Net margin improved to 37.9% from 37.2% in Q4’25 and was far above the loss quarter in Q1’25.

Cash Flow Quality

Good

OCF $292.9M and FCF $155.1M in Q1’26. No dividends; buybacks of $152.5M supported cash deployment while remaining comfortably cash-generative.

Leverage & Balance Sheet

Neutral

Equity was stable/high at $1.81B, but net debt remains substantial at $824.1M. Interest coverage (14.8x) suggests resilience despite leverage.

Shareholder Returns

Positive

Total return supported by repurchases ($152.5M in Q1’26) and positive market performance (+13.8% 1Y). Notably, price momentum is below the >20% threshold.

Analyst Sentiment & Valuation

Positive

Consensus target $242 vs price $193.48 implies ~25% upside, suggesting constructive analyst sentiment/valuation support.

Disclaimer:This analysis is AI-generated for informational purposes only. Accuracy is not guaranteed and this does not constitute financial advice.

Fundamentals Overview

Loading fundamentals overview...

So What?: GPOR’s Q1 shows strong free-cash-flow generation ($264M adjusted EBITDA; $119M adjusted FCF) and cost discipline, with production of 997 MMcfe/d tracking prior expectations and 2026 guidance reaffirmed (1.03–1.055 Bcfe/d; $1.23–$1.34 per Mcfe cash operating costs). The key value driver is execution: Utica and Marcellus drilling efficiency improvements (top-hole section record and +20% footage/day) plus SCOOP cycle-time progress (~40-day spud-to-rig-release). Capital allocation is aggressive but flexible—buybacks topped ~$172.8M in Q1, with $300M+ spent over two quarters and ~10% share retirement, while discretionary acreage was already wrapped (~$102M for >2 years of inventory). Guidance hinges on maintaining drilling/completions performance and differential strength; risks are diesel-linked service inflation and commodity/basis volatility, though management frames impacts as net-neutral so far. Net sentiment: positive given liquidity ($872M) and operational momentum.

AI IconGrowth Catalysts

  • Utica dry gas development: brought five gross Utica dry gas wells online in Q1 (including first two U development wells); activity unlocked ~1 year of additional high-quality inventory for future development flexibility
  • 2026 liquids-skew turn-in schedule: ~2/3 of remaining 2026 turn-in-lines expected to include significant liquids component
  • Operational drilling efficiencies expanding across plays: Utica record top-hole section speed (5.4 days single well; 5.9 days average for four-well pad); Marcellus +20% footage/day vs prior operated pads; SCOOP HERO pad spud-to-rig-release ~40 days vs internal 55-day expectation

Business Development

  • Discretionary acreage acquisition program (Ohio Utica) completed: invested ~$102 million over past four quarters to add >2 years of high-quality inventory adjacent to core positions in Belmont and Monroe Counties
  • Spring borrowing base redetermination: added 10% to elected bank commitments; reaffirmed borrowing base at $1.1 billion

AI IconFinancial Highlights

  • Adjusted EBITDA: $264 million; Adjusted free cash flow: $119 million (driven by strong commodity pricing and continued development)
  • Production: 997 MMcfe/d average in Q1, consistent with Feb expectations; reaffirmed full-year production guidance 1.03 to 1.055 Bcfe/d
  • Cash operating costs: $1.38 per Mcfe in Q1 (LOE + midstream + taxes other than income) in line with expectations and similar to prior year; expects per-unit cost decline through 2026 as fixed charges amortize
  • Full-year operating cost guidance reaffirmed: $1.23 to $1.34 per Mcfe (includes LOE, midstream, taxes other than income)
  • Capital spent: $118 million drilling & completion; $4 million maintenance/land/seismic investment
  • Liquidity: $872 million total at quarter-end (cash $2.9 million + $869.3 million revolver capacity); trailing twelve-month net leverage ~0.9x, pro forma for increased elected commitments

AI IconCapital Funding

  • Share repurchases: 866k shares for ~$172.8 million in Q1; highest quarterly investment in company history
  • Total repurchases since inception (incl. 2025 preferred redemption): ~8.2 million shares at average price just over $133; nearly $1.1 billion returned to shareholders over past four years
  • Over last two quarters: allocated $300+ million to repurchase ~10% of shares outstanding; intends to maintain active repurchase program through 2026 while keeping leverage at or below 1.0x
  • Use of debt/flexibility: company stated it could lean on the revolver in lower free-cash-flow quarters to fund equity buybacks or discretionary acreage opportunities; no explicit debt level changes beyond borrowing base reaffirmation

AI IconStrategy & Ops

  • Rig strategy: started 2026 with 3 operating drilling rigs; released SCOOP rig at end of Q1; currently 2 rigs drilling in Ohio
  • Planned rig reduction: release one rig at end of Q2 and transition to 1-rig program in Ohio for remainder of 2026
  • Completion/turn-in: first two 2026 pad turn-ins delivered on time and on budget; ~2/3 of remaining turn-ins expected with significant liquids
  • Safety/operations: zero recordable incidents or spills during quarter

AI IconMarket Outlook

  • Reaffirmed 2026 production guidance: 1.03 to 1.055 Bcfe/d
  • Reaffirmed 2026 cash operating cost guidance (LOE + midstream + taxes other than income): $1.23 to $1.34 per Mcfe
  • Differentials: management reiterated full-year differential guide is still appropriate; bullish toward improvement opportunities later into 2027/2028 as Northeast demand (data centers/power) contributes to basis
  • Liquids skew: starting point stated as 9% liquids in Q1; expects low-teens liquids percentage back-half weighted for 2026 (not a fixed 15% target); will assess for 2027

AI IconRisks & Headwinds

  • Diesel inflation and knock-on logistics/trucking costs: management sees largest service-price movement around diesel; expects net-neutral impact so far and stated guidance not changed
  • Commodity price and differential volatility: company highlighted that even $0.05 differential shifts can materially affect free cash flow and EBITDA; relies on continued strong Northeast basis
  • Capital allocation ambiguity: repurchase pacing intentionally not formulaic quarter-by-quarter, introducing uncertainty around the timing of buybacks vs discretionary acreage and potential revolver usage
  • Execution risk remains: SCOOP and other plays depend on maintaining drilling-day/efficiency consistency to justify capital intensity

Q&A: Analyst Interest

  • Repurchases vs discretionary acreage (and whether to use debt in low-FCF quarters): Management said capital allocation remains dynamic, evaluating opportunities continuously. It prioritizes high-quality discretionary locations but highlighted balance-sheet flexibility to use the revolver in low free-cash-flow quarters if equity value is attractive, avoiding rigid quarter-by-quarter formulas.
  • Runway for drilling efficiency gains and service-price inflation (diesel): Management framed efficiency improvements as “sixth inning,” citing incremental top-hole gains in Utica, ~20%/pad improvements in Marcellus footage/day, and ~40-day SCOOP spud-to-rig-release performance. They confirmed diesel-linked cost pressure, mitigated by locking service contracts and efficiency gains; guidance unchanged.
  • Liquids skew trajectory, hedging coverage, and differential outlook: Management indicated a planned shift to low-teens liquids back-half weighted in 2026 (starting Q1 noted at 9%), with flexibility to move higher later. It reiterated hedging flexibility (targeting 30% to 70% into a year for 2027) and emphasized Northeast basis/differentials remain bullish with data center/power-driven demand.

Sentiment: POSITIVE

Note: This summary was synthesized by AI from the GPOR Q1 2026 earnings transcript. Financial data is complex; please verify all metrics against official SEC filings before making investment decisions.

📋 Official Regulatory 10-K / 10-Q SEC Filings

Direct authenticated documentation links to audited SEC database reports for GPOR.

SEC EDGAR Live Feed
Loading financial data and tables...
📁

SEC Filings (GPOR)

© 2026 Stock Market Info — Gulfport Energy Corporation (GPOR) Financial Profile