Teekay Tankers Ltd.

Teekay Tankers Ltd. (TNK) Market Cap

Teekay Tankers Ltd. has a market capitalization of .

No quote data available.

CEO: Kenneth Hvid

Sector: Industrials

Industry: Marine Shipping

IPO Date: 2007-12-13

Website: https://www.teekay.com/business/tankers

Teekay Tankers Ltd. (TNK) - Company Information

Market Cap: -|Sector: Industrials

Company Profile

Teekay Tankers Ltd. provides marine transportation services to oil industries in Bermuda and internationally. The company offers voyage and time charter services; and offshore ship-to-ship transfer services of commodities primarily crude oil and refined oil products, as well as liquid gases and various other products. It also provides tanker commercial and technical management services. As of December 31, 2021, the company owned and leased 48 double-hull oil tankers, time-chartered in two Aframax tankers, and one LR2 tanker. Teekay Tankers Ltd. was incorporated in 2007 and is headquartered in Hamilton, Canada.

Analyst Sentiment

67%
Buy

From 4 Active Polls

1Y Forecast: $86.00

▲ +0.0% Potential Upside

Consensus Target Metrics

Low Bound

$86

Median

$86

High Bound

$86

Average

$86

Price & Moving Averages

Loading chart...

🎯 Wall Street Analyst Intelligence Report

1-Year structural target targets, chart projections, and sentiment maps.

Average 1Y Target
$86.00
▲ +19.11% Upside
Low Target
$86.00
19% Risk
Median Target
$86.00
19% Mid
High Target
$86.00
19% Max

Consensus Trend Projection

Trailing closures vs. 12-month metrics map.

Analyst Vote Distribution

Aggregate institutional coverage sentiment weights.

Sentiment volume allocation data unavailable.

Historical valuation matrix unavailable.

📘 Full Research Report

ℹ️

AI-Generated Research: This report is for informational purposes only.

📘 TEEKAY TANKERS LTD CLASS A (TNK) — Investment Overview

🧩 Business Model Overview

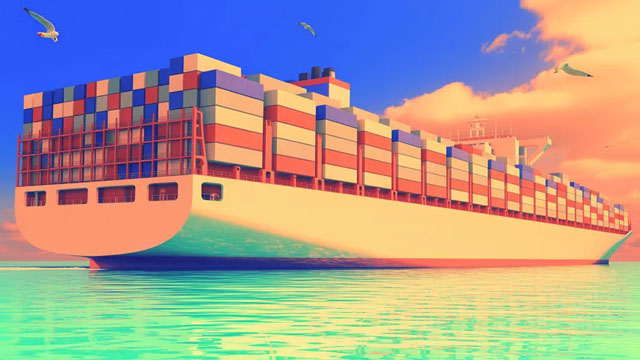
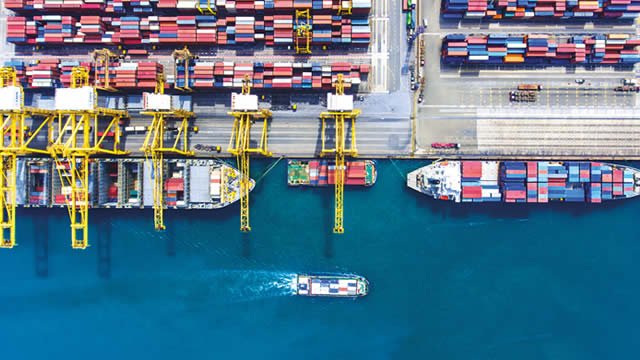
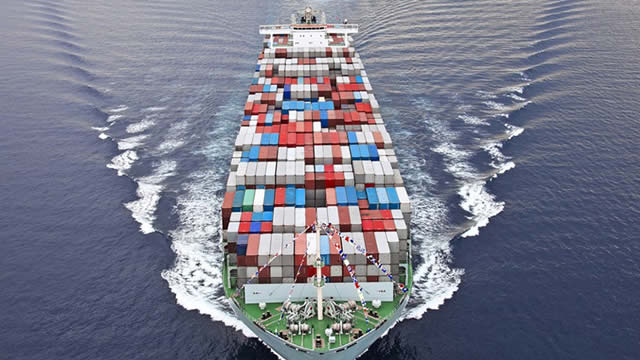
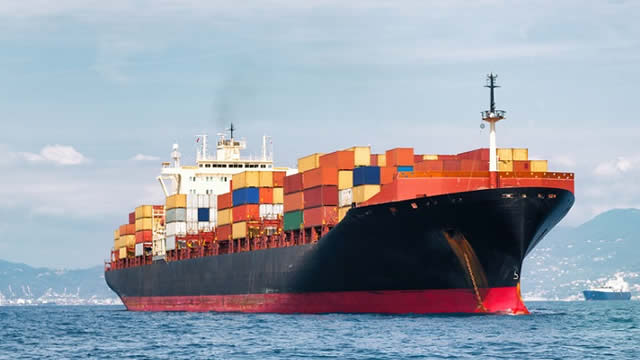
Teekay Tankers earns revenue by moving energy products through chartering its tanker fleet to oil majors, refiners, traders, and commodity intermediaries. The economic “engine” is the spread between (i) the cost to operate and finance vessels (crew, maintenance, insurance, technical management, and capital costs) and (ii) the charter revenue generated from contracted voyages or time charters.

In this business model, stickiness comes less from direct customer switching costs and more from the operational reality of shipping: counterparties value reliable vessel availability, compliant operations, and execution capacity across routes and port constraints. Over time, customer relationships and fixture outcomes tend to be reinforced by demonstrated performance (safety, reliability, and charterer-friendly scheduling), which can reduce friction during negotiations for future employment.

💰 Revenue Streams & Monetisation Model

Revenue is primarily generated through tanker charters, typically structured as a mix of time charters and voyage/spot exposure depending on fleet employment strategy and market conditions. Monetisation is driven by:

  • Time-charter earnings—more stable cash flows when vessels are employed under contracted terms.
  • Spot/voyage exposure—greater upside during tightening balances, but with higher earnings volatility.
  • Operational efficiency—vessel uptime, technical performance, and cost control affect the margin conversion from charter rates into earnings.

Margin dynamics are influenced by fleet utilization, charter rate levels, operating cost inflation (including crew and maintenance), and the company’s ability to manage asset life and dry-docking schedules without disrupting earning capacity.

🧠 Competitive Advantages & Market Positioning

Shipping tankers generally lack classic “switching costs,” but competitive advantage can still be structural. Teekay Tankers’ positioning rests on operational execution and disciplined fleet/counterparty employment—attributes that help secure favorable vessel employment outcomes and improve earnings quality across cycles.

Key moat (practical barrier): operational and commercial reliability.

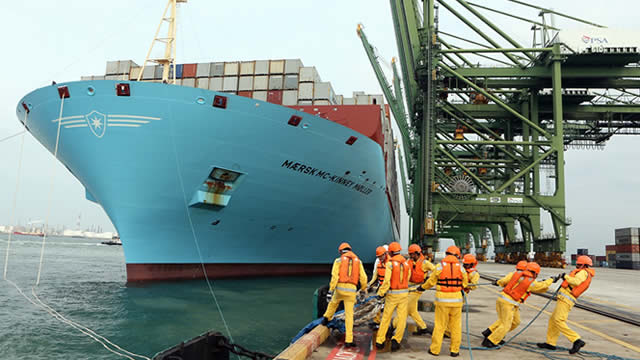
  • Technical management capability that supports high uptime and predictable delivery, reducing charterer exposure to delays and inefficiencies.
  • Counterparty and fixture competence—charterers repeatedly use counterparties that consistently meet scheduling, compliance, and documentation requirements.
  • Fleet quality and compliance that matters more under tightening environmental rules, where non-compliant or inefficient vessels face reduced employment optionality.

Competitive benchmarking (industry peers):

  • Euronav—larger-scale presence with focus across major crude tanker routes; competes for employment using fleet scale and commercial coverage.
  • Frontline—active participation in the tanker market with an emphasis on large-vessel employment and risk-managed fleet strategies.
  • Scorpio Tankers—sector-focused competitor with extensive commercial activity across crude/product segments.

Compared with these peers, Teekay Tankers’ emphasis on employment strategy and operating discipline competes on reliability and cost conversion rather than attempting to “win” purely through asset size. In markets where compliance and uptime are increasingly decisive, that operational reliability can translate into better employment continuity and improved downside resilience.

🚀 Multi-Year Growth Drivers

Over a 5–10 year horizon, growth in seaborne tanker demand is supported by structural trade patterns and fleet replacement dynamics:

  • Long-haul energy trade—geographic rebalancing of crude and refined product flows can increase average voyage distances, raising demand for ton-miles.
  • Fleet turnover and regulatory-driven supply tightening—environmental regulations and compliance costs reduce the pool of economically deployable vessels over time, supporting vessel scarcity during various parts of the cycle.
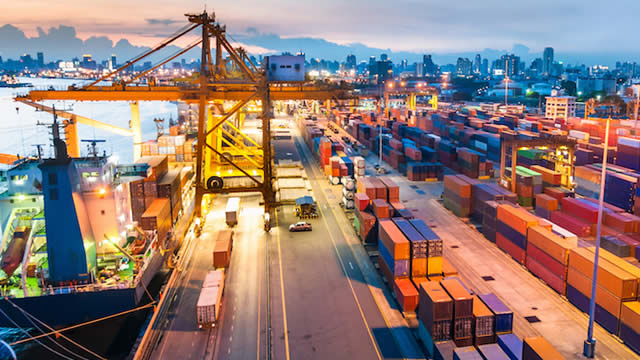
  • Port and logistics complexity—increasing operational constraints (scheduling windows, documentation, and compliance processes) elevate the value of reliable operators with strong technical management.
  • Contracting and employment strategy—a multiyear approach to fixing and coverage can help smooth cash flows and sustain investment through market cycles.

⚠ Risk Factors to Monitor

  • Cyclicality and charter-rate volatility—shipping earnings are highly sensitive to global oil demand, fleet supply/delivery cycles, and trade imbalances.
  • Regulatory and decarbonization risk—new environmental requirements can increase retrofit and operating costs, and some vessels may face reduced charterability.
  • Capital intensity and asset values—dry-docking, compliance upgrades, and refinancing needs can pressure liquidity during weak market periods.
  • Counterparty and credit risk—charter counterparties and financing providers can affect cash realization and access to capital, particularly in stressed conditions.
  • Operational execution risk—accidents, compliance failures, and unexpected technical issues can impair utilization and increase costs.

📊 Valuation & Market View

The market typically values tanker companies using a mix of frameworks, reflecting both earnings power and asset value. Common lenses include:

  • Enterprise value vs. earnings multiples (e.g., EV/EBITDA) where charter rates and utilization expectations drive the cycle.
  • NAV/asset-based approaches, given that fleets represent a meaningful portion of economic value and can be appraised through market values and replacement costs.
  • Cash flow and balance-sheet quality, with net debt, liquidity, and charter coverage often influencing downside protection.

Key value drivers tend to include fleet employment profile, operating cost control, compliance readiness, and the durability of cash flows through the cycle. When expectations shift for trade growth, regulatory tightening, or fleet supply, valuation can move quickly.

🔍 Investment Takeaway

Teekay Tankers is a tanker shipping operator where the most defensible advantages come from operational reliability, compliance readiness, and disciplined fleet employment rather than traditional customer switching costs. Over time, regulatory-driven fleet turnover and long-haul trade dynamics can support tanker ton-mile demand, while technical management and cost conversion can improve earnings quality through the cycle. The investment case depends on maintaining execution and financial resilience amid the sector’s inherent charter-rate cyclicality.


⚠ AI-generated — informational only. Validate using filings before investing.

📊 AI Financial Analysis

Powered by StockMarketInfo
Earnings Data: Q Ending 2026-03-31

"TNK reported Q1’26 revenue of $286.1M and net income of $153.6M (EPS $4.42). On a YoY basis (vs Q1’25), revenue rose 23.6% (286.1M vs 231.6M) and net income grew 102.0% (153.6M vs 76.0M). QoQ (vs Q4’25), revenue increased 10.8% (286.1M vs 258.3M) while net income rose 27.4% (153.6M vs 120.5M). Profitability expanded: gross margin improved to 47.3% from 38.6% QoQ and 19.8% YoY, while net margin increased to 53.7% from 46.6% QoQ and 32.8% YoY. Cash generation remained strong. Operating cash flow was $119.6M and free cash flow was $76.6M in Q1’26, down from $99.9M in Q4’25 but well above prior-year Q1’25 free cash flow of $51.0M. The company paid dividends of $8.7M (payout ratio ~5.6%), and the cash balance remained substantial at $722.0M with net debt of about -$689.0M (net cash position). Total shareholder returns appear powerful: TNK’s 1-year price change is +96.5%, which should materially lift total return alongside a low but steady dividend yield (~0.34%). Analyst sentiment/valuation: the consensus target is $90 versus the current price of $75.29 (~+19.5% upside), suggesting constructive but not deeply asymmetric expectations."

Revenue Growth

Good

Revenue grew 23.6% YoY in Q1’26 and 10.8% QoQ, indicating an improving top-line trajectory.

Profitability

Strong

Margins expanded sharply: gross margin 47.3% (vs 19.8% YoY) and net margin 53.7% (vs 32.8% YoY). Net income doubled YoY (+102.0%).

Cash Flow Quality

Positive

Operating cash flow of $119.6M and free cash flow of $76.6M were positive and above YoY levels, though FCF declined vs Q4’25.

Leverage & Balance Sheet

Good

Balance sheet remains resilient with net debt of about -$689.0M (net cash) and equity of ~$2.19B; liquidity buffers via cash and short-term investments.

Shareholder Returns

Strong

Strong capital appreciation: +96.5% over 1 year. Dividend yield is modest (~0.34%), but total return momentum is clearly positive.

Analyst Sentiment & Valuation

Neutral

Consensus target $90 vs $75.29 current implies ~19.5% upside; valuation looks supported by recent earnings/margins but not an obvious deep-value setup.

Disclaimer:This analysis is AI-generated for informational purposes only. Accuracy is not guaranteed and this does not constitute financial advice.

Fundamentals Overview

Loading fundamentals overview...

Teekay Tankers’ Q1 2026 results were propelled by near-record spot midsized rates (avg ~$61,000/day) and an unusually favorable operating setup: significant spot exposure, low free-cash-flow breakeven now ~ $8,200/day, and no debt with cash just under $1B. GAAP and adjusted earnings both materially outperformed, with adjusted $3.69/share and GAAP $4.42/share, supported by ~$143M free cash flow from operations. Capital allocation remains disciplined but “slower buying” than planned: the company sold older Suezmax exposure and is locking in two Korean resale Suezmax newbuildings (~$190M) for 2027 delivery while maintaining substantial spot coverage (notably ~71% booked VLCC days in Q2). The core debate in Q&A was whether the strait-related inventory demand tail is transient or structural; management expects a longer rebuild cadence conditioned on oil prices and strategic energy-security diversification. Risks center on reopening timing and fleet aging/supply normalization dynamics.

AI IconGrowth Catalysts

  • Spot tanker rates near record highs in Q1, averaging ~$61,000/day across midsized tanker fleet
  • Medium-sized crude tanker demand supported by freeing up of Venezuelan crude exports to compliant destinations after removal of Nicolás Maduro
  • Trade inefficiencies from Middle East disruption (effective closure / blockade affecting Strait of Hormuz) increasing voyage distances and effective fleet supply reduction
  • Opportunistic long-duration out-charters: Suezmax at ~$80,000/day for 10–12 months; Aframax at ~$60,000/day for 12 months

Business Development

  • Agreements to acquire 2 Korean resale Suezmax newbuildings for total commitment of $190 million (expected delivery 2027)
  • Sold one 2009-built Suezmax for $53.5 million (expected gain on sale of $32.5 million recorded in Q2’26)
  • Completed sales of 2 Suezmax tankers for total proceeds of $73 million (gains on sales of $22.7 million recorded in Q1)
  • Secured spot rate commitments for Q2: VLCC $141,800/day, Suezmax $121,800/day, Aframax LR2 $98,000/day

AI IconFinancial Highlights

  • GAAP net income: $154 million ($4.42/share); adjusted net income: $128 million ($3.69/share), over $30 million better than last quarter and 2–3x prior-year Q1 results
  • Free cash flow from operations: ~$143 million; cash position increased to just shy of $1 billion with no debt at quarter end
  • Spot exposure and low free cash flow breakeven: free cash flow breakeven decreased to ~ $8,200/day for next 12 months
  • Dividend declared: regular fixed $0.25/share and special $1/share (based on prior year results)
  • Capital recycling impact: Q2’26 benefit expected from $53.5M sale with $32.5M gain; Q1 recorded $22.7M gains on $73M proceeds

AI IconCapital Funding

  • No debt as of quarter end
  • Cash increased to just shy of $1 billion
  • Special dividend declared: $1.00/share; regular dividend declared: $0.25/share
  • Net vessel redeployment in 2026 YTD: acquired/agreed to acquire 5 modern vessels for $332 million; sold/agreed to sell 4 vessels for $211 million

AI IconStrategy & Ops

  • Fleet renewal strategy: acquire modern vessels while selling older units; discipline emphasized despite elevated uncertainty
  • Blocking-and-tackling at a higher market watermark: capturing strong secondhand/asset sale values and redeploying into quality assets with ~20-year ownership horizon; buying pace slower than hoped
  • Out-charter strategy tied to volatile spot market; reporting emphasizes positioning-voyage back to next cargo to avoid overpromising rates
  • Q2 operational availability: for the VLCC being sold/delivered by June, 75 operating days expected in Q2; remaining days are unavailable after delivery; ~80% of those 75 days fixed at rate levels referenced

AI IconMarket Outlook

  • Q2 guidance via secured spot rates: $141,800/day (VLCC), $121,800/day (Suezmax), $98,000/day (Aframax LR2)
  • Booking coverage: ~71% of spot days booked for VLCC; ~57% on average for Suezmax and Aframax LR2 fleets

AI IconRisks & Headwinds

  • Strait of Hormuz reopening timing and speed of Middle East exports are highly unpredictable; tanker ton-mile demand impact may be delayed and longer-tailed
  • Tanker supply/demand uncertainty: order book expanding but scrapping remains limited; fleet aging at highest level in 30+ years; dark fleet remains with >20-year average age
  • Potential normalization risk: inventory restocking pace depends on oil prices (e.g., if oil stays >$100/bbl, replenishment may be less urgent)
  • Trading-pattern uncertainty: energy security drives longer voyage distances and potential structural route changes, but magnitude/timing remains to be seen

Q&A: Analyst Interest

  • Fleet renewal vs uncertainty: Management said the “blocking and tackling” continues, but buying pace is slower than hoped due to elevated secondhand values and geopolitical volatility. They emphasized balancing redeployment into long-term quality assets while preserving scale relevance and not seeking to become a net seller.
  • Operational rate absorption and booking timing: Management clarified reporting methodology by positioning voyage back to the next cargo and said they are not overpromising. They attributed variations mainly to regional and timing swings, while maintaining they secured their fair share of strong fixtures despite volatility and large day-to-day rate dispersion.
  • Inventory tailwind duration and structural trade changes: Management indicated replenishment will likely be needed after reopening, but the pace depends on oil prices and could be longer-term rather than immediate. They suggested energy-security-driven diversification (like post-Russia analogy) may structurally change routes and lengthen voyages.

Sentiment: POSITIVE

Note: This summary was synthesized by AI from the TNK Q1 2026 earnings transcript. Financial data is complex; please verify all metrics against official SEC filings before making investment decisions.

Loading financial data and tables...
© 2026 Stock Market Info — Teekay Tankers Ltd. (TNK) Financial Profile