HNI Corporation

HNI Corporation (HNI) Market Cap

HNI Corporation has a market capitalization of $2.72B.

Price: $45.01

1.43 (3.28%)

Market Cap: 2.72B

NYSE · time unavailable

CEO: Jeffrey D. Lorenger

Sector: Consumer Cyclical

Industry: Furnishings, Fixtures & Appliances

IPO Date: 1980-03-17

Website: https://www.hnicorp.com

HNI Corporation (HNI) - Company Information

Market Cap: 2.72B|Sector: Consumer Cyclical

Company Profile

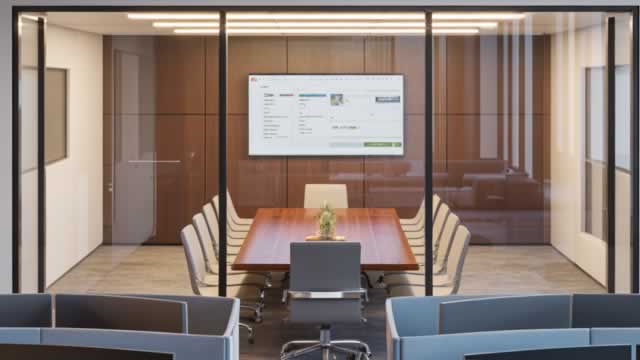
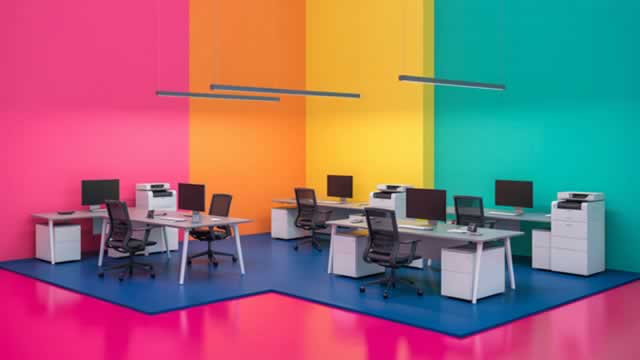
Established in 1944 and headquartered in Muscatine, Iowa, HNI Corporation specializes in the production and distribution of office furnishings and residential heating goods, primarily across the United States. The company's operations are divided into two distinct segments. The Workplace Furnishings segment provides a comprehensive array of furniture for commercial and home offices. This includes both modular and freestanding furniture systems, diverse seating options, storage solutions, tables, and integrated architectural components. These offerings are marketed under prominent brand names such as HON, Allsteel, Beyond, Gunlocke, Maxon, HBF, OFM, Respawn, Lamex, and HNI India. Sales channels for this segment are broad, encompassing independent dealerships, wholesalers, office supply distributors, e-commerce platforms, direct sales to end-users, and contracts with federal, state, and local government bodies. Conversely, the Residential Building Products segment focuses on a variety of hearth products designed primarily for domestic settings. Its portfolio features fireplaces, inserts, stoves, facings, and related accessories that operate on gas, wood, electric, or pellet fuel. Key brands within this segment include Heatilator, Heat & Glo, Majestic, Monessen, Quadra-Fire, Harman, Vermont Castings, PelPro, SimpliFire, The Outdoor GreatRoom Company, and Stellar. Products from this division reach consumers through independent dealers and distributors, alongside HNI Corporation's own network of distribution centers and retail outlets.

Analyst Sentiment

92%
Strong Buy

From 2 Active Polls

1Y Forecast: $65.00

▲ +44.4% Potential Upside

Consensus Target Metrics

Low Bound

$65

Median

$65

High Bound

$65

Average

$65

Price & Moving Averages

Loading chart...

🎯 Wall Street Analyst Intelligence Report

1-Year structural target targets, chart projections, and sentiment maps.

Average 1Y Target
$65.00
▲ +44.41% Upside
Low Target
$65.00
44% Risk
Median Target
$65.00
44% Mid
High Target
$65.00
44% Max
Consensus
Buy
2 / 3 Buys

Consensus Trend Projection

Trailing closures vs. 12-month metrics map.

Analyst Vote Distribution

Aggregate institutional coverage sentiment weights.

📊 Historical Valuation Multiples

Real-time Trailing Twelve Month (TTM) momentum side-by-side with discrete quarterly metrics.

Fiscal QuarterTTMQ3 2026Q2 2026Q1 2026Q3 2025Q2 2025Q1 2025Q4 2024Q3 2024
Period EndingTrailing 12MJul 4, 2026Apr 4, 2026Jan 3, 2026Sep 27, 2025Jun 28, 2025Mar 29, 2025Dec 28, 2024Sep 28, 2024
Market Cap ($M)2,7231,5001,9672,1302,2922,0992,4162,507
Enterprise Value ($M)4,2951,5723,1563,3902,5692,8482,6302,8902,954
Price to Earnings Ratio (P/E)-321.5018.83-14.76-10.3312.9511.9337.2315.7013.14
Price/Earnings-to-Growth Ratio (PEG)-0.29-0.355.171.061.69
Price to Sales Ratio (P/S)1.731.112.213.113.443.503.763.73
Price to Book Ratio (P/B)1.150.851.072.552.832.612.882.96
Price to Free Cash Flow Ratio (P/FCF)26.54-7.2932.2015.67138.94-677.2557.6621.92
Enterprise Value to Sales (EV/Sales)-1.172.343.823.764.274.384.504.39
Enterprise Value to EBITDA (EV/EBITDA)28.9281.4477.745649.6629.1930.5652.6035.1230.80
Debt to Equity Ratio10.580.930.970.890.550.720.690.590.57

📘 Full Research Report

ℹ️

AI-Generated Research: This report is for informational purposes only.

📘 HNI CORP (HNI) — Investment Overview

🧩 Business Model Overview

HNI CORP manufactures and sells office furniture and related workplace solutions, primarily through a combination of dealer/distribution networks and direct channels. The company’s operating model is built around translating customer workplace requirements—ranging from individual workstations to full office environments—into standardized product platforms, configured systems, and project-specific offerings.

This “spec-to-sell” pathway creates operational discipline: HNI partners with dealers and integrators who specify solutions during workplace planning, and those specifications tend to drive repeat purchase behavior during subsequent space refreshes, adjacencies, and upgrades (e.g., departmental expansion, reconfiguration, and furniture replacement cycles).

💰 Revenue Streams & Monetisation Model

HNI’s monetisation is dominated by furniture sales from end-customer projects and ongoing workplace orders, rather than subscriptions or long-duration recurring contracts. Revenue is typically influenced by:

  • Project and contract-driven demand (office builds, renovations, education and healthcare facilities)
  • Dealer and distribution activity (orders routed through partners)
  • Product mix (systems, components, and higher value configurations)

Margin drivers generally include pricing discipline, mix toward complex systems and higher-value offerings, operational efficiency (manufacturing productivity and sourcing), and logistics/freight performance. Because furniture manufacturing uses commodity inputs (steel and other materials), gross margin is also sensitive to input cost dynamics and the ability to pass through changes via pricing and contract terms.

🧠 Competitive Advantages & Market Positioning

HNI’s moat is best described as a combination of switching costs, distribution/scale leverage, and product/system integration (institutional “ecosystem” behavior rather than software-like lock-in).

Switching costs (practical, design-anchored):

  • In office environments, furniture often becomes part of an established workplace layout. Moving away from an installed system can require redesign work, compatibility checks, and replacement of adjacent components (tables, storage, connectivity, accessories), creating friction for procurement teams.
  • Dealers and workplace specifiers build familiarity with specific product families, which can slow vendor substitution during subsequent refresh cycles.

Scale/distribution leverage:

  • Competitive office furniture markets rely on strong dealer relationships and the capacity to serve multi-site projects with consistent lead times and quality.
  • HNI’s multi-brand portfolio supports targeted positioning across customer segments and price tiers, which can stabilize demand through varying end-market cycles.

Competitive benchmarking (industry focus vs peers):

  • Herman Miller: strong design reputation and premium positioning, with competitive differentiation often anchored in product design and brand-led pull. HNI generally competes more broadly across workplace segments via diversified brand coverage.
  • Steelcase: systems-centric approach and extensive workplace research, often emphasized in enterprise refresh cycles. HNI competes in systems and configurations but with a portfolio structure designed to capture demand across varying customer budgets and project types.
  • Haworth: workplace solutions with a focus on project customization and global reach. HNI’s positioning is characterized by scalable manufacturing and dealer/distribution reach, emphasizing consistent delivery for contract and project work.

Overall, while the market is competitive and products are not “irreplaceable” like patented technology, the installed base, specification habits, and compatibility/continuity needs create meaningful persistence—particularly across incremental upgrades and space reconfiguration events.

🚀 Multi-Year Growth Drivers

  • Workplace redesign cycle: Employers continue adjusting office layouts to support hybrid work patterns, collaboration needs, and ergonomics, which sustains demand for reconfiguration rather than replacement of entire buildings.
  • Systems and modularity adoption: Growth tends to favor furniture solutions that can be expanded, reconfigured, or matched across departments—aligning with HNI’s systems-focused value proposition.
  • Education and public-sector spend: Facilities with recurring refresh requirements can provide relative visibility, particularly when procurement standards favor established vendors and dependable delivery.
  • Geographic and channel execution: Continued strengthening of dealer networks and project execution capabilities can capture share during renovation-driven demand.

Over a 5–10 year horizon, the market opportunity is supported by ongoing corporate space optimization and periodic replacement/upgrade cycles, rather than a single disruptive technology shift.

⚠ Risk Factors to Monitor

  • End-market cyclicality: Office furniture demand is tied to enterprise capex, leasing/leverage decisions, and renovation budgets. Downturns can pressure volumes and utilization.
  • Input cost and pricing dynamics: Commodity-driven exposure (steel and other materials), along with freight and component costs, can compress margins if pricing power lags cost changes.
  • Supply chain and lead-time performance: Furniture production is operationally sensitive to components, logistics, and capacity. Execution issues can lead to missed timelines and contract penalties.
  • Competitive intensity: Large rivals with strong product ecosystems can intensify pricing or promotional activity in competitive procurement processes.
  • Design/technology preference shifts: Changes in workplace standards (e.g., connectivity requirements, sustainability expectations, evolving ergonomic norms) can require sustained product development investment.

📊 Valuation & Market View

The market typically values office furniture and industrial manufacturers using EV/EBITDA and earnings multiples, with attention to margin durability, working-capital behavior, and the credibility of volume recovery through cycles. Key valuation sensitivities include:

  • Gross margin and operating leverage (pricing/mix vs. input and freight costs)
  • Demand indicators tied to renovation and project pacing
  • Quality of earnings (working capital efficiency and operational consistency)

A sustained valuation premium generally requires evidence of resilient profitability across cycles, rather than one-off margin events.

🔍 Investment Takeaway

HNI CORP’s long-term investment case is anchored in durable workplace procurement behavior—an installed-base effect supported by systems compatibility, dealer/specifier relationships, and scalable delivery. While the business remains exposed to office renovation cycles and commodity input volatility, HNI’s multi-brand portfolio and distribution leverage can support share retention and margin stability when end-market activity normalizes. The core thesis is that incremental growth will come from ongoing workplace redesign and systems adoption, with competitive differentiation expressed through execution and product integration rather than patented technology.


⚠ AI-generated — informational only. Validate using filings before investing.

📰 Market News & Coverage

15 Stories Available

Real-time institutional reporting and market updates for HNI.

marketbeat.com2026-07-31

HNI Q2 Earnings Call Highlights

HNI NYSE: HNI reported second-quarter fiscal 2026 non-GAAP diluted earnings per share of $1.27, up 14% from a year earlier, as profit from the Steelcase acquisition, pricing and cost benefits, network optimization savings and productivity gains helped offset softer organic volumes earlier in the year.

seekingalpha.com2026-07-30

HNI Corporation (HNI) Q2 2026 Earnings Call Transcript

HNI Corporation (HNI) Q2 2026 Earnings Call Transcript

zacks.com2026-07-30

HNI (HNI) Surpasses Q2 Earnings Estimates

HNI (HNI) came out with quarterly earnings of $1.27 per share, beating the Zacks Consensus Estimate of $1.04 per share. This compares to earnings of $1.11 per share a year ago.

businesswire.com2026-07-30

HNI Corporation Reports Second Quarter 2026 Results

MUSCATINE, Iowa--(BUSINESS WIRE)--HNI CORPORATION REPORTS SECOND QUARTER 2026 RESULTS.

businesswire.com2026-07-24

HNI Corporation Recognized Among America's Best Companies by TIME

MUSCATINE, Iowa--(BUSINESS WIRE)--HNI CORPORATION RECOGNIZED AMONG AMERICA'S BEST COMPANIES BY TIME.

marketwatch.com2026-07-15

Small-cap outperformance is persisting — and these 15 quality stocks pay rich dividends

Think large caps are still the best bet? The data say you are looking in the wrong place.

zacks.com2026-07-06

Why HNI (HNI) is a Great Dividend Stock Right Now

Dividends are one of the best benefits to being a shareholder, but finding a great dividend stock is no easy task. Does HNI (HNI) have what it takes?

zacks.com2026-06-18

HNI (HNI) Could Be a Great Choice

Dividends are one of the best benefits to being a shareholder, but finding a great dividend stock is no easy task. Does HNI (HNI) have what it takes?

globenewswire.com2026-06-08

Allsteel Introduces the Award-Winning Levra™, a New Standard in Performance Seating Designed for How People Work Today

Developed in collaboration with ITO Design, Levra brings together intuitive innovation, human-centric engineering, and refined material expression. Developed in collaboration with ITO Design, Levra brings together intuitive innovation, human-centric engineering, and refined material expression.

seekingalpha.com2026-06-05

Dividend Champion, Contender, And Challenger Highlights: Week Of June 7

A weekly summary of dividend activity for Dividend Champions, Contenders, and Challengers. Companies which changed their dividends. Companies with upcoming ex-dividend dates.

zacks.com2026-06-02

Are You Looking for a High-Growth Dividend Stock?

Dividends are one of the best benefits to being a shareholder, but finding a great dividend stock is no easy task. Does HNI (HNI) have what it takes?

globenewswire.com2026-05-22

Allsteel Introduces Flourish, A Design-Forward Collaborative Chair

Designed by Chris Adamick, Flourish Blends Layered Craftsmanship, Comfort, and Material-Driven Versatility for Today's Workplace Designed by Chris Adamick, Flourish Blends Layered Craftsmanship, Comfort, and Material-Driven Versatility for Today's Workplace

gurufocus.com2026-05-19

HNI Corp (HNI) Shares Fall 3.0% -- What GF Score of 68 Tells Investors

On May 19, 2026, HNI Corp (HNI) shares fell 3.0% to a current price of $29.25. This decline is part of a larger trend, with the stock down 30.4% year-to-date an

businesswire.com2026-05-18

HNI Corporation Increases Quarterly Dividend

MUSCATINE, Iowa--(BUSINESS WIRE)--HNI Corporation (NYSE: HNI) announced today its Board of Directors declared a quarterly dividend of 35 cents per share on its common stock. The dividend will be payable on June 10, 2026, to shareholders of record at the close of business on May 29, 2026. About HNI Corporation HNI Corporation (NYSE: HNI) has been improving where people live, work, and gather for more than 80 years. HNI is a manufacturer of workplace furnishings and residential building products,.

businesswire.com2026-05-13

HNI Corporation Releases Corporate Responsibility Progress Report

MUSCATINE, Iowa--(BUSINESS WIRE)--HNI Corporation announces 2025 Corporate Responsibility Progress Report.

📊 AI Financial Analysis

Powered by StockMarketInfo
Earnings Data: Q Ending 2026-07-04

"Headline (2026-07-04, Q2): Revenue was -$1.35B and Net Income was +$51.1M (EPS $0.55). On a QoQ basis, Revenue swung from +$1.35B in Q1 2026 to -$1.35B in Q2 (a -200% QoQ change), while Net Income moved from -$38.8M to +$51.1M. On a YoY basis, Q2 2026 vs Q2 2025 shows Revenue deteriorating from +$667.1M to -$1.35B (approximately -302% YoY), while Net Income improved from +$48.2M to +$51.1M (+6.0% YoY). Profitability is highly volatile: gross margin reported at ~34.6% in Q2 2026, but operating and net profit ratios are negative (operatingIncomeRatio -1.24%, netIncomeRatio -3.79%)—a mismatch driven by the negative revenue sign convention in the dataset. Cash flow improved materially: operating cash flow was +$139.7M and free cash flow +$111.3M in Q2 2026, versus operating cash flow of -$171.7M and FCF of -$205.7M in Q1 2026. The company paid dividends of -$25.5M; buybacks were not reported. Balance sheet resilience looks mixed: total assets rose slightly to $4.82B, equity was roughly stable (~$1.81B vs ~$1.77B in Q1), but leverage remains elevated with total debt ~$1.68B and net debt ~$1.57B. Total shareholder returns appear modest given price momentum is not strong (1y_change -7.35%, no >20% momentum)."

Revenue Growth

Neutral

QoQ revenue swung from +$1.35B (Q1) to -$1.35B (Q2), ~-200% QoQ. YoY revenue fell from +$667.1M (Q2 2025) to -$1.35B (Q2 2026), ~-302% YoY.

Profitability

Fair

Net income turned positive: -$38.8M (Q1) to +$51.1M (Q2) (~+231% QoQ). YoY net income improved from +$48.2M to +$51.1M (+6.0%), but operating/net profit ratios are negative in the dataset due to the negative revenue sign convention—volatility remains high.

Cash Flow Quality

Neutral

Operating cash flow improved sharply to +$139.7M (from -$171.7M in Q1); free cash flow was +$111.3M (vs -$205.7M in Q1). Dividends of -$25.5M were paid; buybacks were not reported in Q2.

Leverage & Balance Sheet

Caution

Total assets were stable to slightly higher at $4.82B vs $4.77B (Q1). Equity was stable around $1.81B. Leverage remains substantial: total debt ~$1.68B and net debt ~$1.57B.

Shareholder Returns

Caution

Market performance shows price -7.35% over 1Y with no >20% momentum boost. Dividend payout appears active (dividends paid -$25.5M in Q2), but total shareholder return likely tempered by negative price performance; buybacks not evident.

Analyst Sentiment & Valuation

Fair

Consensus price target is $65 (high/low/median all $65) vs current price $37.94, implying upside on valuation models (~71% to target). No quarter-specific estimate changes are provided.

Disclaimer:This analysis is AI-generated for informational purposes only. Accuracy is not guaranteed and this does not constitute financial advice.

Fundamentals Overview

Loading fundamentals overview...

HNI delivered Q2 2026 non-GAAP EPS of $1.27 (+14% YoY) in line with expectations, supported by Steelcase profit, price/cost benefits (including tariff impacts), legacy network optimization savings, and productivity. Operating margin expanded 470 bps YoY to 20.4%, with net tariffs contributing ~150 bps in the quarter and ~40 bps expected for the full year. The core forward driver is accelerating Workplace momentum: Workplace organic orders +5% YoY, backlog +5% YoY, and management now expects volume growth returning in Q3, enabling high-single-digit legacy net sales growth and total Workplace (including Steelcase) net sales up ~175%–180% YoY in Q3. Residential remains mixed: revenue -1.6% YoY in Q2, with remodel strength offsetting new construction weakness; in 2H, volumes are guided low-single-digit negative but pricing is expected to keep revenue roughly flat. Capital remains disciplined—FCF reduced net debt by ~$100m and leverage fell to 2.4x. Biggest debate in Q&A: whether Steelcase synergies can rise above the $120m mature target and how margins will ramp as Q3–Q4 synergy benefits hit.

AI IconGrowth Catalysts

  • Steelcase integration benefiting from productivity, price/cost, and net tariff impacts; company expects modest accretion in 2H and full-year
  • Workplace Furnishings: orders strengthened; legacy order growth 5% YoY and backlog ended +5% YoY (supporting high-single-digit net sales growth in 2H)
  • Back-half Workplace volume rebound: expected return of volume growth in Q3 driving mid- to high single-digit net sales growth in 2H
  • Residential Building Products: remodel/retrofit business increased solidly and offset new construction channel weakness; expects pricing-driven revenue to hold revenue roughly flat in 2H

Business Development

  • Steelcase acquisition integration (Americas focus; synergy projections focused on Steelcase Americas business)
  • Dealer and dealer showrooms: dealers investing in showrooms; cited as confidence indicator after Steelcase ecosystem transition
  • Named industry/commercial activity indicators: office leasing activity up 27% YoY (trailing 4-quarter), trailing 4-quarter net absorption nearly 31 million sq ft (highest since 2019)

AI IconFinancial Highlights

  • Non-GAAP EPS: $1.27 (up 14% YoY), in line with expectations
  • GAAP diluted EPS: $0.70 in the quarter
  • Segment operating margin expanded 470 bps YoY to 20.4% in Q2 (including net benefits of tariffs, legacy network optimization savings, and productivity benefits)
  • Net tariff impact: about +150 bps to operating margin in Q2; expected ~+40 bps benefit in full-year
  • Orders/backlog: Workplace organic orders +5% YoY; legacy Workplace backlog +5% YoY
  • Residential revenue: -1.6% YoY; remodel/retrofit increased solidly, new construction weakness offset

AI IconCapital Funding

  • Free cash flow used to reduce net debt by approximately $100 million during the quarter
  • Debt leverage: 2.4x at quarter-end, down from 2.5x last quarter
  • Leverage expected to return toward pre-Steelcase levels within 18–24 months after the December 2025 closing

AI IconStrategy & Ops

  • Steelcase synergy capture accelerating through integrated management office teams and bottom-up project lists (SG&A, logistics, procurement, network optimization)
  • Synergies: target language adjusted to 'at least $120 million' fully mature; company expects potential for a higher figure after timeline/project confidence review in next 60 days
  • Legacy workplace network optimization: benefits referenced as including $30 million of previously announced savings
  • Investment shift: reinvestment into product development and sales enablement post an identified BT project resource issue (described as diverting resources to NPD and 'win at the point of attack')
  • Gross margin framework: legacy Workplace margin confidence for +150 bps to 12% (from 10.5%) this year, prior to tariff refund

AI IconMarket Outlook

  • 2026 full-year: expect 20%–25% non-GAAP EPS growth from 2025 base of $3.46 (with accelerating double-digit earnings growth in 2H)
  • Q3 2026: non-GAAP diluted EPS expected to increase at a mid- to high-20% range YoY (from Q3 2025)
  • Q3 net sales guidance: legacy Workplace high-single-digit YoY; including Steelcase, total Workplace Furnishings expected +175% to +180% YoY
  • Q3 Residential Building Products net sales: roughly unchanged YoY
  • 2H Residential: volume low single digits negative offset by pricing to keep revenue relatively flattish/flat

AI IconRisks & Headwinds

  • Workplace Furnishings organic volume pressure early year due to geopolitical pressures
  • Housing backdrop: continued uncertainty and elevated interest rates/affordability constraints; ongoing new construction weakness expected through 2026
  • Tariff accounting dynamics: management highlights net tariff benefit and separately references tariff refund effects on margin levels
  • Steelcase integration transition year: potential lumpiness due to larger project sizes vs legacy, requiring improving order-to-forecast predictability

Q&A: Analyst Interest

  • Synergy target tweak and potential upside: Management explained the original $120m target was analytics-based pre-integration, supported by historical analogs and margin economics. After 7 months, integrated teams built larger bottom-up SG&A/logistics/procurement/network projects. Over 60 days, they’ll set timelines and update confidence, with expectation the adjusted target could be higher than $120m.
  • Gross margin line mechanics and embedded guidance: Management clarified like-for-like differences versus Steelcase freight/distribution. For legacy Workplace, they still expect ~+150 bps this year (10.5% to 12%) before tariff refund. Residential shows a ~90-bps plan for incremental improvement before refund. Steelcase margin will align to legacy P&L as synergies begin hitting in Q3–Q4.
  • Order acceleration confidence for high-single-digit Workplace revenue growth: Management tied the outlook to three supports: (1) backlog and order growth rates at ~5% going into/out of the quarter, (2) post-quarter order acceleration materially higher than 5% driven by stronger contract-side performance, and (3) weighted funnel strength (preorder metrics/“won but not ordered” visibility).

Sentiment: POSITIVE

Note: This summary was synthesized by AI from the HNI Q2 2026 earnings transcript. Financial data is complex; please verify all metrics against official SEC filings before making investment decisions.

📋 Official Regulatory 10-K / 10-Q SEC Filings

Direct authenticated documentation links to audited SEC database reports for HNI.

SEC EDGAR Live Feed
Loading financial data and tables...
📁

SEC Filings (HNI)

© 2026 Stock Market Info — HNI Corporation (HNI) Financial Profile