Hanesbrands Inc.

Hanesbrands Inc. (HBI) Market Cap

Hanesbrands Inc. has a market capitalization of $2.29B.

Price: $6.47

▲ 0.00 (0.00%)

Market Cap: 2.29B

NYSE ¡ time unavailable

CEO: Stephen Bratspies

Sector: Consumer Cyclical

Industry: Apparel - Manufacturers

IPO Date: 2006-09-06

Website: https://www.hanes.com

Hanesbrands Inc. (HBI) - Company Information

Market Cap: 2.29B|Sector: Consumer Cyclical

Company Profile

Hanesbrands Inc. is a long-standing consumer goods enterprise focused on the design, manufacturing, sourcing, and distribution of fundamental apparel for men, women, and children. The company organizes its operations across three primary segments: Innerwear, Activewear, and International. Its extensive product catalog encompasses men's underwear, women's panties, children's underwear, socks, and various intimate apparel items such as bras and shapewear. Beyond foundational garments, Hanesbrands also offers activewear, T-shirts, fleece, performance apparel, sport shirts, teamwear, thermals, and specific home goods. Additionally, it sells licensed logo apparel through university bookstores, major retailers, and other outlets. The firm also extends its Champion brand via licenses for footwear and sports accessories. Hanesbrands markets its products under a vast array of well-known brand names, including Hanes, Champion, Maidenform, Bali, Playtex, DKNY, Bonds, Wonderbra, and many others. These items are distributed through a diverse network of retailers, wholesalers, and specialized embellishment partners. As of January 2, 2022, the company managed a substantial direct-to-consumer presence, operating 216 retail and outlet stores across the United States and Puerto Rico, complemented by 626 international retail locations. Its market reach is global, extending throughout Europe, Australia, Asia, Latin America, Canada, the Middle East, Africa, Mexico, and Brazil. Hanesbrands Inc. was established in 1901 and is headquartered in Winston-Salem, North Carolina.

Analyst Sentiment

56%
Buy

From 6 Active Polls

1Y Forecast: $7.25

▲ +12.1% Potential Upside

Consensus Target Metrics

Low Bound

$6

Median

$8

High Bound

$8

Average

$7

Price & Moving Averages

Loading chart...

🎯 Wall Street Analyst Intelligence Report

1-Year structural target targets, chart projections, and sentiment maps.

Average 1Y Target
$7.25
▲ +12.06% Upside
Low Target
$6.00
-7% Risk
Median Target
$7.50
16% Mid
High Target
$8.00
24% Max
Consensus
Buy
17 / 34 Buys

Consensus Trend Projection

Trailing closures vs. 12-month metrics map.

Analyst Vote Distribution

Aggregate institutional coverage sentiment weights.

📊 Historical Valuation Multiples

Real-time Trailing Twelve Month (TTM) momentum side-by-side with discrete quarterly metrics.

Fiscal QuarterTTMQ3 2025Q2 2025Q1 2025Q4 2024Q3 2024Q2 2024Q1 2024Q4 2023
Period EndingTrailing 12MSep 27, 2025Jun 28, 2025Mar 29, 2025Dec 28, 2024Sep 28, 2024Jun 29, 2024Mar 30, 2024Dec 30, 2023
Market Cap ($M)2,2892,3341,6322,0402,9042,5631,7352,0391,564
Enterprise Value ($M)4,7374,7824,0744,4945,2415,8195,0735,5794,980
Price to Earnings Ratio (P/E)6.622.175.01-113.58-56.2221.39-1.45-13.185.07
Price/Earnings-to-Growth Ratio (PEG)——0.16———-0.04—0.15
Price to Sales Ratio (P/S)0.872.621.652.683.652.741.742.741.21
Price to Book Ratio (P/B)5.135.239.8146.9485.3917.1626.946.033.73
Price to Free Cash Flow Ratio (P/FCF)-32.74104.8359.91-17.0847.0529.0924.58344.805.88
Enterprise Value to Sales (EV/Sales)—5.364.115.916.586.215.107.493.84
Enterprise Value to EBITDA (EV/EBITDA)13.9543.4126.1561.0350.2650.19-113.71108.4843.24
Debt to Equity Ratio7.215.9716.0060.5475.0223.9355.1411.038.59

📘 Full Research Report

ℹ️

AI-Generated Research: This report is for informational purposes only.

📘 HANESBRANDS INC (HBI) — Investment Overview

🧩 Business Model Overview

HanesBrands designs and markets apparel focused on everyday basics (intimates, socks, and related categories) and selected performance-driven items. The operating model blends branded product development with scale manufacturing and sourcing, then sells through both wholesale distribution (to department stores, mass retailers, and specialty channels) and direct-to-consumer routes for certain brand assortments.

Value capture occurs through controlling the end-to-end process: translating consumer needs into product and fit, converting those designs into high-volume output with predictable quality, and managing inventory and promotions across retail partners. Because product is replenished in recurring assortment cycles and retailers buy through ongoing programs, Hanes benefits from repeat purchasing within brands and retail listings, even though the business is not “contractually recurring” in a software-like sense.

💰 Revenue Streams & Monetisation Model

  • Wholesale brand and category sales: primary revenue stream, monetized via selling finished goods into retailer and distributor inventory cycles. Margin depends on gross margin management (input costs, freight, and product mix) and operating leverage from volume.
  • Direct-to-consumer (DTC) and e-commerce: incremental revenue with tighter merchandising control and potential margin support, though it introduces additional overhead (fulfillment, digital marketing, returns).
  • Licensing/royalty and partner programs (where applicable): adds monetization for certain brand uses and reduces manufacturing exposure on some product lines.

Key margin drivers are product mix (higher-value hosiery/intimates and differentiated offerings), cost efficiency (labor, sourcing, and logistics), and inventory discipline to limit markdown risk. Operating costs are meaningfully levered to throughput, making utilization and demand planning central to earnings quality.

🧠 Competitive Advantages & Market Positioning

HanesBrands’ moat is primarily rooted in cost advantages and retail distribution scale, supported by assortment execution and long-running relationships with major channel partners.

  • Cost & supply-chain scale (Cost Advantage): competitors face pressure when unable to match volume-driven sourcing terms, manufacturing efficiency, and freight/logistics discipline. In basic apparel, small differences in unit economics can compound across large throughput.
  • Distribution leverage (Switching Costs via retailer listing/program depth): once Hanes products are embedded in retailer assortments, replenishment cycles and re-listing frictions create practical friction for full substitution—especially where product fit, pack formats, and historical sell-through support reorder behavior.
  • Intimates category knowledge (Operational Intangibles): product development, sizing/fit know-how, and merchandising practices help reduce defect rates and markdowns, improving the effective margin on every unit sold.

Competitive benchmarking:

  • Gildan Activewear: a direct peer in mass-market basics with similar emphasis on scale production. Hanes’ focus tends to skew more toward branded intimates and channel relationships, while Gildan often emphasizes higher-volume activewear/basics mixes.
  • Fruit of the Loom: another well-established value/specialty basics competitor competing heavily on brand economics and retail programs. Hanes competes on breadth of assortments and brand execution, while both firms face sustained private-label competition.
  • Under Armour (performance apparel): competes for consumer spend in adjacent active/performance categories. However, the competitive frame differs: Hanes is more exposed to everyday replenishment and basics pricing, while Under Armour competes more on product performance identity and innovation cycles.

Overall, Hanes operates in a structurally competitive landscape, but scale and execution in distribution-heavy channels can support resilient unit economics when input costs and inventory management are handled effectively.

🚀 Multi-Year Growth Drivers

  • Category tailwinds within intimates and socks: steady demand for replenishable apparel creates a durable base, with growth potential from mix shifts toward more comfortable, functional, and longer-wearing products.
  • Higher-value assortment mix: expanding within existing core categories (e.g., premium fabrications, multipacks, and differentiated silhouettes) can lift gross margin without requiring a new business model.
  • DTC/channel mix improvement: increasing DTC penetration where economics support it can improve merchandising control and reduce reliance on wholesale promotional intensity.
  • Market share gains through retailer program execution: disciplined product planning, reliable supply, and sell-through-driven replenishment can translate to expanded store doors and program depth.
  • Operational efficiency: supply-chain optimization, procurement discipline, and manufacturing productivity improvements can expand operating margins even when category growth is modest.

⚠ Risk Factors to Monitor

  • Input cost volatility: cotton and synthetic fiber cost swings can pressure gross margins if pricing power does not offset costs or if hedging/contracting discipline is insufficient.
  • Promotional intensity and retailer bargaining power: apparel basics face frequent promotional cycles; large retailer customers can compress margins through pricing demands and inventory terms.
  • Inventory and markdown risk: incorrect demand forecasting can lead to lower realized pricing and higher clearance expense, impairing cash flow.
  • Private-label substitution: private labels can erode brand economics, particularly if consumers prioritize price over differentiation.
  • Leverage and fixed-cost burden: capital structure and benefit obligations can amplify earnings sensitivity to margin compression.
  • Regulatory and sustainability compliance: evolving environmental and materials regulations can raise compliance costs and affect sourcing or product formulations.

📊 Valuation & Market View

The market typically values apparel manufacturers on EV/EBITDA and operating margin durability, with close attention to gross margin stability, cash conversion, and net leverage. Key valuation drivers include the sustainability of unit economics through the input-cost cycle, the ability to protect pricing during promotional periods, and evidence of disciplined inventory management.

Because growth is more mix- and execution-driven than purely category-expansion-driven, improvements in operating leverage and cash flow generation often carry outsized influence on valuation sentiment relative to top-line growth rates.

🔍 Investment Takeaway

HanesBrands is a scale-driven apparel company competing in a high-volume, promotion-sensitive category where cost advantage and distribution program depth help sustain market presence. The long-term investment case rests on maintaining margin discipline through input-cycle management, protecting assortment quality to limit markdown risk, and selectively improving channel mix and product mix to raise realized profitability despite persistent private-label and wholesale price pressure.


⚠ AI-generated — informational only. Validate using filings before investing.

📰 Market News & Coverage

15 Stories Available

Real-time institutional reporting and market updates for HBI.

businesswire.com•2026-07-31

PRIMERICA HOUSEHOLD BUDGET INDEX™ (HBI™): Purchasing Power for Middle-Income Americans Saw Modest Gains in June as Gas Prices Fell

DULUTH, Ga.--(BUSINESS WIRE)--The latest Primerica Household Budget Index™ (HBI™) data, a monthly economic metric that examines how inflation and wage trends impact the ability of middle-income families to afford life's everyday necessities, is estimated at 100.1% in June, up 1.8% from May and up 0.2% from a year ago. The increase in purchasing power was driven primarily by lower gas prices in June. Small declines in health care costs and modest reductions in auto insurance rates also contribut.

gurufocus.com•2026-07-31

PRIMERICA HOUSEHOLD BUDGET INDEX™ (HBI™): Purchasing Power for Middle-Income Americans Saw Modest Gains in June as Gas Prices Fell

The latest Primerica Household Budget Index™ (HBI™) data, a monthly economic metric that examines how inflation and wage trends impact the ability of middle

gurufocus.com•2026-06-30

PRIMERICA HOUSEHOLD BUDGET INDEX™ (HBI™): Gas Prices Continued to Weigh on Purchasing Power of Middle-Income Families in May

The latest Primerica Household Budget Index™ (HBI™) data, a monthly economic metric that examines how inflation and wage trends impact the ability of middl

businesswire.com•2026-05-28

PRIMERICA HOUSEHOLD BUDGET INDEX™ (HBI™): Rising Gas Prices Limit Purchasing Power of Middle-Income Americans in April

DULUTH, Ga.--(BUSINESS WIRE)--The latest Primerica Household Budget Index™ (HBI™) data, a monthly economic metric that examines how inflation and wage trends impact the ability of middle-income families to afford life's everyday necessities, is estimated at 99.4% in April, down 1.7% from March and 0.3% from a year ago. The decline is driven mainly by increasing gas prices, which rose 11% in the past month and 28% year-over-year. The Consumer Price Index (CPI), which measures inflation for a com.

gurufocus.com•2026-05-28

PRIMERICA HOUSEHOLD BUDGET INDEX™ (HBI™): Rising Gas Prices Limit Purchasing Power of Middle-Income Americans in April

The latest Primerica Household Budget Index™ (HBI™) data, a monthly economic metric that examines how inflation and wage trends impact the ability of middl

gurufocus.com•2026-02-11

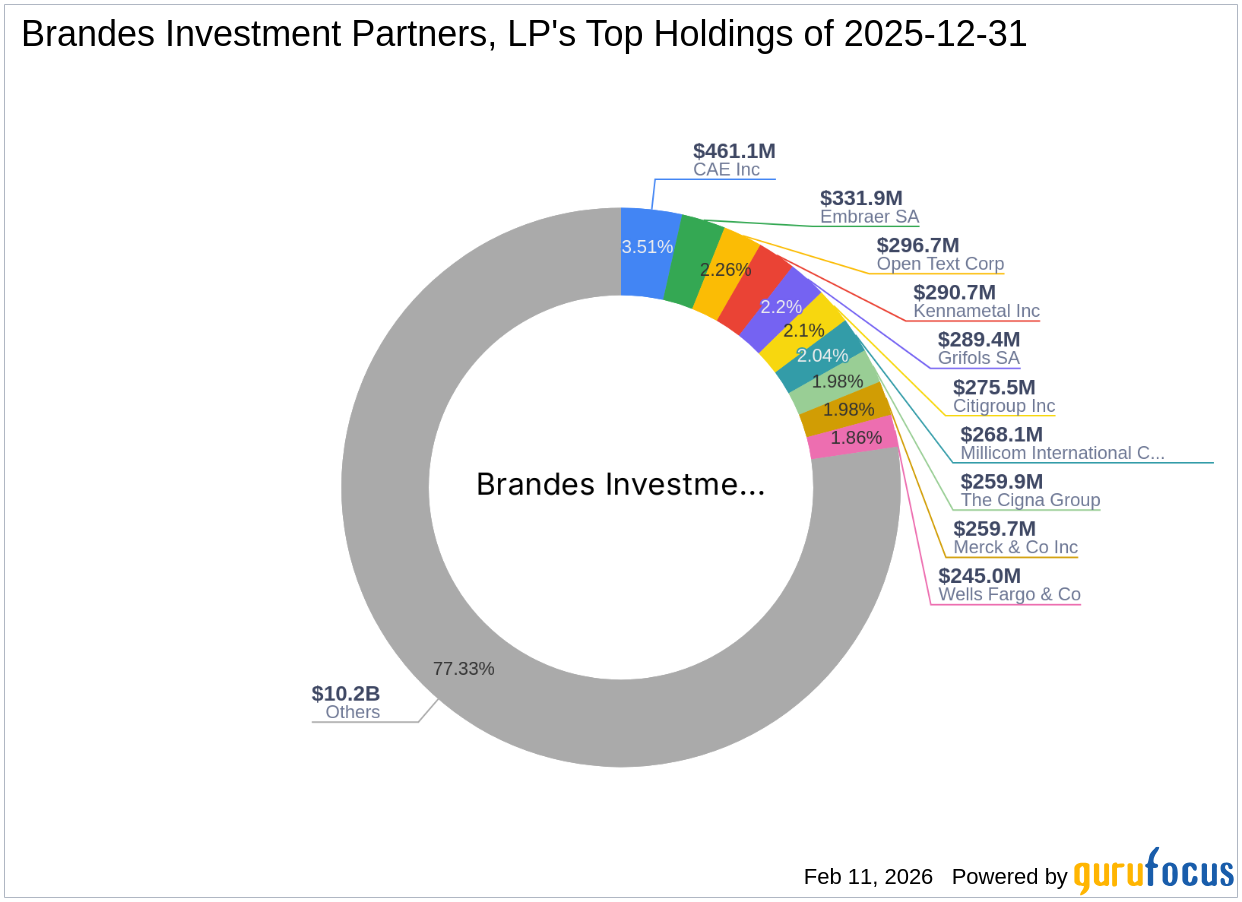
Brandes Investment Partners, LP's Strategic Moves: Progressive Corp Leads with 1.04% Portfolio Impact

Insightful Analysis of Brandes Investment Partners, LP (Trades, Portfolio)'s Fourth Quarter 2025 13F Filing Brandes Investment Partners, LP (Trades, Portfolio)

defenseworld.net•2025-12-19

Head-To-Head Survey: Hanesbrands (NYSE:HBI) & Ted Baker (OTCMKTS:TBAKF)

Ted Baker (OTCMKTS:TBAKF - Get Free Report) and Hanesbrands (NYSE: HBI - Get Free Report) are both consumer discretionary companies, but which is the superior stock? We will contrast the two businesses based on the strength of their valuation, risk, institutional ownership, dividends, profitability, analyst recommendations and earnings. Institutional and Insider Ownership 80.3% of Hanesbrands shares

defenseworld.net•2025-12-01

Hanesbrands Inc. $HBI Shares Bought by Barington Capital Group L.P.

Barington Capital Group L.P. grew its stake in Hanesbrands Inc. (NYSE: HBI) by 31.5% during the undefined quarter, according to the company in its most recent filing with the Securities and Exchange Commission. The institutional investor owned 2,502,100 shares of the textile maker's stock after purchasing an additional 599,600 shares during the period.

defenseworld.net•2025-12-01

Ensign Peak Advisors Inc Lowers Holdings in Hanesbrands Inc. $HBI

Ensign Peak Advisors Inc reduced its position in Hanesbrands Inc. (NYSE: HBI) by 28.3% in the second quarter, according to the company in its most recent filing with the Securities and Exchange Commission. The fund owned 142,268 shares of the textile maker's stock after selling 56,200 shares during the period. Ensign Peak Advisors

prnewswire.com•2025-11-24

Sandisk Set to Join S&P 500; Upwork, First Interstate BancSystem, PTC Therapeutics to Join S&P SmallCap 600

NEW YORK , Nov. 24, 2025 /PRNewswire/ -- S&P Dow Jones Indices will make the following changes to the S&P 500, S&P SmallCap 600:  S&P SmallCap 600 constituent Sandisk Corp. (NASD: SNDK) will replace The Interpublic Group of Companies Inc. (NYSE: IPG) in the S&P 500, and PTC Therapeutics Inc. (NASD: PTCT) will replace Sandisk in the S&P SmallCap 600 effective prior to the opening of trading on Friday, November 28. S&P 500 constituent Omnicom Group Inc. (NYSE: OMC) is acquiring The Interpublic Group of Companies in a deal expected to close soon, pending final conditions.

fool.com•2025-11-12

Neo Ivy Initiates Hanesbrands Position with 627,000 Share Buy

This is a new stake: 627,098 shares added; an estimated $4.13 million position. Hanesbrands is now 1% of reported 13F assets under management.

zacks.com•2025-11-07

Hanesbrands Q3 Earnings Miss Estimates, Sales Decline Y/Y

HBI's third-quarter results reflect lower sales and an earnings miss but highlight improved profits and cost savings.

businesswire.com•2025-11-06

HanesBrands Inc. Announces Third-Quarter 2025 Results

WINSTON-SALEM, N.C.--(BUSINESS WIRE)--HanesBrands Inc. (NYSE: HBI), a global leader in everyday iconic apparel, today announced results for the third-quarter 2025. “Our top-line results for the quarter reflect an unanticipated late quarter shift in replenishment orders at one of our large U.S. retail partners; however, we saw underlying fundamentals of our business continue to improve in the quarter. Our inventory position at retail is strong. We're encouraged by our unit point-of-sale trends,.

zacks.com•2025-11-05

Hanesbrands to Report Q3 Earnings: What Should Investors Expect?

HBI is set to post modest sales softness but improved profitability as cost cuts and efficiency gains are likely to have supported its Q3 performance.

defenseworld.net•2025-10-31

Cwm LLC Acquires 14,042 Shares of Hanesbrands Inc. $HBI

Cwm LLC boosted its holdings in shares of Hanesbrands Inc. (NYSE: HBI) by 73.9% during the second quarter, according to its most recent 13F filing with the Securities and Exchange Commission (SEC). The fund owned 33,032 shares of the textile maker's stock after acquiring an additional 14,042 shares during the quarter. Cwm LLC's

📊 AI Financial Analysis

Powered by StockMarketInfo
Earnings Data: Q Ending 2025-09-27

"HBI reported a revenue of $891.7M and a net income of $270.7M for the most recent quarter. With earnings per share (EPS) at $0.76, the company demonstrates solid profitability. However, the absence of free cash flow (FCF) indicates potential liquidity concerns, as does the significant net debt of approximately $2.45B against its total assets of $4.28B. The capital expenditures show a negative figure, suggesting that investment in growth could be challenging. Shareholder returns have been historically supplemented by dividends, but no dividends were paid in 2022, which may raise questions about future distributions. Currently, HBI's stock price performance is not available, as it shows a price of $0 and a one-year change marked as 'N/A'. Overall, while HBI shows profitability and moderate revenue growth, its liquidity and leverage may be drawbacks for investors looking for stability. Therefore, investor evaluation should consider these factors carefully."

Revenue Growth

Neutral

Revenue of $891.7M indicates substantial growth.

Profitability

Positive

Strong net income of $270.7M reflects good profitability.

Cash Flow Quality

Fair

Free cash flow is positive yet minimal, indicating cash management issues.

Leverage & Balance Sheet

Caution

High net debt compared to equity raises concerns.

Shareholder Returns

Neutral

No recent dividends paid may deter income-focused investors.

Analyst Sentiment & Valuation

Fair

Price targets suggest potential upside, but sentiment is mixed.

Disclaimer:This analysis is AI-generated for informational purposes only. Accuracy is not guaranteed and this does not constitute financial advice.

Fundamentals Overview

Loading fundamentals overview...

Hanesbrands entered Q2 2025 with measurable operating momentum: operating margin up 255 bps to 15.5% and EPS up 60% to $0.24, supported by a 145 bps gross margin gain and an 110 bps SG&A leverage improvement (SG&A down 2% YoY). Management translated this into a more confident outlook, raising full-year targets to ~$3.53B sales, ~$485M operating profit (+17%), and ~$0.66 EPS (+65%), citing visibility into back-half cost and cost savings. However, the Q&A shows real operational and market friction pockets. Tariff risk is acknowledged with the key timing clarified—cost impacts largely in Q4 due to inventory dynamics—requiring mitigation through surgical pricing, cost actions, and exempt U.S. content. In intimates, weakness is concentrated: Maidenform/shapewear exposure is being “pivoted” toward broader T-shirt bras and mass/online. Net: management tone is upbeat and confident, but analyst pressure highlights specific execution hurdles—tariff timing and Maidenform turnaround—rather than broad-based category resilience.

AI IconGrowth Catalysts

  • Low single-digit growth in basics
  • Nearly 30% growth in active
  • 165% growth in new businesses (scrubs and loungewear)
  • Expansion of Hanes Moves products
  • Hanes brand elevation via exclusive U.S. offering with Urban Outfitters
  • Hanes premium T-shirts offerings at specialty retailers in Japan
  • Absorbency category buildout in Australia and the U.S.
  • New category extensions: loungewear and scrubs
  • Improving POS trend: June better than May; July better than June

Business Development

  • Exclusive product offering with Urban Outfitters (U.S.)
  • Hanes premium T-shirts at specialty retailers in Japan
  • Exclusive printwear distributor arrangement with S&S (no terms disclosed)

AI IconFinancial Highlights

  • Q2 sales: $991M (+2% reported YoY).
  • Q2 operating profit: +22% YoY (vs prior year).
  • Q2 EPS: +60% YoY to $0.24.
  • Q2 gross margin: +145 bps YoY to 41.2%.
  • Q2 operating margin: +255 bps YoY to 15.5%.
  • Q2 SG&A: -2% YoY (down 110 bps as % of sales).
  • Q2 SG&A leverage improving sequentially: down 220 bps in Q1 vs down 110 bps in Q2.
  • Operating cash flow: $36M in the quarter.
  • Leverage: 3.3x net debt / adjusted EBITDA at Q2 end; 1.3x lower than prior year; approaching 2–3x target range.
  • Guidance Q3: sales ~$900M; operating profit ~$122M; EPS ~$0.16.
  • Raised full-year guidance: sales to ~$3.53B; operating profit to ~$485M (+17%); EPS to ~$0.66 (+65%).
  • Company cites full-year gross margin up 55 bps at this point (tailwind continuing).

AI IconCapital Funding

  • Paid down $1.5B of debt over the past year; reduced leverage by nearly 2.5 turns over past 2 years.
  • Interest expense tailwind cited as benefiting EPS growth in Q2 (no specific $ figure given).

AI IconStrategy & Ops

  • Restructuring/cost restructuring actions and productivity initiatives drove profit growth.
  • Productivity focus areas: assortment management; distribution center facilities; back-office/corporate support activities.
  • Supply chain streamlined while remaining diversified/balanced globally.
  • Advanced analytics + AI for inventory/assortment management and demand planning/forecasting.
  • International profit improvement approach: fixed-cost takeout across functions (not just U.S.); acknowledgment of heavier retail component internationally causing SG&A fixed-cost drag.
  • Q4 seasonality impact: expects improved international margins when more volume flows through DTC/retail.

AI IconMarket Outlook

  • Tariff cost timing: expects cost impact primarily in Q4 due to inventory/cost flow off balance sheet.
  • Tariff mitigation confidence: says it is built into the guide; expects to fully mitigate cost headwinds (short and long term) at rates experienced today.
  • POS cadence: June > May; July > June; still headwinds but improving momentum into 2H.

AI IconRisks & Headwinds

  • U.S. innerwear headwinds continue, especially intimates/shapewear exposure.
  • Intimates business down YoY; challenges attributed to Maidenform and shapewear exposure within intimates.
  • Competitive pressure from private label described as mixed: men's underwear private label down and company losing share; women's private label slightly up but branded strategy expected to win via investment/innovation/service.
  • Tariff risk: expects Q4 cost impact; mitigation relies on exempt U.S. content, supply chain balance, cost actions, and surgical pricing.
  • International margins face quarter-to-quarter fluctuation due to direct-to-consumer/retail fixed costs and seasonality.

Sentiment: MIXED

Note: This summary was synthesized by AI from the HBI Quarter and Year earnings transcript. Financial data is complex; please verify all metrics against official SEC filings before making investment decisions.

📋 Official Regulatory 10-K / 10-Q SEC Filings

Direct authenticated documentation links to audited SEC database reports for HBI.

SEC EDGAR Live Feed
No recent 10-K available.
No recent 10-Q available.
Loading financial data and tables...
📁

SEC Filings (HBI)

© 2026 Stock Market Info — Hanesbrands Inc. (HBI) Financial Profile