Hawaiian Electric Industries, Inc.

Hawaiian Electric Industries, Inc. (HE) Market Cap

Hawaiian Electric Industries, Inc. has a market capitalization of $2.31B.

Price: $13.38

-0.01 (-0.04%)

Market Cap: 2.31B

NYSE · time unavailable

CEO: Scott W. H. Seu

Sector: Utilities

Industry: Diversified Utilities

IPO Date: 1964-07-18

Website: https://www.hei.com

Hawaiian Electric Industries, Inc. (HE) - Company Information

Market Cap: 2.31B|Sector: Utilities

Company Profile

Hawaiian Electric Industries, Inc. (HE) operates as a diversified holding company primarily focused on three key areas within the state of Hawaii: electric utility services, banking, and investments in renewable and sustainable infrastructure. The company's Electric Utility division is responsible for the generation, acquisition, transmission, distribution, and sale of electricity across several Hawaiian islands, including Oahu, Hawaii, Maui, Lanai, and Molokai. This segment utilizes and explores various clean energy sources, such as wind, solar, photovoltaic, geothermal, wave, hydroelectric, municipal waste, and other biofuels. Its customer base includes suburban communities, resort properties, United States armed forces installations, and agricultural operations. Through its Bank segment, the company runs a community financial institution that provides a full spectrum of banking and financial offerings to both consumers and businesses. These services include savings and checking accounts, along with a wide range of loans, encompassing residential and commercial real estate, mortgages, construction and development, multifamily residential and commercial real estate, consumer, and general commercial lending. This banking arm maintains a network of 42 branches throughout the islands: 29 on Oahu, 6 on Maui, 4 on Hawaii, 2 on Kauai, and 1 on Molokai. The "Other" segment is dedicated to strategic investments in non-regulated renewable energy and sustainable infrastructure projects exclusively within the Hawaiian Islands. Founded in 1891, Hawaiian Electric Industries Inc. maintains its corporate headquarters in Honolulu, Hawaii.

Analyst Sentiment

39%
Underperform

From 3 Active Polls

1Y Forecast: $12.75

▼ -4.7% Potential Upside

Consensus Target Metrics

Low Bound

$13

Median

$13

High Bound

$13

Average

$13

Price & Moving Averages

Loading chart...

🎯 Wall Street Analyst Intelligence Report

1-Year structural target targets, chart projections, and sentiment maps.

Average 1Y Target
$12.75
▼ -4.67% Upside
Low Target
$12.50
-7% Risk
Median Target
$12.75
-5% Mid
High Target
$13.00
-3% Max
Consensus
Hold
0 / 13 Buys

Consensus Trend Projection

Trailing closures vs. 12-month metrics map.

Analyst Vote Distribution

Aggregate institutional coverage sentiment weights.

📊 Historical Valuation Multiples

Real-time Trailing Twelve Month (TTM) momentum side-by-side with discrete quarterly metrics.

Fiscal QuarterTTMQ1 2026Q4 2025Q3 2025Q2 2025Q1 2025Q4 2024Q3 2024Q2 2024
Period EndingTrailing 12MMar 31, 2026Dec 31, 2025Sep 30, 2025Jun 30, 2025Mar 31, 2025Dec 31, 2024Sep 30, 2024Jun 30, 2024
Market Cap ($M)2,3092,5622,1231,9061,8341,8891,1741,107902
Enterprise Value ($M)2,5222,7754,1013,8733,7663,9643,2623,8234,232
Price to Earnings Ratio (P/E)17.8221.0312.8315.2617.2617.39-4.33-2.66-0.17
Price/Earnings-to-Growth Ratio (PEG)6.672.5855.310.33-0.15-0.41
Price to Sales Ratio (P/S)0.753.432.632.412.462.542.411.181.13
Price to Book Ratio (P/B)1.411.561.321.191.171.230.780.690.81
Price to Free Cash Flow Ratio (P/FCF)52.19-60.27102.81302.7330.66-51.2223.0313.93-80.45
Enterprise Value to Sales (EV/Sales)3.725.094.905.055.336.704.075.32
Enterprise Value to EBITDA (EV/EBITDA)4.5320.6228.1327.6827.6127.7422.18-79.76-2.67
Debt to Equity Ratio0.380.411.841.871.642.072.202.413.48
⚠️

Valuation Model Suspended

API Payload Error: Inverted or negative baseline Free Cash Flow margin detected (-5.1%).

Troubleshooting Notice: The upstream financial data supplier has uploaded corrupted or inverted baseline metrics for HE. The server sandbox cannot calculate an intrinsic value path from negative cash generation baselines.

📘 Full Research Report

ℹ️

AI-Generated Research: This report is for informational purposes only.

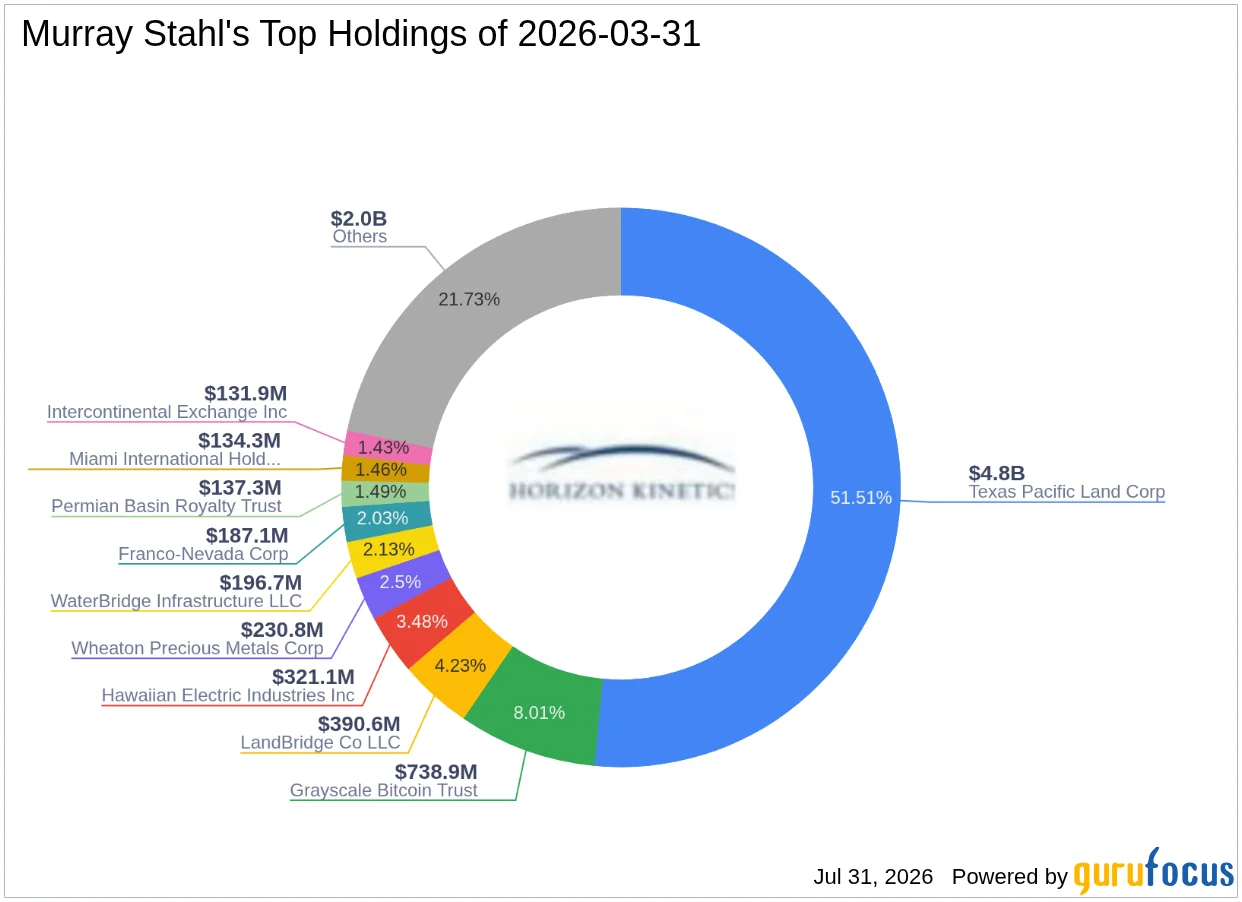
📘 HAWAIIAN ELECTRIC INDUSTRIES INC (HE) — Investment Overview

🧩 Business Model Overview

Hawaiian Electric Industries operates an investor-owned electric utility serving customers across Hawaii. The value chain centers on owning and maintaining the regulated distribution and transmission network, purchasing generation and fuel, and delivering electricity through a constrained island grid. Revenues are generated largely through regulated tariffs that compensate the utility for the cost of providing service plus an allowed return on invested capital (the “rate base”).

Customer stickiness is structurally high: electricity service is effectively tied to the utility territory and physical grid access, creating “switching costs” that are operational rather than contractual. The utility’s economics depend on (1) regulatory-approved cost recovery and (2) execution of capital programs that expand/modernize the grid and support reliability and decarbonization.

💰 Revenue Streams & Monetisation Model

Revenue monetization is predominantly recurring and regulation-driven:

  • Regulated retail electricity revenue: Tariff-based charges for service, capacity, and distribution. Core margin opportunity is linked to how efficiently operating costs are controlled and how effectively capital expenditures are incorporated into the rate base.
  • Fuel and purchased power components: Many jurisdictions use pass-through mechanisms that align revenue with changes in fuel and power purchase costs, reducing (but not eliminating) exposure to commodity volatility.
  • Other regulated utility services: Non-core but recurring items related to delivery service and permitted programs.

Primary margin drivers are (i) regulatory outcomes (allowances/disallowances, depreciation and return on equity assumptions), (ii) capital program execution (timeliness and prudent capex that earns recovery), and (iii) disciplined operations (O&M efficiency and reliability performance that affects regulatory proceedings).

🧠 Competitive Advantages & Market Positioning

Hawaiian Electric’s moat is best described as a combination of territory/regulatory franchise and high switching costs tied to network ownership:

  • High switching costs (network dependency): Customers generally cannot “switch” electric distribution providers without fundamental grid access changes, so demand is unusually stable relative to competitive retail models.
  • Regulatory moat: Rate-setting frameworks can allow recovery of costs and a permitted return, supporting long-lived cash flows when execution and compliance are strong.
  • Grid infrastructure and operating experience: Expertise in island grid operations, maintenance planning, and reliability practices is difficult to replicate quickly, and delays can create service and regulatory consequences.

Competitive benchmarking:

  • Duke Energy (Duke Energy, regulated electric utility scale): Competes in a mainland footprint with different cost structures and grid characteristics; Duke benefits from broader interconnection options and generally different logistics and demand density.
  • NextEra Energy (FPL and other utility operations, regulated generation & distribution): Operates large-scale regulated and contracted generation/distribution assets; its scale and mainland supply chain lower unit cost pressures versus island systems.
  • PG&E (regulated utility in California): Faces intensive regulatory and wildfire-related challenges similar in theme (safety/reliability, capex scrutiny), though the operational context differs by geography.

Compared with these peers, Hawaiian Electric’s “market focus” is a smaller, geographically constrained service territory. The moat comes from operating within that regulated territory and meeting reliability and decarbonization requirements rather than from competitive product differentiation.

🚀 Multi-Year Growth Drivers

Over a 5–10 year horizon, growth is driven less by volume expansion and more by rate base growth and grid modernization:

  • Decarbonization transition: Integration of renewable generation, grid-forming resources, storage, and balancing solutions to meet clean energy targets while maintaining reliability.
  • Reliability and resilience capital programs: Incremental capex tied to aging assets, system hardening, and improved operational performance—capital that can translate into recoverable rate base when approved and prudently executed.
  • Electrification of end uses: Higher electricity demand from transport and building electrification can support load growth, subject to rate design and economic conditions.
  • Operational efficiency and technology upgrades: Advanced grid controls, maintenance planning, and system analytics that reduce outage risk and operating costs.

The key takeaway is that, in regulated utilities, the durable “growth engine” is the combination of credible capital planning plus regulatory mechanisms that allow cost recovery for prudent investments.

⚠ Risk Factors to Monitor

  • Regulatory execution risk: Disallowances, slower recovery, or adverse rate-setting outcomes can compress returns and delay cash flows.
  • Capital intensity and cost overruns: Grid hardening, reliability work, and clean-energy integration require sustained investment; execution risk can affect both earnings and the pace of rate base recovery.
  • Natural disaster and extreme weather risk: Island systems face heightened exposure to storms and environmental events, with operational and financial implications.
  • Fuel/purchased power volatility exposure (to the extent not fully pass-through): While mechanisms exist to manage commodity risk, timing mismatches and regulatory formulas may still create earnings variability.
  • Leverage and credit/financing risk: Utilities are sensitive to interest rates and access to capital; weaker credit metrics can increase financing costs and constrain program execution.
  • Decarbonization integration risk: Challenges in interconnection, curtailment, and system stability can raise costs or require additional investment to maintain performance.

📊 Valuation & Market View

Market valuation for regulated utilities typically anchors to cash flow visibility, allowed returns, and rate base growth rather than high-growth multiples. The sector is often discussed using EV/EBITDA or P/E-type frameworks, but the practical drivers that move value include:

  • Rate-setting outcomes: Stability of regulatory assumptions (allowed ROE, depreciation, and cost recovery timing).
  • Rate base and capex productivity: The ability to translate investments into recoverable, value-accretive capacity and reliability improvements.
  • Interest rates and credit spreads: Financing costs affect earnings power and the economics of capital programs.
  • Reliability and compliance track record: Operational performance can influence future regulatory proceedings.

In institutional practice, investors often focus on whether the utility can sustain a favorable balance between prudently incurred costs and earned returns within the regulatory framework.

🔍 Investment Takeaway

Hawaiian Electric’s long-term thesis rests on a structurally defensible position as a regulated electricity provider with high switching costs and a regulatory framework that can support recurring cash flows. The main question for durable value creation is execution: translating substantial grid modernization and decarbonization-related capex into recoverable rate base while maintaining reliability and navigating regulatory cost recovery.


⚠ AI-generated — informational only. Validate using filings before investing.

📰 Market News & Coverage

15 Stories Available

Real-time institutional reporting and market updates for HE.

247wallst.com2026-06-01

From Bond Proxy to Battleground: Why Utilities Are the Worst Hiding Spot in 2026

The defensive utility trade is breaking. With the 10-year Treasury yield at 4.45% and near the 91.1 percentile of its trailing 12-month range, the “bond proxy” argument that long anchored retirement portfolios in regulated power names has lost its math.

fool.com2026-05-18

What This Fund’s $34 Million Hawaiian Electric Buy Could Signal for Utility Investors

Hawaiian Electric delivers regulated utility and banking services across Hawaii, with a growing focus on renewable energy initiatives.

benzinga.com2026-05-13

Top 3 Utilities Stocks That May Rocket Higher in May

The most oversold stocks in the utilities sector presents an opportunity to buy into undervalued companies.

seekingalpha.com2026-05-11

Hawaiian Electric Industries, Inc. (HE) Q1 2026 Earnings Call Transcript

Hawaiian Electric Industries, Inc. (HE) Q1 2026 Earnings Call Transcript

marketbeat.com2026-05-10

Hawaiian Electric Industries Q1 Earnings Call Highlights

Hawaiian Electric Industries NYSE: HE said it entered 2026 in a “year of transition” after finalizing the Maui wildfire tort settlement and moving forward with a rate rebasing proposal designed to support utility investment while moderating customer bill impacts.

businesswire.com2026-05-08

HEI Reports First Quarter 2026 Results

HONOLULU--(BUSINESS WIRE)--Hawaiian Electric Industries, Inc. (NYSE - HE) (HEI) today reported net income for the first quarter of 2026 of $30 million, or $0.18 per share, compared to net income of $27 million, or $0.15 per share in the first quarter of 2025. Excluding Maui wildfire-related expenses and expenses taken in connection with the review of strategic options for Pacific Current, Core1 net income was $31 million, or $0.18 per share, compared to $40 million, or $0.23 per share in 2025.

defenseworld.net2026-04-24

Comparing AES (NYSE:AES) and Hawaiian Electric Industries (NYSE:HE)

AES (NYSE: AES - Get Free Report) and Hawaiian Electric Industries (NYSE: HE - Get Free Report) are both utilities companies, but which is the better stock? We will compare the two companies based on the strength of their institutional ownership, risk, valuation, analyst recommendations, earnings, dividends and profitability. Volatility and Risk AES has a beta of

defenseworld.net2026-04-22

Eagle Global Advisors LLC Sells 246,210 Shares of Hawaiian Electric Industries, Inc. $HE

Eagle Global Advisors LLC reduced its stake in Hawaiian Electric Industries, Inc. (NYSE: HE) by 23.5% during the undefined quarter, according to its most recent 13F filing with the Securities and Exchange Commission. The fund owned 799,640 shares of the utilities provider's stock after selling 246,210 shares during the period. Eagle Global Advisors

defenseworld.net2026-04-19

Yousif Capital Management LLC Takes Position in Hawaiian Electric Industries, Inc. $HE

Yousif Capital Management LLC bought a new stake in Hawaiian Electric Industries, Inc. (NYSE: HE) during the fourth quarter, according to the company in its most recent Form 13F filing with the Securities and Exchange Commission. The institutional investor bought 46,257 shares of the utilities provider's stock, valued at approximately $569,000. A number

defenseworld.net2026-04-07

Hawaiian Electric Industries (NYSE:HE) Shares Pass Above 200 Day Moving Average – Should You Sell?

Shares of Hawaiian Electric Industries, Inc. (NYSE: HE - Get Free Report) crossed above its two hundred day moving average during trading on Monday. The stock has a two hundred day moving average of $13.26 and traded as high as $15.44. Hawaiian Electric Industries shares last traded at $15.4050, with a volume of 1,159,989 shares.

businesswire.com2026-04-06

Hawaiian Electric Industries to Announce First Quarter 2026 Results May 8

HONOLULU--(BUSINESS WIRE)--Hawaiian Electric Industries, Inc. (HEI) (NYSE - HE) will announce its first quarter 2026 financial results on Friday, May 8 and conduct a webcast and conference call to discuss the results at 10:30 a.m. Hawaii time (4:30 p.m. Eastern time).

fool.com2026-03-20

Hedge Fund Adds 1.9 Million Shares of Utility Stock, According to Latest SEC Filing

12 West Capital Management LP initiated a new stake in Hawaiian Electric Industries, adding 1,850,000 shares; estimated trade value is $22.75 million based on quarterly average pricing. Quarter-end position value increased by $22.75 million, reflecting both share purchases and stock price movement.

defenseworld.net2026-03-09

Citigroup Inc. Decreases Position in Hawaiian Electric Industries, Inc. $HE

Citigroup Inc. trimmed its position in Hawaiian Electric Industries, Inc. (NYSE: HE) by 47.2% during the undefined quarter, according to the company in its most recent filing with the Securities and Exchange Commission. The fund owned 169,719 shares of the utilities provider's stock after selling 151,487 shares during the period. Citigroup Inc. owned

seekingalpha.com2026-02-27

Hawaiian Electric Industries, Inc. (HE) Q4 2025 Earnings Call Transcript

Hawaiian Electric Industries, Inc. (HE) Q4 2025 Earnings Call Transcript

gurufocus.com2026-02-27

Market Today: OpenAI $110B, Block cuts, Nvidia record

Stock News Paramount tops Netflix for WBD: Warner Bros. Discovery (WBD) chose Paramount Skydance's (PSKY) $31-per-share bid over Netflix's (NFLX) $27.75 offer,

📊 AI Financial Analysis

Powered by StockMarketInfo
Earnings Data: Q Ending 2026-03-31

"Headline (2026-03-31, Q1): Revenue $746.4M; EPS $0.18; Net income $30.5M (net margin ~4.1%). YoY, revenue rose ~0.3% (vs. $744.1M in 2025-03-31) and net income increased ~12.2% (from $27.1M). QoQ, revenue declined ~7.4% (from $805.8M in 2025-12-31) and net income fell ~26.3% (from $41.4M). Margins contracted QoQ: net margin slipped from ~5.1% (Q4) to ~4.1% (Q1), while operating income and EBITDA also softened. Cash flow was weaker vs the prior quarter but still positive on operating cash flow: operating cash flow (OCF) was $64.9M, down from $106.4M in Q4, and free cash flow (FCF) was -$38.3M due to higher capex relative to operating cash (capex -$103.3M). The company did pay dividends (-$10.0M) and did not repurchase shares in Q1. On the balance sheet, total assets were stable at $8.91B. However, liquidity deteriorated meaningfully: cash fell to $452.8M from $980.7M. Equity rose to $1.64B and leverage appears lower than Q4, but liquidity reduction is the key near-term risk. Total shareholder returns appear strong given price momentum: the stock is up ~52.6% over the last year. Valuation context: price is above the provided fair-value/target-consensus level (~$12.75), implying limited upside unless results re-accelerate."

Revenue Growth

Neutral

YoY revenue was essentially flat at +0.3% ($746.4M vs. $744.1M). QoQ revenue declined -7.4% ($805.8M to $746.4M), suggesting short-term softness.

Profitability

Positive

YoY net income improved +12.2% (from $27.1M). QoQ profitability contracted: net income -26.3% and net margin slipped from ~5.1% (Q4) to ~4.1% (Q1).

Cash Flow Quality

Neutral

OCF stayed positive at $64.9M but fell from $106.4M QoQ. FCF turned negative (-$38.3M) on capex of -$103.3M. Dividends were paid (-$10.0M) and appear supported but not covered by Q1 FCF.

Leverage & Balance Sheet

Positive

Total assets were stable (~$8.91B vs. ~$8.92B). Equity increased to $1.64B. Net debt improved to ~$213M from very high Q4 levels, but cash dropped sharply to $452.8M (from $980.7M), reducing liquidity resilience.

Shareholder Returns

Strong

Strong momentum: price +52.6% over 1 year (>20% threshold). Dividend yield is low (~0.39%), and no buybacks occurred in Q1, but capital appreciation is clearly supportive.

Analyst Sentiment & Valuation

Neutral

Provided consensus target ($12.75) is below the current price ($15.79), indicating the stock is trading above the Street’s base case; sentiment may be supported by momentum but valuation appears stretched.

Disclaimer:This analysis is AI-generated for informational purposes only. Accuracy is not guaranteed and this does not constitute financial advice.

Fundamentals Overview

Loading fundamentals overview...

So What? HE’s Q1 2026 reflects transition from crisis management to execution of regulatory and infrastructure milestones. Net income rose, but core results declined as severe weather and higher O&M (including wildfire-insurance cost deferrals and storm response) pressured utility earnings. The key de-risking catalyst is the Maui settlement becoming fully effective April 10, enabling the first $479M payment and improving Moody’s outlook posture. On the growth/regulatory track, the PUC approved Waal repowering with $908M EPRM recovery, while management signaled a separate ~$247M incremental recovery likely to be sought in a future 2031 proceeding. Affordability and approvals remain central: the March 6 rate rebasing request proposes +~5.3% base rates, with PIMs totaling 200 bps (150 award/50 penalty), but analysts highlighted missing PUC procedural timelines. Fuel-price volatility is an ongoing headwind through working-capital lag and potential bad-debt impact if elevated oil persists.

AI IconGrowth Catalysts

  • Maui wildfire tort litigation settlement resolved: last subrogation insurer appeals withdrawn April 10; first of four $479M annual payments initiated
  • Waal Generating Station repowering project approved by PUC (late March): EPRM cost recovery totaling $908M (including $847M base cost plus inflation adjustment) and execution of contracts for 6 gas turbines (after April approval)
  • Rate rebasing stakeholder-driven nontraditional approach submitted March 6: base rates +~5.3% over two years to support safety/reliability investments ahead of 2027 rate reset
  • Wildfire Mitigation Plan update submitted April 13 for 2026-2027 (biennial updates thereafter starting 2027 covering 2-year periods)

Business Development

  • Ulupono Initiative: joint rate rebasing filing March 6 with Ulupono as intervenor/working group party in performance-based regulation
  • PUC (Public Utilities Commission): approval milestones for Waal repowering and Wildfire Mitigation Plan process

AI IconFinancial Highlights

  • Q1 2026 net income $30.5M ($0.18 EPS) vs $26.7M ($0.15 EPS) prior year; includes < $1M pretax Maui wildfire expenses net of insurance recoveries/deferrals vs ~$4.5M last year
  • Core consolidated net income/EPS: $31.0M/$0.18 vs $39.8M/$0.23 in Q1 2025 (decline primarily from utility core net income $35.7M vs $49.7M)
  • Utility net income decline driven by higher O&M: 35 days emergency response Feb-Mar heavy rains/wind; Kona Low flooding with estimated $2B damages and federal disaster declaration early April
  • Higher O&M also from higher insurance costs tied to deferral treatment of wildfire liability premiums in 2025
  • Higher interest expense: attributable to $500M high-yield debt issued September (holding company core net loss improved to -$4.8M from -$9.9M due to lower debt balance after April 2025 retirement)
  • Holding company liquidity: ~$10M unrestricted cash; utility unrestricted cash ~$437M; additional liquidity capacity includes ~$535M (holding company ATM/credit) and ~$518M (utility A/R ABL/credit)
  • Rating agency change: Moody’s upgraded utility to Ba1 from Ba2 and holding company to Ba2 from Ba3 following settlement finalization
  • Updated Waal CapEx forecast: ~$157M in 2026 vs prior ~$90M
  • Waal incremental unrecovered recovery target: projected incremental amount to seek recovery after in-service totals $247M (EPRM currently approved amount $908M; commission confirmed recovery may be sought above approved in future proceeding, potentially 2031)
  • PIMs in rebasing proposal: total 200 bps available (150 bps award potential, 50 bps penalty potential)

AI IconCapital Funding

  • Maui settlement payments: first $479M paid April 10 using funds set aside in special purpose vehicle; next payments expected in April 2027, 2028, 2029
  • Funding approach: second settlement payment expected funded with debt and/or convertible debt; later payments with mix of debt/equity based on market conditions; target investment-grade credit metrics
  • Capital structure update: no explicit buyback or new debt amounts disclosed in Q&A; mention of $500M high-yield debt issued last September (affects interest expense in Q1)
  • Liquidity available at quarter end: almost $1B total (cash + senior credit facility $300M + AR ABL facility ~ $250M capacity; ~ $218M based on A/R at time)

AI IconStrategy & Ops

  • Affordability actions starting April 6: interest-free payment plans up to 6 months and $50 bill credits for customers in diesel-reliant areas
  • Fuel cost pass-through exists but working-capital impact from payment lag: fuel paid based on daily average prices of prior month; rate recovery impacts typically lag 1-2 months
  • Operating cost outlook for 2026: O&M increase expected to outpace inflation due to higher insurance premiums, storm response, vegetation management, higher overhauls/station maintenance, IT/cyber defenses, and labor/benefits
  • Fuel cost risk sharing mechanism (FCRS): expect maximum penalty (penalty recorded as revenue reduction) given procured fuel costs above benchmarks (provided in appendix)
  • Waal repowering execution: post- April PUC approval, contracts executed for purchase of 6 gas turbines to secure production slots and reduce exposure to non-tariff price increases

AI IconMarket Outlook

  • Rebasing proposal: increase consolidated base rates approximately 5.3% phased over 2 years; estimated average customer bill impact $8-$12 in 2027 and additional $2-$3 in 2028
  • PUC procedural timeline: PUC has not issued formal schedule; management expects commission guidance and a certification step for compliance with the order enabling the proposal; guidance sought
  • Wildfire Mitigation Plan: first update filed April 13 covering 2026-2027; subsequent updates every other year starting 2027 covering 2-year period

AI IconRisks & Headwinds

  • Fuel price volatility: sharp rise since late February increases working capital needs due to payment lag despite pass-through; elevated write-offs may increase bad debt expense
  • Bad debt sensitivity: in COVID/Ukraine-Russia period write-off percentage peaked at ~51 bps vs typical 10-20 bps; current risk depends on duration of elevated fuel prices
  • Regulatory uncertainty: PUC procedural schedule and approval timing for rate rebasing not yet defined; PIM design achievability and stakeholder/commission negotiations ongoing
  • Cost overhang risk for Waal: commission-approved EPRM amount excludes inflation/cost movements beyond current assumptions; management expects project costs to exceed approved amount and may seek incremental recovery later
  • Storm-driven O&M pressure: severe weather Feb-Mar required 35 days emergency response and drove higher insurance and vegetation management costs
  • Wildfire liability cap and recovery fund: remains a key rating-agency focus; not yet formally actioned by PUC in rulemaking

Q&A: Analyst Interest

  • Rate rebasing phasing and procedural timetable: Management confirmed no change to proposed 2027/2028 phasing but said the PUC has not provided a procedural schedule. They noted the proposal is novel, require public input steps, and await commission certification and further guidance on review process.
  • Waal incremental recovery gap and interaction with current rebasing: Analysts asked about carrying costs for the ~$247M incremental amount targeted around 2031 and whether it affects the current rebasing. Management stated no interaction because Waal isn’t in service, recovery is via separate mechanisms, and AFUDC accrues at ~7.37% weighted average cost of capital during construction.
  • PIMs achievability and design updates in rebasing proposal: Management stated PIMs are under active stakeholder and commission discussion to adjust design so targets are within management control with clear baselines. They emphasized “lessons learned” from the prior framework and a goal of meaningful, reasonably achievable incentives.

Sentiment: MIXED

Note: This summary was synthesized by AI from the HE Q1 2026 earnings transcript. Financial data is complex; please verify all metrics against official SEC filings before making investment decisions.

📋 Official Regulatory 10-K / 10-Q SEC Filings

Direct authenticated documentation links to audited SEC database reports for HE.

SEC EDGAR Live Feed
Loading financial data and tables...
📁

SEC Filings (HE)

© 2026 Stock Market Info — Hawaiian Electric Industries, Inc. (HE) Financial Profile