The Interpublic Group of Companies, Inc.

The Interpublic Group of Companies, Inc. (IPG) Market Cap

The Interpublic Group of Companies, Inc. has a market capitalization of $8.93B.

Price: $24.57

-0.49 (-1.96%)

Market Cap: 8.93B

NYSE · time unavailable

CEO: Philippe Krakowsky

Sector: Communication Services

Industry: Advertising Agencies

IPO Date: 1980-03-17

Website: https://www.interpublic.com

The Interpublic Group of Companies, Inc. (IPG) - Company Information

Market Cap: 8.93B|Sector: Communication Services

Company Profile

The Interpublic Group of Companies, Inc. provides advertising and marketing services worldwide. It operates in two segments, Integrated Agency Networks (IAN) and IPG DXTRA. The company offers consumer advertising, digital marketing, communications planning and media buying, public relations, and specialized communications disciplines, as well as data science services. It also provides various diversified services, including meeting and event production, sports and entertainment marketing, corporate and brand identity, and strategic marketing consulting. The company was formerly known as McCann-Erickson Incorporated and changed its name to The Interpublic Group of Companies, Inc. in January 1961. The Interpublic Group of Companies, Inc. was founded in 1902 and is headquartered in New York, New York.

Analyst Sentiment

83%
Strong Buy

From 8 Active Polls

1Y Forecast: $36.57

▲ +48.8% Potential Upside

Consensus Target Metrics

Low Bound

$26

Median

$36

High Bound

$56

Average

$37

Price & Moving Averages

Loading chart...

🎯 Wall Street Analyst Intelligence Report

1-Year structural target targets, chart projections, and sentiment maps.

Average 1Y Target
$36.57
▲ +48.84% Upside
Low Target
$26.00
6% Risk
Median Target
$36.00
47% Mid
High Target
$56.00
128% Max
Consensus
Hold
15 / 34 Buys

Consensus Trend Projection

Trailing closures vs. 12-month metrics map.

Analyst Vote Distribution

Aggregate institutional coverage sentiment weights.

📊 Historical Valuation Multiples

Real-time Trailing Twelve Month (TTM) momentum side-by-side with discrete quarterly metrics.

Fiscal QuarterTTMQ3 2025Q2 2025Q1 2025Q4 2024Q3 2024Q2 2024Q1 2024Q4 2023
Period EndingTrailing 12MSep 30, 2025Jun 30, 2025Mar 31, 2025Dec 31, 2024Sep 30, 2024Jun 30, 2024Mar 31, 2024Dec 31, 2023
Market Cap ($M)8,92810,1879,00610,11710,51311,82610,56712,29812,449
Enterprise Value ($M)11,54112,80111,62612,45412,58114,57713,35314,98814,734
Price to Earnings Ratio (P/E)16.2619.5913.86-29.627.63147.1012.3227.856.72
Price/Earnings-to-Growth Ratio (PEG)1.500.881.440.52
Price to Sales Ratio (P/S)0.874.083.554.363.684.503.904.934.12
Price to Book Ratio (P/B)2.452.792.432.822.773.172.753.223.16
Price to Free Cash Flow Ratio (P/FCF)11.0766.32-73.94-172.9412.6163.41123.01-63.8914.77
Enterprise Value to Sales (EV/Sales)5.134.585.364.405.554.936.004.87
Enterprise Value to EBITDA (EV/EBITDA)9.2642.7335.26745.7420.9363.4631.9051.9319.63
Debt to Equity Ratio2.101.131.131.171.121.151.131.211.18

📘 Full Research Report

ℹ️

AI-Generated Research: This report is for informational purposes only.

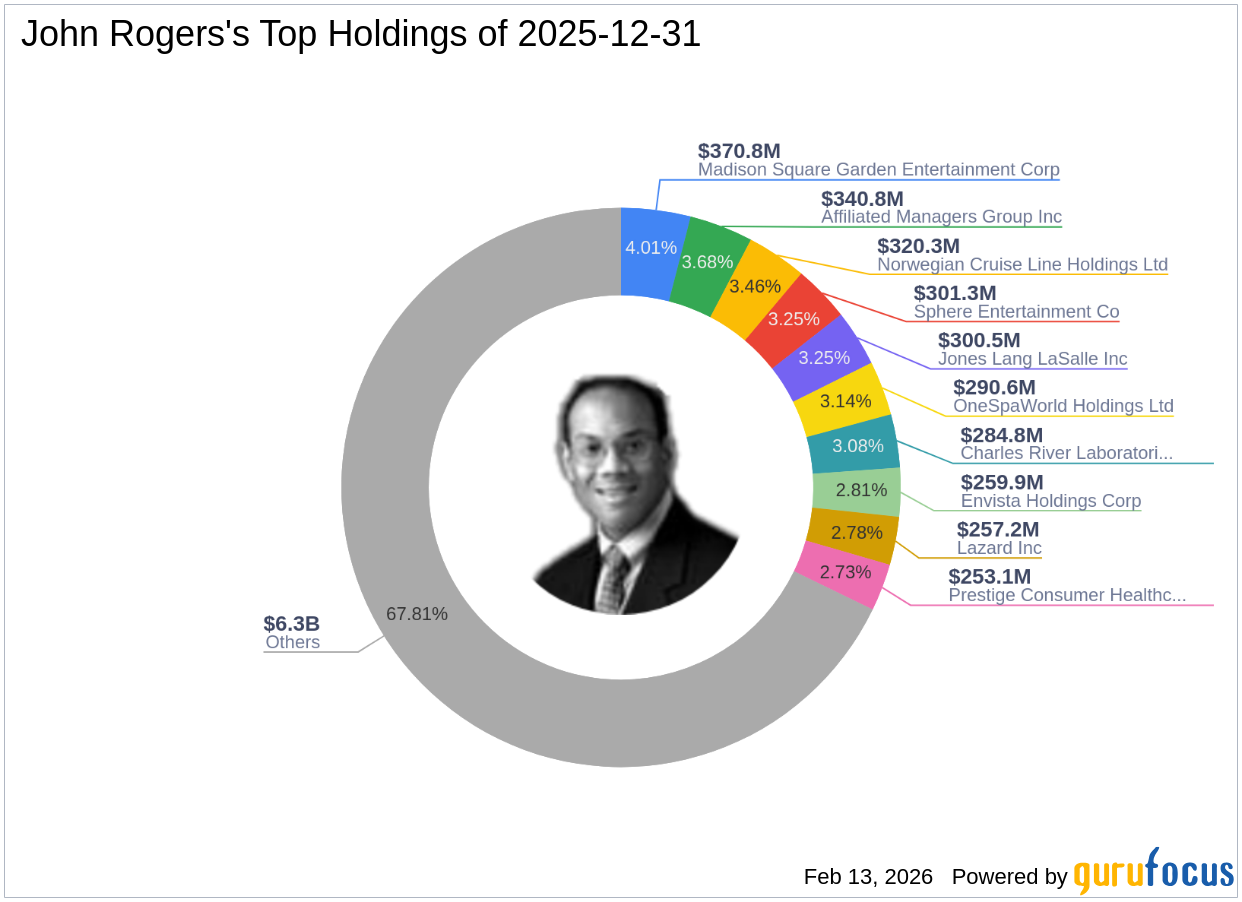
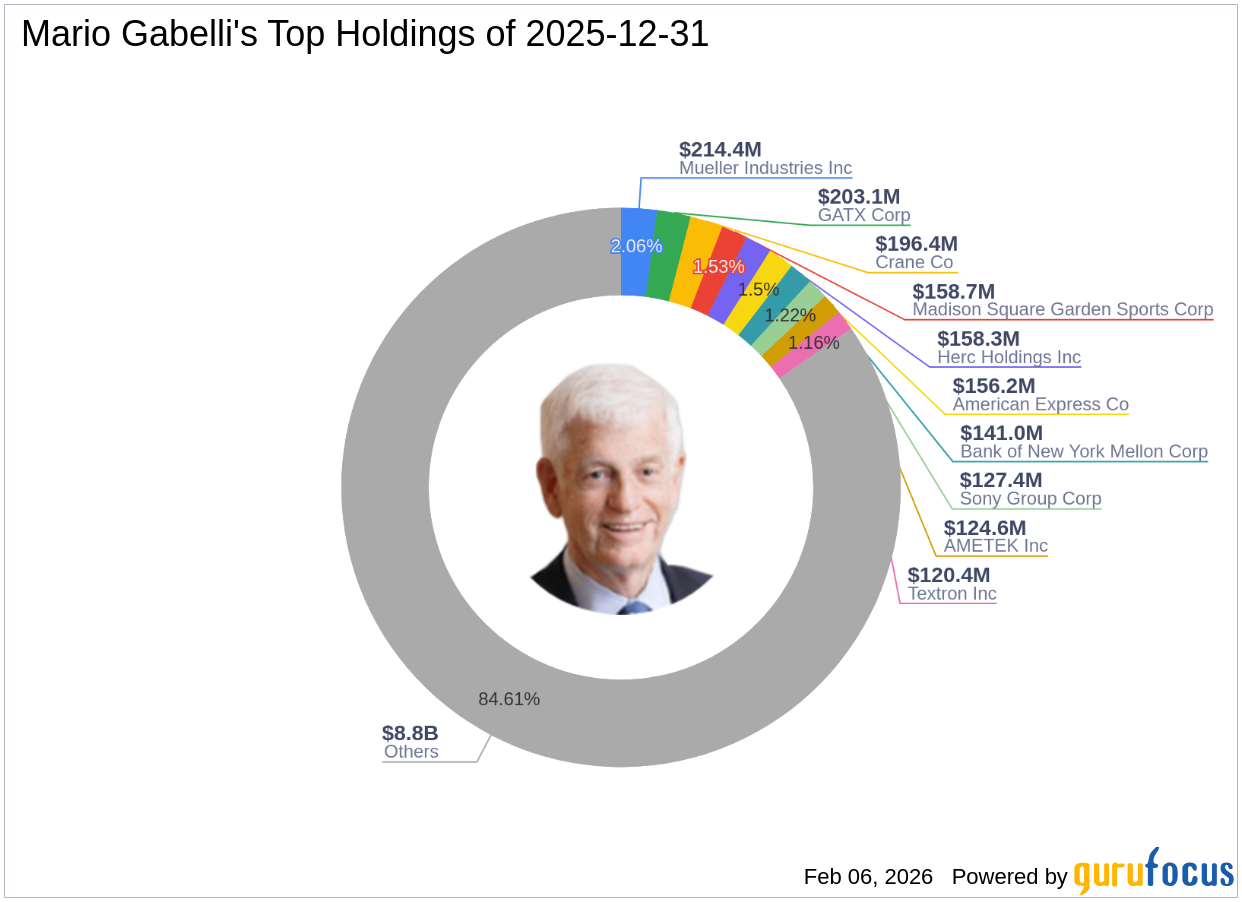
📘 INTERPUBLIC GROUP OF COMPANIES INC (IPG) — Investment Overview

🧩 Business Model Overview

INTERPUBLIC GROUP OF COMPANIES INC (IPG) operates a network of marketing communications and advertising agencies. The business serves brand owners and enterprises by planning, creating, and distributing marketing content across channels (e.g., broadcast, digital, search, social, experiential) and by managing media buying and campaign execution. Revenues are generated through agency retainers and project fees, plus transaction-linked fees tied to media and production activity. Client work is sticky because agencies become embedded in planning cycles, vendor ecosystems, and internal stakeholder processes (marketing, procurement, legal, finance).

Economically, IPG functions as an intermediary that translates client objectives into integrated go-to-market execution, while leveraging scale in procurement (e.g., vendors, production resources), shared capabilities (strategy, creative, analytics), and centralized support functions to improve cost efficiency at the network level.

💰 Revenue Streams & Monetisation Model

IPG monetizes primarily through:

  • Agency services fees (retainers and project-based work): More “relationship-driven” revenue tied to strategic planning, creative development, and campaign management.
  • Production and execution-linked revenue: Fees related to content creation, experiential deliverables, and production services.
  • Media-related revenue components: Monetisation that typically depends on the mix of commission/management structures and pass-through economics across campaigns.

Margin drivers are influenced by labor productivity (utilization and compensation discipline), the mix between higher-velocity creative/media execution versus lower-margin pass-through components, and network-level overhead allocation. Because many agency engagements involve ongoing planning and iterative optimization, a meaningful portion of revenue behaves like recurring “service capacity” rather than purely one-time transactional spend.

🧠 Competitive Advantages & Market Positioning

The primary moat is client switching costs supported by intangible assets (relationships, institutional knowledge, and creative/product capability) and reinforced by a scale-driven cost position.

  • Switching costs / know-how lock-in: Agencies learn client brands, approval workflows, compliance requirements, and performance measurement standards. Replacing a multi-year agency partner often requires re-building creative pipelines, vendor coordination, and measurement infrastructure.
  • Intangible assets: Creative output, proprietary planning frameworks, and specialized talent pools (strategy, design, analytics, production) function as hard-to-replicate assets even when specific contracts change hands.
  • Scale and procurement leverage: Network size supports better utilization of shared functions (data/analytics teams, production resources, media operations), and can improve bargaining power with vendors.

Competitive benchmarking: IPG’s agency network competes with:

  • Omnicom Group and WPP: larger global networks with broad geographic footprints and wide holding-company diversification across brands and service lines.
  • Publicis Groupe: a similarly diversified player with a strong emphasis on data and technology-enabled marketing services.

IPG competes across the same core marketing communications value chain, but its positioning emphasizes a diversified portfolio of agency specialties and client segments, which can support resilience when spending shifts across categories (e.g., consumer, financial services, healthcare, and technology). In practice, competitive share is won less through single “platform” differentiation and more through sustained client relationships, demonstrated performance, and the ability to staff and deliver integrated campaigns at scale.

🚀 Multi-Year Growth Drivers

  • Marketing spend migration to digital and measurable channels: Budgets increasingly flow toward performance-oriented marketing where analytics, audience targeting, and campaign optimization matter—services agencies can deliver through integrated teams.
  • Rise of integrated and content-led marketing: Brands require cross-channel creative and production depth, favoring networks that can coordinate creative, media operations, and measurement.
  • Increased demand for accountability and measurement: Clients increasingly seek attribution, incrementality testing, and clearer ROI reporting—supporting the role of agencies with analytics and media expertise.
  • Industry consolidation and share capture: Advertising and marketing services remain fragmented in many sub-markets; larger networks with scalable staffing and vendor relationships can gain share over time.
  • Client preference for capability over internal build: Many enterprises continue to outsource specialized creative production and campaign operations rather than fully internalize these functions.

Over a 5–10 year horizon, the TAM for marketing services remains supported by global brand building and the ongoing evolution of media ecosystems, with the competitive advantage accruing to networks able to combine creative effectiveness with data-enabled execution.

⚠ Risk Factors to Monitor

  • Advertising cycle cyclicality: Marketing budgets can contract during weaker macroeconomic conditions, pressuring revenue volumes and utilization.
  • Client concentration and contract volatility: Agency wins/losses can meaningfully affect revenue; a shift in major client spending patterns can change the revenue mix.
  • Margin pressure from staffing and compensation: Labor-intensive services expose margins to wage inflation and utilization swings; cost discipline remains a key execution requirement.
  • Digital platform dependency and policy/regulatory changes: Changes to targeting rules, data access, privacy regulation, and tracking standards can reduce the effectiveness of established campaign workflows.
  • Technology disruption and automation: AI-assisted creative tools and automated campaign optimization may compress parts of the workflow economics, requiring agencies to adapt service models and maintain differentiating capabilities.
  • Reputational and legal risk: Creative work creates exposure to compliance failures, brand-safety issues, and contractual disputes.

📊 Valuation & Market View

Equity markets typically value advertising and marketing services businesses on a blend of EV/EBITDA and P/E frameworks, with emphasis on durability of operating margins and the quality of free cash flow. Key variables that move valuation expectations include:

  • Organic revenue trajectory: Particularly the stability of retained mandates and the ability to win work without excessive discounting.
  • Operating margin profile: Labor productivity, overhead discipline, and the revenue mix between service fees and pass-through components.
  • Cash flow conversion: Working-capital dynamics tied to billing cycles and media-related economics.
  • Balance sheet and capital allocation: Net leverage trajectory and the credibility of capital returns relative to business risk.

In this sector, investors generally apply a “quality of earnings” lens due to the labor-intensive nature of the model and variability of contract timing.

🔍 Investment Takeaway

IPG’s long-term investment case rests on durable client switching costs and intangible capability embedded in agency relationships, supported by scale-driven efficiency across creative, media operations, and analytics. While the business remains exposed to advertising cyclicality and technology/platform shifts, its differentiated value proposition is the ability to deliver integrated, accountable marketing execution through a diversified agency network—an approach that tends to retain clients when performance measurement and creative execution become more complex.


⚠ AI-generated — informational only. Validate using filings before investing.

📰 Market News & Coverage

15 Stories Available

Real-time institutional reporting and market updates for IPG.

globenewswire.com2026-05-04

Galle Gallants Announce New Ownership Under Gallant Sports and Media LLC Within urban-gro / Flash Sports & Media / IPG–Operated LPL Season 6 Ecosystem; Pubudu Dassanayake Appointed Head Coach

Owners Kiran Mantripragada and Uday Kiran Namballa Anchors Franchise; Active Discussions With Sri Lankan Marquees Dasun Shanaka and Eshan Malinga Ahead of July–August 2026 Tournament Window Owners Kiran Mantripragada and Uday Kiran Namballa Anchors Franchise; Active Discussions With Sri Lankan Marquees Dasun Shanaka and Eshan Malinga Ahead of July–August 2026 Tournament Window

globenewswire.com2026-03-23

IPG to Expand T20 Cricket Footprint Across Sri Lanka, Malaysia and Zimbabwe Following Merger with Flash Sports & Media, Inc., following Flash's merger with NASDAQ-listed urban-gro, Inc.

Commercial rights holder charts expansion into Bangladesh and UAE after completing NASDAQ-governed merger Commercial rights holder charts expansion into Bangladesh and UAE after completing NASDAQ-governed merger

gurufocus.com2026-02-13

John Rogers' Strategic Moves: Sphere Entertainment Co Sees Significant Reduction

Exploring the Fourth Quarter 2025 13F Filing John Rogers (Trades, Portfolio) recently submitted the 13F filing for the fourth quarter of 2025, providing insigh

gurufocus.com2026-02-06

Mueller Industries Inc: A Key Focus in Mario Gabelli's Latest 13F Filing

Insights into Mario Gabelli (Trades, Portfolio)'s Investment Moves in Q4 2025 Mario Gabelli (Trades, Portfolio) recently submitted the 13F filing for the fourt

defenseworld.net2026-01-12

Nisa Investment Advisors LLC Boosts Stock Position in Interpublic Group of Companies, Inc. (The) $IPG

Nisa Investment Advisors LLC increased its holdings in Interpublic Group of Companies, Inc. (The) (NYSE: IPG) by 201.8% during the undefined quarter, according to its most recent Form 13F filing with the Securities and Exchange Commission (SEC). The fund owned 148,152 shares of the business services provider's stock after purchasing an additional 99,057

defenseworld.net2025-12-24

Interpublic Group of Companies, Inc. (The) $IPG Stock Position Decreased by Corient Private Wealth LLC

Corient Private Wealth LLC lowered its stake in Interpublic Group of Companies, Inc. (The) (NYSE: IPG) by 24.5% during the second quarter, according to its most recent 13F filing with the Securities and Exchange Commission. The institutional investor owned 83,932 shares of the business services provider's stock after selling 27,250 shares during the

defenseworld.net2025-12-20

Board of the Pension Protection Fund Takes $670,000 Position in Interpublic Group of Companies, Inc. (The) $IPG

Board of the Pension Protection Fund acquired a new position in shares of Interpublic Group of Companies, Inc. (The) (NYSE: IPG) during the third quarter, according to its most recent 13F filing with the Securities and Exchange Commission. The firm acquired 24,000 shares of the business services provider's stock, valued at approximately $670,000.

defenseworld.net2025-12-17

Interpublic Group of Companies, Inc. (The) (NYSE:IPG) Given Consensus Rating of “Hold” by Brokerages

Shares of Interpublic Group of Companies, Inc. (The) (NYSE: IPG - Get Free Report) have earned an average recommendation of "Hold" from the eight ratings firms that are presently covering the company, MarketBeat reports. Five research analysts have rated the stock with a hold rating and three have issued a buy rating on the company. The

defenseworld.net2025-12-12

Cerity Partners LLC Grows Holdings in Interpublic Group of Companies, Inc. (The) $IPG

Cerity Partners LLC raised its position in Interpublic Group of Companies, Inc. (The) (NYSE: IPG) by 11.8% in the second quarter, according to the company in its most recent filing with the Securities and Exchange Commission (SEC). The fund owned 317,586 shares of the business services provider's stock after buying an additional 33,471

defenseworld.net2025-12-10

Gabelli Funds LLC Raises Stake in Interpublic Group of Companies, Inc. (The) $IPG

Gabelli Funds LLC increased its stake in Interpublic Group of Companies, Inc. (The) (NYSE: IPG) by 23.9% in the second quarter, according to its most recent 13F filing with the Securities and Exchange Commission. The institutional investor owned 259,675 shares of the business services provider's stock after purchasing an additional 50,075 shares during

defenseworld.net2025-12-10

Ariel Investments LLC Has $77.86 Million Stock Position in Interpublic Group of Companies, Inc. (The) $IPG

Ariel Investments LLC lessened its holdings in Interpublic Group of Companies, Inc. (The) (NYSE: IPG) by 39.7% in the undefined quarter, according to the company in its most recent 13F filing with the Securities and Exchange Commission. The fund owned 3,180,658 shares of the business services provider's stock after selling 2,096,499 shares during

defenseworld.net2025-12-08

Critical Contrast: Interpublic Group of Companies (NYSE:IPG) vs. Mastermind (OTCMKTS:MMND)

Interpublic Group of Companies (NYSE: IPG - Get Free Report) and Mastermind (OTCMKTS:MMND - Get Free Report) are both business services companies, but which is the superior business? We will contrast the two companies based on the strength of their earnings, profitability, valuation, institutional ownership, analyst recommendations, risk and dividends. Risk and Volatility Interpublic Group of

defenseworld.net2025-12-03

Hsbc Holdings PLC Sells 156,345 Shares of Interpublic Group of Companies, Inc. (The) $IPG

Hsbc Holdings PLC lowered its stake in shares of Interpublic Group of Companies, Inc. (The) (NYSE: IPG) by 14.9% during the second quarter, according to its most recent disclosure with the Securities and Exchange Commission. The firm owned 891,455 shares of the business services provider's stock after selling 156,345 shares during the quarter.

fastcompany.com2025-12-01

Omnicom to cut over 4,000 jobs and shutter legacy ad agencies after IPG acquisition

Omnicom said on Monday it will lay off more than 4,000 employees and fold several well-known advertising agency brands after its $13 billion acquisition of rival Interpublic Group.

businessinsider.com2025-12-01

Omnicom's CEO breaks down his plan to beat rivals in AI after the ad giant's blockbuster $9 billion IPG deal

Omnicom recently closed a $9 billion acquisition of IPG, creating the largest ad agency company. In an interview with Business Insider, Omnicom's leadership team outlined its strategy.

📊 AI Financial Analysis

Powered by StockMarketInfo
Earnings Data: Q Ending 2025-09-30

"Latest (2025-09-30) results showed Revenue of $2.494B and Net Income of $130M (EPS $0.34). YoY, Revenue declined from $2.629B (2024-09-30) to $2.494B, down about -5.1%, while Net Income surged from $20.1M to $130M (+~+546%). QoQ, Revenue slipped from $2.536B (2025-06-30) to $2.494B (-1.6%), and Net Income fell from $162.5M to $130M (-20.0%). Profitability has been volatile across the 4-quarter window: net margin improved from ~0.8% (2024-09-30) to ~12.1% (2024-12-31), swung negative in 2025-03-31 (~-3.7%), then rebounded to ~5.2% in 2025-09-30. This suggests operating leverage is sensitive to demand and cost/actions. Cash-flow specifics were not provided; however, the dividend remains supported with a ~1.18% yield, though the latest payout ratio is high (~92.5%), indicating less room for downside earnings. Balance sheet resilience is moderate: total equity is ~ $3.71B and net debt is ~ $2.61B, trending slightly worse QoQ but still below the higher-leverage point seen in 2024-09-30. Shareholder returns: dividend contributes modest yield; total-return assessment is limited because marketPerformance/price and 1-year price momentum were not provided."

Revenue Growth

Caution

Latest Revenue was $2.494B, down -1.6% QoQ (vs. $2.536B) and down -5.1% YoY (vs. $2.629B). The 4-quarter trend shows variability with a weaker latest quarter.

Profitability

Neutral

Net income improved sharply YoY (+~+546% from $20.1M to $130M) but declined QoQ (-20% from $162.5M). Net margin is volatile: ~0.8% (2024-09), ~12.1% (2024-12), ~-3.7% (2025-03), ~5.2% (2025-09).

Cash Flow Quality

Fair

Net income turned positive again after a loss (2025-03-31). Dividend yield is ~1.18%, but payout ratio is elevated at ~92.5% in the latest quarter, which can pressure cash coverage if earnings weaken.

Leverage & Balance Sheet

Neutral

Equity was $3.71B (latest) with net debt ~$2.61B. Leverage is somewhat elevated but equity has held relatively steady vs earlier quarters; net debt rose slightly QoQ.

Shareholder Returns

Fair

Dividend provides modest income (~1.18% yield latest). Buybacks and total-return inputs (price/momentum) are not provided, limiting assessment of capital appreciation.

Analyst Sentiment & Valuation

Neutral

Consensus price target is $36.57 (median $36), but current price and valuation multiples context are missing (marketPerformance shows N/A), so upside/downside vs market cannot be quantified here.

Disclaimer:This analysis is AI-generated for informational purposes only. Accuracy is not guaranteed and this does not constitute financial advice.

Fundamentals Overview

Loading fundamentals overview...

IPG delivered results consistent with its plan, with a 3.5% organic decline as expected due to prior-year client losses, while underlying media and healthcare performance improved sequentially. Profitability was strong, with an 18.1% adjusted EBITDA margin, reflecting structural cost actions from its strategic transformation. Management reaffirmed full-year organic revenue guidance of down 1% to 2% and now expects adjusted EBITDA margin to exceed the prior 16.6% outlook by more than 100 bps. Clients are engaging methodically despite macro volatility, and new business trends are improving, with over half of media contracts now outcome-based. The Omnicom acquisition remains on track for H2 close, with U.S. FTC clearance obtained and most jurisdictions approved. Overall tone balances cost-driven margin strength and improving commercial traction against revenue headwinds and a mixed macro backdrop.

Growth

  • Organic net revenue decreased 3.5%, in line with prior phasing outlook
  • Three large 2024 account losses reduced Q2 growth by ~5.5 pts, with greatest impact in media and healthcare
  • Underlying performance showed sequential improvement in media and healthcare despite loss headwinds
  • Client sector growth led by food & beverage, financial services, and tech & telecom
  • Sequential improvement in the U.S. market quarter over quarter
  • New business performance in 2025 showing marked improvement

Business Development

  • Outcome-based components are included in more than 50% of media contracts
  • Adoption of Interact (modernized buying approach) is resonating with clients; modest impact expected in H2
  • Integrated pitches calling for data- and tech-enabled, cross-discipline solutions remain active
  • Healthcare and media new business pipelines active; other areas lighter

Financials

  • Adjusted EBITDA of $393.7 million; margin 18.1%
  • GAAP diluted EPS $0.44 (includes restructuring); adjusted diluted EPS $0.75
  • Restructuring charges of $118 million in Q2; $11 million deal expenses recorded in SG&A
  • Full-year 2025 organic net revenue outlook reaffirmed at -1% to -2%
  • Full-year adjusted EBITDA margin expected to be well ahead of prior 16.6% guide (management indicated >100 bps improvement)

Capital & Funding

  • Repurchased $98 million of shares in Q2; $188 million year-to-date
  • Expect to continue repurchases consistent with recent levels, subject to $325 million annual cap under the merger agreement
  • Transformation program charges now expected at $375–$400 million, with a substantial non-cash portion

Operations & Strategy

  • Strategic transformation delivering structural cost reductions and operating efficiencies
  • Greater functional centralization and enterprise platform leverage across production, analytics, IT, finance, and HR
  • Expect to exceed initial objectives for enterprise redesign, client service delivery, and ongoing efficiencies
  • Modernizing the business model to connect creative, data, media, and production for outcome-driven solutions

Market & Outlook

  • Macro volatility higher than anticipated, but clients are responding methodically rather than cutting reflexively
  • No marked change in net client activity in Q2; H2 inflection expected as loss headwinds lap
  • Combination with Omnicom expected to enhance capabilities, geographic reach, and platform assets
  • Outcome- and performance-based marketing trends continue to grow

Risks Or Headwinds

  • Residual revenue pressure from 2024 account losses, particularly in media and healthcare
  • Industry-wide softness in traditional creative
  • Macro and geopolitical volatility
  • Policy-related challenges in certain healthcare markets
  • Execution risk around transformation initiatives and integration with Omnicom
  • Remaining antitrust clearances outstanding in four jurisdictions (transaction still expected to close in H2)

Sentiment: MIXED

Note: This summary was synthesized by AI from the IPG Q2 2025 earnings transcript. Financial data is complex; please verify all metrics against official SEC filings before making investment decisions.

📋 Official Regulatory 10-K / 10-Q SEC Filings

Direct authenticated documentation links to audited SEC database reports for IPG.

SEC EDGAR Live Feed
No recent 10-K available.
No recent 10-Q available.
Loading financial data and tables...
📁

SEC Filings (IPG)

© 2026 Stock Market Info — The Interpublic Group of Companies, Inc. (IPG) Financial Profile