JetBlue Airways Corporation

JetBlue Airways Corporation (JBLU) Market Cap

JetBlue Airways Corporation has a market capitalization of $2.28B.

Price: $6.03

-0.04 (-0.66%)

Market Cap: 2.28B

NASDAQ · time unavailable

CEO: Joanna Geraghty

Sector: Industrials

Industry: Airlines, Airports & Air Services

IPO Date: 2002-04-12

Website: https://www.jetblue.com

JetBlue Airways Corporation (JBLU) - Company Information

Market Cap: 2.28B|Sector: Industrials

Company Profile

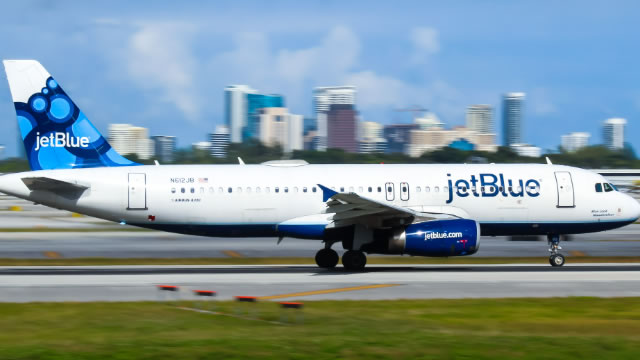
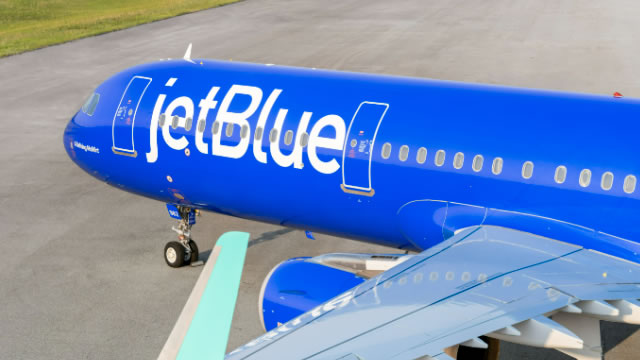
JetBlue Airways Corporation provides air transportation services. The company operates a fleet of Airbus A220, Airbus A320, Airbus A320 Restyled, Airbus A321, Airbus A321 with Mint, Airbus A321neo, Airbus A321neo with Mint, and Airbus A321neoLR with Mint aircraft. It also serves 100 destinations across the United States, the Caribbean, Latin America, Canada, and Europe. In addition, it operates airport lounges, as well as provides vacation services. JetBlue Airways Corporation was incorporated in 1998 and is based in Long Island City, New York.

Analyst Sentiment

38%
Underperform

From 18 Active Polls

1Y Forecast: $6.39

▲ +6.0% Potential Upside

Consensus Target Metrics

Low Bound

$5

Median

$7

High Bound

$8

Average

$6

Price & Moving Averages

Loading chart...

🎯 Wall Street Analyst Intelligence Report

1-Year structural target targets, chart projections, and sentiment maps.

Average 1Y Target
$6.39
▲ +5.97% Upside
Low Target
$4.50
-25% Risk
Median Target
$6.75
12% Mid
High Target
$8.00
33% Max
Consensus
Hold
7 / 37 Buys

Consensus Trend Projection

Trailing closures vs. 12-month metrics map.

Analyst Vote Distribution

Aggregate institutional coverage sentiment weights.

📊 Historical Valuation Multiples

Real-time Trailing Twelve Month (TTM) momentum side-by-side with discrete quarterly metrics.

Fiscal QuarterTTMQ2 2026Q1 2026Q4 2025Q3 2025Q2 2025Q1 2025Q4 2024Q3 2024
Period EndingTrailing 12MJun 30, 2026Mar 31, 2026Dec 31, 2025Sep 30, 2025Jun 30, 2025Mar 31, 2025Dec 31, 2024Sep 30, 2024
Market Cap ($M)2,2752,1121,6291,6771,7891,5281,7052,7202,276
Enterprise Value ($M)10,0059,8429,0059,8868,8028,8088,8229,9418,523
Price to Earnings Ratio (P/E)-2.50-2.14-1.27-2.37-3.15-5.29-2.04-15.12-9.65
Price/Earnings-to-Growth Ratio (PEG)-0.10-0.52
Price to Sales Ratio (P/S)0.240.780.730.750.770.650.801.190.96
Price to Book Ratio (P/B)1.401.330.900.790.790.630.701.030.86
Price to Free Cash Flow Ratio (P/FCF)-2.18-6.48542.92-5.66-4.23-6.53-27.06-6.27-7.25
Enterprise Value to Sales (EV/Sales)3.654.024.413.793.744.124.373.60
Enterprise Value to EBITDA (EV/EBITDA)36.25166.81-643.2089.8772.7539.86210.0487.9755.34
Debt to Equity Ratio28.015.915.164.844.153.913.853.463.34

📘 Full Research Report

ℹ️

AI-Generated Research: This report is for informational purposes only.

📘 JETBLUE AIRWAYS CORP (JBLU) — Investment Overview

🧩 Business Model Overview

JetBlue operates a hybrid airline model, combining elements of a low-cost carrier with a differentiated customer experience and a growing set of network routes. The value chain centers on: (1) acquiring seats through aircraft utilization and route planning, (2) selling tickets plus ancillary services (bags, seat selection, onboard revenue), and (3) monetizing repeat demand through a loyalty program. Economic performance is driven by the interaction between capacity discipline, route-level pricing power, and unit costs (fuel, labor, aircraft ownership/lease economics, and airport/ground handling charges).

💰 Revenue Streams & Monetisation Model

Revenue is primarily transactional (ticket sales) augmented by ancillary monetisation. Key drivers include:

  • Base fares (core seat revenue): priced by demand, competition, and schedule convenience; margins depend on load factor and yield.
  • Ancillary revenue: fees for checked bags, seat upgrades, priority services, and onboard purchases. These tend to scale with passenger volume without requiring proportional increases in aircraft capacity.
  • Loyalty economics: frequent-flyer engagement supports repeat booking behavior and can improve revenue quality; it functions less like a “recurring subscription” and more like a demand-shaping mechanism across routes.

Overall margin profile reflects the spread between revenue per available seat and consolidated unit costs, with fuel and labor typically the dominant cost components.

🧠 Competitive Advantages & Market Positioning

JetBlue’s competitive position is best characterized by operational and network-access advantages rather than classic switching costs. Airlines face low customer switching friction; therefore, the “moat” is more about making seats cheaper to produce and harder to replicate at the same airports and on the same route schedules.

  • Network/route concentration at key markets: establishing credible schedules at high-demand airports improves frequency, connectivity, and corporate account appeal. Airport gate access and scheduling coordination can be difficult and time-consuming to replicate.
  • Cost discipline and fleet efficiency: using modern aircraft and targeting controllable unit costs supports competitiveness, especially in capacity waves when rivals’ costs are less optimized.
  • Loyalty-driven repeat demand (soft switching costs): while travelers can change airlines easily, loyalty accrual and redemption economics encourage repeat use on routes where JetBlue provides convenient schedules.
  • Differentiated product to support yield: customer experience positioning can help stabilize demand, particularly where travelers value service consistency and schedule quality.

Competitive benchmarking:

  • Spirit Airlines (SAVE): focused on a stronger ultra-low-cost (“ULCC”) model with a tighter ancillary-heavy pricing structure. JetBlue’s differentiation is comparatively more schedule- and service-oriented, with a less extreme ancillary mix.
  • Frontier Airlines (ULCC) (UL): similar ULCC pressures on unit costs and ancillary revenues. JetBlue competes by leveraging route/network presence and operational execution rather than relying solely on a “lowest all-in price” strategy.
  • Delta Air Lines (DAL): a scaled network carrier with extensive hub infrastructure and global connectivity. Delta’s advantage is broader network depth; JetBlue’s focus is narrower route coverage with targeted concentration.

In short, JetBlue’s defensibility comes from where it flies (airport/slot realities and schedule credibility), how efficiently it operates, and how repeat demand is cultivated—not from high switching costs.

🚀 Multi-Year Growth Drivers

  • Industry capacity rationalization: disciplined capacity and improved utilization can elevate pricing power even without structural demand growth. The airline sector’s outcomes often depend on supply discipline as much as GDP growth.
  • Route-level profit opportunities: selective expansion into routes where competitive intensity is manageable and aircraft deployment costs fit the expected yield environment.
  • Loyalty engagement and ancillary penetration: incremental revenue per passenger can rise through continued refinement of ancillary packaging and loyalty participation, improving revenue quality.
  • Fleet modernization and reliability: newer or more efficient aircraft and improved operational processes support better on-time performance and lower per-seat costs, which can translate into sustained competitiveness across cycles.
  • Business travel recovery dynamics: corporate demand tends to respond to schedule reliability and frequency—areas where network design and operational consistency matter.

Across a 5–10 year horizon, the principal TAM driver is the long-run growth in air travel participation, with company-specific upside tied to capturing a larger share of profitable routes through operational execution and careful capacity allocation.

⚠ Risk Factors to Monitor

  • Fuel price volatility: fuel can compress margins quickly absent effective hedging and pricing flexibility.
  • Labor and aircraft cost inflation: wage dynamics, maintenance needs, and lease/financing conditions can raise unit costs.
  • Industry cyclicality and competitive capacity overhang: if rivals add seats faster than demand, fare pressure can intensify and reduce load factor and yields.
  • Operational disruptions: aircraft availability, maintenance events, and network disruptions can impair schedule integrity and create cost overruns.
  • Regulatory and airport constraints: changes in slot/gate rules, operational restrictions, or compliance costs can affect route economics.
  • Balance-sheet and capital intensity: airlines require continuous fleet investment and working-capital management; downturns can elevate refinancing risk.

📊 Valuation & Market View

Equity markets typically value airlines using EV/EBITDAR and enterprise value vs. cash flow, reflecting the sector’s sensitivity to margins, capacity, and leverage. Key valuation drivers include:

  • Operating leverage: how revenue per seat translates into incremental profitability when load factors and yields improve.
  • Unit cost trajectory: fuel efficiency, labor cost management, and maintenance cost trends.
  • Credit and liquidity: market confidence in survivability through downturns and the ability to fund fleet/operations.
  • Cycle positioning: investors tend to underwrite normalization of capacity discipline and margins rather than peak conditions.

Because earnings are cyclical, valuation can re-rate when expectations shift toward sustained margin durability (cost competitiveness plus stable demand capture on specific routes).

🔍 Investment Takeaway

JetBlue’s long-term investment case rests on earning acceptable returns through a combination of route/network positioning, operational execution that supports cost competitiveness, and loyalty/ancillary monetisation that improves revenue quality. The absence of hard switching costs makes competitive outcomes dependent on disciplined capacity and unit-cost performance, but airport-access realities and schedule credibility can create meaningful differentiation versus pure ULCC strategies. The primary question for investors is whether JetBlue can sustain cost and operational advantages while maintaining capacity discipline through industry cycles.


⚠ AI-generated — informational only. Validate using filings before investing.

📰 Market News & Coverage

15 Stories Available

Real-time institutional reporting and market updates for JBLU.

businessinsider.com2026-07-31

Airlines are still willing to bet on Boeing, and the biggest aviation show of the year proves it

Boeing narrowly beat Airbus in the order tally at the Farnborough Airshow. It's a key signal that Boeing's new CEO, Kelly Ortberg, is turning the American planemaker around.

businesswire.com2026-07-29

The Best of New York, Now Boarding: JetBlue Debuts New Mint® Menus from Crown Shy and Birdee

NEW YORK--(BUSINESS WIRE)--JetBlue (NASDAQ: JBLU) today unveiled the first menus from its newest Mint® culinary partners – Crown Shy and Birdee – available online now and across select domestic and transatlantic Mint routes starting July 31, 2026. Developed in collaboration with Kent Hospitality Group, the new menus from New York City eateries Crown Shy and Birdee build on JetBlue's distinctive approach to hospitality, bringing a fresh, unmistakably New York perspective to Mint that captures th.

youtube.com2026-07-28

JetBlue CEO on Q2 results: Industry is starting to gain pricing power

Joanna Geraghty, JetBlue CEO, joins 'Power Lunch' to discuss the company's quarterly earnings results.

247wallst.com2026-07-28

JetBlue Advances 9% on Earnings Beat and 2028 Profit Target, Lifting Delta, United, and Southwest

Shares of JetBlue Airways (NASDAQ:JBLU) are up 9% to $5.94 in Tuesday midday trading after the carrier posted a Q2 2026 adjusted-EPS beat, reinstated its full-year outlook, and introduced a long-term 2028 profit target of at least $1 per share.

seekingalpha.com2026-07-28

JetBlue Airways Corporation (JBLU) Q2 2026 Earnings Call Transcript

JetBlue Airways Corporation (JBLU) Q2 2026 Earnings Call Transcript

wsj.com2026-07-28

JetBlue Eyes More Aircraft Financing If High Fuel Costs Persist

The carrier's net loss widened to $247 million in the second quarter, from a loss of $74 million in the same period in 2025.

zacks.com2026-07-28

JBLU Q2 Earnings Beat on Strong RASM Growth, Revenues Rise

JetBlue's Q2 loss narrows more than expected as revenues rise 14.5% and RASM jumps 10.9%, offsetting sharp fuel-cost pressure.

marketbeat.com2026-07-28

JetBlue Airways Q2 Earnings Call Highlights

JetBlue Airways NASDAQ: JBLU said second-quarter revenue rose 10.9% from a year earlier as demand remained resilient across its network, including premium and main-cabin products, despite higher fares and operational disruptions from thunderstorms, air traffic control staffing constraints and elevated fuel prices.

zacks.com2026-07-28

JetBlue (JBLU) Q2 Earnings: Taking a Look at Key Metrics Versus Estimates

Although the revenue and EPS for JetBlue (JBLU) give a sense of how its business performed in the quarter ended June 2026, it might be worth considering how some key metrics compare with Wall Street estimates and the year-ago numbers.

zacks.com2026-07-28

JetBlue Airways (JBLU) Reports Q2 Loss, Tops Revenue Estimates

JetBlue Airways (JBLU) came out with a quarterly loss of $0.66 per share versus the Zacks Consensus Estimate of a loss of $0.7. This compares to a loss of $0.16 per share a year ago.

wsj.com2026-07-28

JetBlue Loss Widens Due to Higher Fuel Costs

JetBlue Airways recorded a bigger loss in the second quarter stemming from higher jet fuel prices, though it blunted about half of that damage with higher fares and strong customer demand.

businesswire.com2026-07-28

JetBlue Announces Second Quarter 2026 Results

NEW YORK--(BUSINESS WIRE)--JetBlue Airways Corporation (NASDAQ: JBLU) today reported its financial results for the second quarter of 2026. “Two years into JetForward, we're encouraged by the progress we're making and the results we're driving across the business,” said Joanna Geraghty, JetBlue's chief executive officer. “Our second quarter performance reflects the strength of our JetForward strategy and the focused execution of our crewmembers, as strong customer demand and our decisive actions.

businessinsider.com2026-07-27

JetBlue is introducing a 'basic first class' fare as airlines continue unbundling premium travel

JetBlue Airways announced a basic fare for its coming first class, but it won't extend to Mint. The strategy is similar to United and Delta's cheaper business class tickets.

cnbc.com2026-07-27

JetBlue overhauls fare options, from basic first to flexible economy. Here's what to know

JetBlue is overhauling the fare options that customers will see on its booking page. The new groupings do away with "Core" and put economy class options in a "Main" category.

gurufocus.com2026-07-27

JetBlue Introduces a Simple, Intuitive Way to Shop for Flights as It Prepares for First-Class Launch

JetBlue (NASDAQ: JBLU) today announced a simpler, more intuitive way for customers to shop for flights, making it easier to compare available onboard experience

📊 AI Financial Analysis

Powered by StockMarketInfo
Earnings Data: Q Ending 2026-06-30

"JBLU reported Q2’26 revenue of $2.70B, down -0.4% QoQ from $2.24B in Q1’26 and down -14.1% YoY from $2.356B in Q2’25. Net income was -$247M (EPS -$0.66), worsening materially QoQ versus -$319M in Q1’26 (loss narrowing QoQ, but still negative) and vs -$74M in Q2’25 (loss deepening YoY). Profitability weakened across margins over the 4-quarter run: gross margin rose to 52.7% in Q2’26 from 43.1% in Q1’26, but operating and net margins remained firmly negative at -5.2% and -9.2%, respectively. Cash flow deteriorated in Q2’26: operating cash flow was -$155M and free cash flow -$326M, with net cash down by -$287M to $1.92B. Balance sheet stress is evident: total assets declined to $0 (data provided appears incomplete at Q2’26), while short-term debt and long-term debt remain very high—net debt is $9.39B and equity is $1.59B. Shareholder returns are strongly positive on momentum (1Y price change +71.1%); however, there is no dividend and buybacks appear small (only ~$5M repurchased in Q2’26), so total return is largely price-driven. Analyst valuation context: consensus target ~$6.29 vs price $5.87 suggests modest upside."

Revenue Growth

Neutral

Revenue was $2.70B in Q2’26, essentially flat QoQ (-0.4% vs Q1’26) but down -14.1% YoY (vs Q2’25). The last four quarters show choppiness with a clear YoY decline most recently.

Profitability

Caution

Net income remains deeply negative: -$247M in Q2’26 vs -$319M QoQ (loss narrowed) but vs -$74M YoY (loss worsened). Net margin is -9.2% in Q2’26; operating margin -5.2%. Margins are not consistently improving despite a higher Q2 gross margin.

Cash Flow Quality

Neutral

Q2’26 operating cash flow was -$155M and free cash flow -$326M, indicating weak cash generation and a negative earnings-to-cash translation. Dividends are $0 and financing appears limited.

Leverage & Balance Sheet

Caution

Leverage is high: net debt is $9.39B and total debt $9.39B in Q2’26, with equity of $1.59B. Equity is relatively stable vs prior quarters, but the negative profitability raises ongoing solvency/financing risk.

Shareholder Returns

Good

Total shareholder return profile is dominated by capital appreciation: 1Y price change is +71.1% (strong momentum). Dividends are zero and buybacks are minimal, so returns are not supported by shareholder yield.

Analyst Sentiment & Valuation

Caution

Consensus price target of $6.29 vs current ~$5.87 implies modest upside. With ongoing losses and weak free cash flow, valuation support may be fragile.

Disclaimer:This analysis is AI-generated for informational purposes only. Accuracy is not guaranteed and this does not constitute financial advice.

Fundamentals Overview

Loading fundamentals overview...

So what: JetBlue is suspending full-year guidance due to a major fuel shock and explicitly shifting to agile levers—fares, capacity trimming, and cost actions—rather than relying on prior planning assumptions. In Q1, RASM grew 6.5% and beat expectations, with the upside driven by demand strength and Jet Forward (loyalty cash remuneration +19% YoY; TrueBlue momentum; Blue House/JFK premium card strength; Fort Lauderdale RASM +5% with capacity +23%). However, management highlighted a structural limitation: Q1 was already >90% booked when fuel spiked in early March, limiting immediate fare recapture. For Q2, they guide RASM +7% to +11% on modest capacity growth (+1.5% to +4.5%) and expect 30% to 40% fuel recapture vs plan, targeting 100% by early 2027. Liquidity is strong ($2.4B; 26% of TTM revenue) but the $250M accordion may be drawn if fuel pressure threatens the 17%–20% target. Blue Sky’s United interline launch and rolling Paisley offerings remain key commercial supports.

AI IconGrowth Catalysts

  • Jet Forward loyalty momentum: loyalty cash remuneration +19% YoY; TrueBlue active members at all-time highs and attach rates rising in non-focused city geographies; increased JetBlue card spend and +45% card acquisitions
  • Blue House at JFK: NPS trending above expectations, driving premium credit card sign-ups beyond initial targets; next lounge opening planned in Boston later in 2026
  • Domestic first class launch expected in 2H 2026 (not yet on sale); certification process underway; management will announce the open sales date when the first aircraft is available
  • Fort Lauderdale focus-city execution: Q1 RASM +5% with capacity +23%; schedule rebanked to 4 connecting banks (from 2) beginning this summer

Business Development

  • Blue Sky collaboration: launch of interline flight sales with United; reciprocal loyalty benefits across Mosaic and MileagePlus tiers expected to turn on this quarter
  • Blue Sky/Paisley platform: sales of rental cars through Paisley expected to turn on; hotels beginning early Q3 and additional package categories (cruises, etc.) later in 2026
  • Fort Lauderdale growth announcements: new nonstop service to Cleveland and added frequencies on nine routes (late March) from Fort Lauderdale

AI IconFinancial Highlights

  • RASM +6.5% in Q1, in line with revised guidance and 4.5 points above the midpoint of initial RASM range
  • RASM bridge: winter shocks (Caribbean airspace closure in January; storms Fern and Orlando) reduced capacity by ~4 points, benefiting RASM by ~2 points; remaining ~2.5 points of beat from demand strength and Jet Forward
  • Premium strength: YoY premium RASM better than core by +9 points in Q1
  • RASM implied fuel recapture: management expects Q2 fuel recapture of 30% to 40% of fuel cost increases vs initial plan; plan to achieve 100% recapture by early 2027
  • RASM guidance (Q2): +7% to +11% YoY on +1.5% to +4.5% more capacity; Easter outbound shift headwind ~1.5 points to Q2 RASM growth
  • CASM ex-fuel: Q1 CASM ex-fuel up +6.6%; ~4 points attributable to close-in capacity reductions from operational disruption (implying underlying ~+2.5% without those impacts). Cost beat split: ~1 point cost-saving efforts; ~1 point spend to shift into remainder of year
  • CASM ex-fuel guidance (Q2): +3% to +5% YoY; management expects moderation in 2H with over ~2 points less unit cost growth than 1H (subject to fuel evolution and final capacity)
  • Average fuel price (Q1): $2.96, +26% vs midpoint of initial guidance
  • Average fuel price guidance (Q2): $4.13 to $4.28 (midpoint +75% YoY), derived from forward Brent curve as of April 10; sensitivity: every $0.10 change in fuel price ~ $85 million full-year expense
  • Underlying unit economics: roughly 5-point spread between RASM and CASM ex-fuel expected at Q2 midpoint (described as not seen in years)
  • Capital expenditure timing: Q1 CapEx $141 million, $59 million lower than initial guidance due to delivery timing
  • Delivery plan reset: expect 12 total aircraft deliveries in 2026 (down from January guidance of 14) and slight shift to A220 deliveries
  • CapEx guidance: ~ $275 million in Q2 and ~ $800 million in 2026; CapEx expected below $1 billion annually through end of decade
  • Liquidity: ended Q1 with $2.4 billion liquidity (26% of trailing twelve-month revenue), above liquidity target 17% to 20%; excludes $600 million undrawn revolving credit facility

AI IconCapital Funding

  • Raised $500 million secured by aircraft collateral (this month), with an accordion feature to upsize to $750 million
  • Repaid remaining $325 million of 2021 convertible notes
  • Plan/assumption: original 2026 plan assumed raising $500 million; management expects to draw on a second portion later in the year
  • Accordion availability: management referenced an incremental $250 million draw
  • No buyback amounts or new debt other than described secured collateral raise were stated in the provided transcript

AI IconStrategy & Ops

  • Full-year guidance suspension due to fuel shock from Middle East and elevated fuel expectations; management stated suspension reflects external factors only, not a change in Jet Forward progress
  • Capacity actions: reduced capacity nearly one point vs close-in expectations in Q2; plans to reduce H2 by at least 2 to 3 points
  • Guidance timing lever: capacity decisions more beneficial when made at least 60 days in advance; management plans flexible trimming after the summer peak if fuel stays elevated
  • ANC/price actions: adjusted fares with industry over the last two months; targeted updates to ancillary fees (checked bags referenced) to better cover costs while keeping base fares competitive
  • Cost initiatives: reduced controllable spending and slowed hiring; expected lower maintenance and other variable costs (including landing fees) in lower capacity environment
  • Jet Forward structural initiatives: rolling out new technology and AI for crew/operation planning; launching a sourcing center of excellence to optimize contract spend; implementing more efficient insourcing/outsourcing opportunities
  • Automation/ops platform specifics referenced only at high level (AI/technology for planning); no facility closure details were provided

AI IconMarket Outlook

  • Q2 RASM: +7% to +11% YoY on +1.5% to +4.5% more capacity
  • Q2 fuel recapture: 30% to 40% of fuel cost increases vs initial plan; 100% recapture by early 2027
  • Q2 fuel price: $4.13 to $4.28 (midpoint +75% YoY), based on forward Brent curve as of April 10
  • CASM ex-fuel Q2: +3% to +5% YoY; 2H moderation with over 2 points less unit cost growth than 1H (fuel-dependent)
  • Management will not guide Q3; expects continuing recovery of increasing fuel recapture as year progresses

AI IconRisks & Headwinds

  • Fuel price shock as most significant industry headwind since COVID; management cited Middle East conflict driving sharp increase and expectation of elevated fuel prices through 2026
  • Booking curve limitation: Q1 was already over 90% booked when fuel spiked in early March, reducing immediate ability to recapture via fare increases
  • Easter outbound shift headwind ~1.5 points of Q2 RASM
  • CASM and unit costs remain exposed to final fuel evolution and final capacity levels (2H moderation is subject to these inputs)
  • Third-quarter seasonality: historically lower revenue in Q3 vs Q2, and Q2 Easter benefit makes sequential comparisons harder (analyst-framed risk; management did not provide probability)

Q&A: Analyst Interest

  • Domestic first class timing & go-to-market: Management said they have not started selling domestic first class yet, to wait for full understanding of the implementation timeline. They are still in certification and will announce the open sales date when the first aircraft is ready for sale later in 2026.
  • Fuel recapture sequencing mechanics: Management explained the 90% Q1 booking status meant fewer opportunities to recapture fuel-driven fare increases because fuel spiked in early March after customers already booked in January and February. For future periods, once fare increases apply to new bookings, recapture should improve materially.
  • Liquidity draw scenarios & accordion use: Management confirmed ending liquidity at 26% vs a 17%–20% target and described the $250 million remaining accordion capacity from the $500 million aircraft-collateral raise to $750 million. They stated they would likely draw if fuel impacts risk dropping below target.

Sentiment: CAUTIOUS

Note: This summary was synthesized by AI from the JBLU Q1 2026 earnings transcript. Financial data is complex; please verify all metrics against official SEC filings before making investment decisions.

📋 Official Regulatory 10-K / 10-Q SEC Filings

Direct authenticated documentation links to audited SEC database reports for JBLU.

SEC EDGAR Live Feed
Loading financial data and tables...
📁

SEC Filings (JBLU)

© 2026 Stock Market Info — JetBlue Airways Corporation (JBLU) Financial Profile