Kennametal Inc.

Kennametal Inc. (KMT) Market Cap

Kennametal Inc. has a market capitalization of $2.49B.

Price: $32.63

ā–¼ -0.27 (-0.82%)

Market Cap: 2.49B

NYSE Ā· time unavailable

CEO: Sanjay K. Chowbey

Sector: Industrials

Industry: Manufacturing - Tools & Accessories

IPO Date: 1943-01-01

Website: https://www.kennametal.com

Kennametal Inc. (KMT) - Company Information

Market Cap: 2.49B|Sector: Industrials

Company Profile

Kennametal Inc. engages in development and application of tungsten carbides, ceramics, and super-hard materials and solutions for use in metal cutting and extreme wear applications to enable customers work against corrosion and high temperatures conditions worldwide. The company operates through two segments, Metal Cutting and Infrastructure. It offers standard and custom products, including turning, milling, hole making, tooling systems, and services, as well as specialized wear components and metallurgical powders for manufacturers engaged in various industries, such as the manufacturers of transportation vehicles and components, machine tools, and light and heavy machinery; airframe and aerospace components; and energy-related components for the oil and gas industry, as well as power generation. The company also provides specified product design, selection, application, and support services; and standard and custom metal cutting solutions to aerospace, general engineering, energy, and transportation customers. In addition, it produces compacts, nozzles, frac seats, and custom components used in oil and gas, and petrochemical industries; rod blanks and abrasive water jet nozzles for general industries; earth cutting tools and systems used in underground mining, trenching and foundation drilling, and road milling; tungsten carbide powders for the oil and gas, aerospace, and process industries; and ceramics used by the packaging industry for metallization of films and papers. It provides its products under the Kennametal, WIDIA, WIDIA Hanita, and WIDIA GTD brands through its direct sales force; a network of independent and national distributors; integrated supplier channels; and through the Internet. The company was founded in 1938 and is based in Pittsburgh, Pennsylvania.

Analyst Sentiment

27%
Underperform

From 8 Active Polls

1Y Forecast: $36.10

ā–² +10.6% Potential Upside

Consensus Target Metrics

Low Bound

$29

Median

$33

High Bound

$48

Average

$36

Price & Moving Averages

Loading chart...

šŸŽÆ Wall Street Analyst Intelligence Report

1-Year structural target targets, chart projections, and sentiment maps.

Average 1Y Target
$36.10
ā–² +10.63% Upside
Low Target
$29.00
-11% Risk
Median Target
$33.00
1% Mid
High Target
$47.50
46% Max
Consensus
Hold
5 / 23 Buys

Consensus Trend Projection

Trailing closures vs. 12-month metrics map.

Analyst Vote Distribution

Aggregate institutional coverage sentiment weights.

šŸ“Š Historical Valuation Multiples

Real-time Trailing Twelve Month (TTM) momentum side-by-side with discrete quarterly metrics.

Fiscal QuarterTTMQ1 2026Q4 2025Q3 2025Q2 2025Q1 2025Q4 2024Q3 2024Q2 2024
Period EndingTrailing 12MMar 31, 2026Dec 31, 2025Sep 30, 2025Jun 30, 2025Mar 31, 2025Dec 31, 2024Sep 30, 2024Jun 30, 2024
Market Cap ($M)2,4872,7532,1891,5931,7501,6411,8672,0241,806
Enterprise Value ($M)3,0393,3062,7042,1622,2532,1972,3882,5522,324
Price to Earnings Ratio (P/E)18.1511.8216.1517.1020.2613.0326.0322.8812.14
Price/Earnings-to-Growth Ratio (PEG)—0.992.55—3.2814.451218.15—2.28
Price to Sales Ratio (P/S)1.164.654.133.203.393.373.874.203.32
Price to Book Ratio (P/B)1.842.031.661.241.361.331.531.581.44
Price to Free Cash Flow Ratio (P/FCF)34.00-131.6451.61-289.9730.63310.1351.9596.4019.99
Enterprise Value to Sales (EV/Sales)—5.585.114.344.364.524.955.304.28
Enterprise Value to EBITDA (EV/EBITDA)8.5527.6230.3428.8631.4326.3535.5635.8324.11
Debt to Equity Ratio1.560.490.490.520.500.530.530.510.52

⚔ KMT Growth Runway Model

Standard long term linear growth fade

Multi-Stage Discounted Cash Flow Sandbox

Market Price$32.63
Intrinsic Value$20.12
Market Alignment
Overvalued by 38.3%relative to calculated intrinsic value
9.00%
Exp: -1%-1%
i

Growth runway slowdown

This value provides a time window for the growth rate to decline beyond Stage 1 toward the terminal rate. Longer windows are most useful for companies with high growth starting conditions or strong competitive advantages. This option stretches out the growth rate slowdown across 5, 10, or 15-year steps. A high-growth starting condition (exceeding a 25% initial growth rate) automatically applies a curve decay to simulate realistic, rapid market saturation.
i

Terminal growth rate

With long-term inflation between 3-5%, revenue must grow by that baseline to maintain flat real-world market share. This value sets the permanent terminal growth rate to factor into the valuation beyond the growth slowdown runway toward maturity.

3-Stage Financial Runway Horizon

🧠 Perpetuity Horizon Engine (Stage 3: Post-2035)

Terminal FCF Base$0.17B
Perpetuity TV Value$3.15B
Discounted TV (PV)$1.33B
TV Weighting %56.6%
āš ļø
Financial Model Disclaimer & Risk Disclosure: This interactive scenario simulator is an educational sandbox provided strictly for informational and analytical research purposes. Core historical financial statements and consensus estimates are sourced directly via Financial Modeling Prep (FMP). All downstream outputs are entirely deterministic, hypothetical projections generated by combining automated mathematical formulas (including linear interpolation and Gaussian bell-curve decay models) with user-selected variables and third-party financial data inputs. Users assume all liability for trading decisions executed based on these sandbox calculations.

šŸ“˜ Full Research Report

ā„¹ļø

AI-Generated Research: This report is for informational purposes only.

šŸ“˜ KENNAMETAL INC (KMT) — Investment Overview

🧩 Business Model Overview

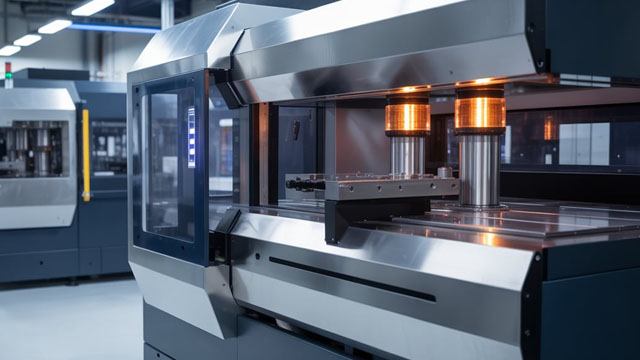
Kennametal participates in the industrial tooling value chain by converting hard-material know-how (carbides, ceramics, engineered tool geometries and coatings) into precision cutting tools and wear components used by manufacturers worldwide. The business typically sells indexable and solid carbide tooling for machining, along with wear parts for demanding end-markets (including mining and heavy industry). Customer value creation is driven by improving productivity (material removal rates, surface finish, tool life) and reducing downtime through reliable performance. Commercially, KMT’s ā€œhow it worksā€ is built around technical application support, tool qualification processes, and repeat ordering tied to an installed base of tooling—rather than one-off procurement.

šŸ’° Revenue Streams & Monetisation Model

Revenue is primarily transactional, but with recurring characteristics because tooling and wear parts are consumables with replacement cycles. Monetisation is driven by:
  • Aftermarket/tool replacement: Higher share of demand tends to be tied to usage, not new machine placements—supporting periodic demand through ongoing production.
  • Mix and margin management: Higher value items (engineered inserts, complex geometries, coated solutions, and wear segments) generally carry better gross margin than commodity-like offerings.
  • Application-engineered solutions: Pricing power is supported by performance outcomes that reduce total cost per machined part (tooling cost + labor + scrap + downtime).
Overall margin drivers are therefore tied to (1) product mix toward engineered and coated solutions, (2) manufacturing efficiency in carbide/tooling operations, and (3) the ability to navigate input-cost volatility and pricing actions across cycles.

🧠 Competitive Advantages & Market Positioning

Kennametal’s moat is a combination of switching costs, process and material know-how, and commercial/technical qualification barriers. Switching costs (hard operational friction): Tooling selection is typically qualified in production. Changing grades, geometries, or coatings can require process trials, programming adjustments, and validation to avoid quality losses and downtime. That creates practical customer stickiness once performance targets are met. Intangible assets & cost advantages: Competitors must replicate not only the physical product, but the engineering ā€œsystemā€ behind tool design, coating/grade selection, and application support. KMT’s experience across cutting conditions and wear mechanisms supports defensible product development. Scale and manufacturing process expertise in engineered tooling further support cost and throughput advantages. Competitive benchmarking (primary competitors):
  • Sandvik (Sandvik Coromant): Strong in machining solutions with broad global distribution and engineering support.
  • ISCAR: Major indexable tooling provider with a large portfolio of insert designs and coatings.
  • Walter (Oerlikon / Walter division): Focused on high-performance tooling and machining systems for demanding applications.
Positioning contrast: KMT competes as a scaled, engineered tooling supplier with meaningful exposure to both machining tooling and wear-related applications. While Sandvik/ISCAR/Walter compete heavily in machining inserts and tool systems, KMT’s differentiated strength is often expressed through application-driven performance across a broad product set and through participation in wear applications where qualification and reliability matter—rather than competing as a narrow commodity tooling provider.

šŸš€ Multi-Year Growth Drivers

Over a 5–10 year horizon, the most durable drivers are those that sustain tool consumption and upgrade product mix:
  • Productivity and efficiency in machining: Manufacturers continue shifting toward higher material removal rates, longer tool life, and improved surface integrity to lower total manufacturing cost.
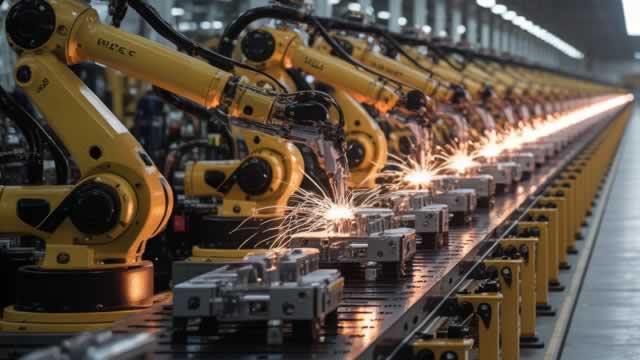
  • Industrial automation and precision requirements: More advanced machining processes increase demand for engineered tool geometries, grades, and coatings.
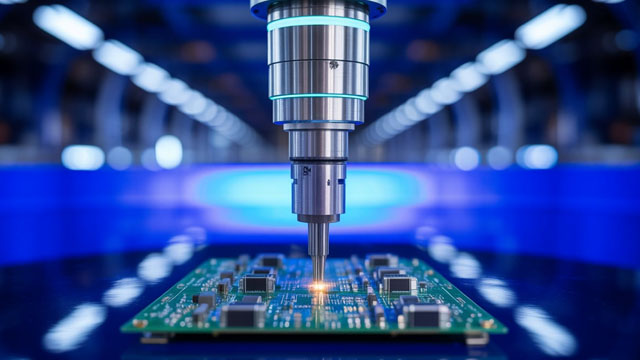
  • Electrification and energy transition supply chain: Growth in components for power electronics, transportation, and grid infrastructure supports machine tool activity and replacement tooling.
  • Industrial reshoring and capacity additions: New capacity ramps tend to lift tooling consumption during both build-out and steady-state production.
  • Wear part demand in heavy industry: Replacement cycles in mining/heavy wear environments remain structurally tied to equipment utilization and maintenance needs.
TAM expansion largely comes from (1) share shifts from less engineered solutions to higher-performance tooling and (2) continued replacement demand as industrial assets operate across cycles.

⚠ Risk Factors to Monitor

Key structural risks include:
  • Demand cyclicality and inventory dynamics: Tooling and industrial wear parts track industrial output; customer destocking can compress volumes.
  • Commodity and input-cost volatility: Hard materials (including tungsten/cobalt supply chains) and related manufacturing inputs can pressure margins without offsetting pricing power.
  • Pricing pressure and mix risk: Industry downturns can lead to discounting and share loss toward lower-cost or less engineered offerings.
  • Execution risk in restructuring and capacity alignment: Tooling businesses require ongoing investment and operational excellence; missteps can impair cost structure and service levels.
  • Technology displacement at the process level: Manufacturing methods (e.g., alternative cutting processes, advanced coatings, additive or hybrid machining techniques) can change tool requirements over time.
  • Customer concentration and qualification lock-in reversal: While qualification supports stickiness, program changes by major customers can re-open selection processes.

šŸ“Š Valuation & Market View

KMT is typically valued by investors using EV/EBITDA or cyclically normalized earnings frameworks rather than pure growth multiples, reflecting tooling demand’s linkage to industrial production. What most moves the needle in valuation is:
  • Operating margin durability: evidence of sustained mix improvement and cost control through cycles.
  • Quality of earnings: pricing actions, resilience of tool replacement demand, and working-capital discipline.
  • Portfolio and mix: growth of higher-value engineered solutions versus exposure to more commoditized tooling.
A credible market view generally assumes normalized volumes and a stable manufacturing cost base, with upside tied to mix and share gains rather than purely to cyclical volume expansion.

šŸ” Investment Takeaway

Kennametal’s long-term investment case rests on defensible switching costs created by tooling qualification and performance validation, supported by engineered material and application know-how that is difficult to replicate quickly. The business converts an installed base of machining and wear equipment into repeat consumable demand, with multi-year opportunity concentrated in higher-performance product mix and productivity-driven tooling adoption—tempered by cyclicality and input-cost volatility.

⚠ AI-generated — informational only. Validate using filings before investing.

šŸ“° Market News & Coverage

15 Stories Available

Real-time institutional reporting and market updates for KMT.

zacks.com•2026-06-05

Why Is Kennametal (KMT) Down 21.1% Since Last Earnings Report?

Kennametal (KMT) reported earnings 30 days ago. What's next for the stock?

fool.com•2026-05-31

Kennametal Stock Is Up 50%. Here's What a $181 Million Fund Sale Could Mean

Kennametal delivers advanced tooling and materials for demanding industrial sectors, leveraging innovation and a global customer base.

prnewswire.com•2026-05-29

Kennametal Strengthens Balance Sheet & Enhances Liquidity

Actions extend debt maturities, preserve financial flexibility and support growth opportunities Raised additional $700 million liquidity through new 3-year term loan and expansion of existing revolving credit facility Additional liquidity supports near-term tungsten related working capital needs while preserving long-term flexibility Refinanced $300 million in bonds, extending maturities to 2036, as previously reported Transactions consistent with maintained investment grade credit rating profile PITTSBURGH, May 29, 2026 /PRNewswire/ -- Kennametal Inc. (NYSE: KMT) (the "Company") today announced a series of financing transactions designed to enhance liquidity, extend debt maturities and position the Company to capture near-term growth opportunities. The actions provide additional financial flexibility to support near-term tungsten related working capital needs while preserving flexibility to respond to future market developments.

zacks.com•2026-05-28

Here's Why Kennametal (KMT) is a Strong Value Stock

The Zacks Style Scores offers investors a way to easily find top-rated stocks based on their investing style. Here's why you should take advantage.

prnewswire.com•2026-05-27

Kennametal Inc. Announces Final Results and Expiration of Cash Tender Offer for Debt Securities

PITTSBURGH, May 27, 2026 /PRNewswire/ -- Kennametal Inc. (NYSE: KMT) (the "Company") today announced the final results and expiration of its previously announced cash tender offer (the "Tender Offer") to purchase any and all of the outstanding notes listed in the table below (the "Notes"). Capitalized terms used in this news release and not defined herein have the meanings given to them in the Offer to Purchase, dated May 19, 2026 (the "Offer to Purchase").

gurufocus.com•2026-05-26

Kennametal Inc. Announces Pricing Terms of Cash Tender Offer for Debt Securities

Kennametal Inc. Announces Pricing Terms of Cash Tender Offer for Debt Securities PR Newswire PITTSBURGH, May 26,

prnewswire.com•2026-05-26

Kennametal Inc. Announces Pricing Terms of Cash Tender Offer for Debt Securities

PITTSBURGH, May 26, 2026 /PRNewswire/ -- Kennametal Inc. (NYSE: KMT) (the "Company") today announced the pricing terms of its previously announced cash tender offer (the "Tender Offer") to purchase any and all of its outstanding 4.625% Senior Notes due 2028 (the "2028 Notes"). All other terms and conditions of the Tender Offer remain unchanged and are described in the Offer to Purchase, dated May 19, 2026 (the "Offer to Purchase").

prnewswire.com•2026-05-19

Kennametal Inc. Announces Public Offering of Senior Notes and Cash Tender Offer for Debt Securities

PITTSBURGH, May 19, 2026 /PRNewswire/ --Ā Kennametal Inc. (NYSE: KMT) (the "Company") today announced that it has commenced an underwritten public offering of senior notes (the "Notes Offering"). The exact amount and terms of the Notes Offering will depend upon market conditions and other factors.

gurufocus.com•2026-05-18

Kennametal to Attend KeyBanc Capital Markets 2026 Industrials & Basic Materials Conference

Kennametal to Attend KeyBanc Capital Markets 2026 Industrials and Basic Materials Conference PR Newswire PITTSBURG

prnewswire.com•2026-05-18

Kennametal to Attend KeyBanc Capital Markets 2026 Industrials & Basic Materials Conference

PITTSBURGH, May 18, 2026 /PRNewswire/ -- Kennametal Inc. (NYSE: KMT) announced today that they will attend the KeyBanc Capital Markets 2026 Industrials & Basic Materials Conference in Boston. Details of the conference are as follows: When: Ā  Wednesday, May 27, 2026 Ā  Attendees: Sanjay Chowbey, President and Chief Executive Officer Patrick Watson, Vice President and Chief Financial Officer MichaelĀ Pici, Vice President, Investor Relations About Kennametal With over 85 years as an industrial technology leader, Kennametal Inc. delivers productivity to customers through materials science, tooling and wear-resistant solutions.

marketbeat.com•2026-05-11

Kennametal Q3 Earnings Call Highlights

Kennametal NYSE: KMT raised its fiscal 2026 sales and adjusted earnings outlook after reporting stronger-than-expected third-quarter results, as higher tungsten-related pricing, modest volume improvement and share gains across key markets lifted revenue and margins.

zacks.com•2026-05-08

KMT or SDVKY: Which Is the Better Value Stock Right Now?

Investors interested in Manufacturing - Tools & Related Products stocks are likely familiar with Kennametal (KMT) and Sandvik AB (SDVKY). But which of these two stocks is more attractive to value investors?

zacks.com•2026-05-08

Here's Why Kennametal (KMT) is a Strong Value Stock

The Zacks Style Scores offers investors a way to easily find top-rated stocks based on their investing style. Here's why you should take advantage.

zacks.com•2026-05-07

Kennametal Q3 Earnings Beat Estimates on Pricing and Volume

KMT beats Q3 fiscal 2026 estimates as sales jump 22%, margins expand and Earthworks, Energy and Aerospace demand stay strong.

247wallst.com•2026-05-07

Here Are Thursday’s Top Wall Street Analyst Research Calls: Alcoa, Chiron Real Estate, Clear Secure, Fortinet, Fresh Pet, Kennametal, Oracle, PayPal, United Therapeutics, and More

Pre-Market Stock Futures: Futures are trading modestly higher after a blowout midweek rally spurred by reports that a peace agreement with Iran could be forthcoming soon and by incredible technology earnings and forecasts that destroyed Wall Street estimates. All of the major indices were once again printing new highs as investors cheered the potential for... Here Are Thursday's Top Wall Street Analyst Research Calls: Alcoa, Chiron Real Estate, Clear Secure, Fortinet, Fresh Pet, Kennametal, Oracle, PayPal, United Therapeutics, and More

šŸ“Š AI Financial Analysis

Powered by StockMarketInfo
Earnings Data: Q Ending 2026-03-31

"KMT reported Q3 2026 results with Revenue of $592.6M and Net Income of $58.2M (EPS $0.76). Versus the same quarter last year (2025-03-31), revenue increased +21.9% YoY and net income increased +84.9% YoY. Sequentially versus the prior quarter (2025-12-31), revenue rose +11.9% QoQ and net income rose +71.8% QoQ. Profitability strengthened: gross margin expanded to 34.8% from 32.8% (QoQ) and 32.1% (YoY), while net margin improved to 9.8% from 6.4% (QoQ) and 6.5% (YoY). Operating income margin also moved up to 13.4% (from 10.4% QoQ and 9.1% YoY). Cash flow quality softened this quarter. Operating cash flow was slightly negative (-$2.9M) and free cash flow was -$20.9M, despite higher earnings—suggesting a working-capital or non-cash drag in Q3. Shareholder returns look strong: the stock is up 106.9% over the past 1 year, indicating strong capital appreciation. The company continued dividends (-$22.4M) and modest buybacks ($10.7M). Balance sheet resilience appears intact: cash was $106.9M, total assets were $2.73B, and equity increased to $1.40B. Leverage remains moderate (debt/equity ~0.44). Overall, sentiment and momentum appear favorable, supported by improved margins and earnings acceleration."

Revenue Growth

Strong

Revenue accelerated to $592.6M (+11.9% QoQ from $529.5M; +21.9% YoY from $486.4M).

Profitability

Strong

Margins expanded materially: gross margin 34.8% (vs 32.8% QoQ, 32.1% YoY) and net margin 9.8% (vs 6.4% QoQ, 6.5% YoY). Net income +71.8% QoQ and +84.9% YoY.

Cash Flow Quality

Caution

Earnings did not convert to cash this quarter: operating cash flow was -$2.9M and free cash flow was -$20.9M, despite higher net income.

Leverage & Balance Sheet

Positive

Equity increased to $1.40B (from $1.36B QoQ). Leverage is moderate (debt/equity ~0.44) with total assets up to $2.73B.

Shareholder Returns

Strong

Strong total return drivers: price is up 106.9% YoY (>20% momentum). Dividends continue (-$22.4M) and buybacks were modest ($10.7M).

Analyst Sentiment & Valuation

Positive

Consensus target (36) vs last price (~38.95) implies modest upside/roughly fair-to-slightly-over target. Valuation multiples remain elevated (e.g., P/E ~11.8 in the provided ratios), but momentum is strong.

Disclaimer:This analysis is AI-generated for informational purposes only. Accuracy is not guaranteed and this does not constitute financial advice.

Fundamentals Overview

Loading fundamentals overview...

KMT’s Q3 FY26 performance was strong versus both sales and EPS outlook, driven primarily by tungsten-linked pricing and tariff surcharges plus volume improvements. Adjusted EPS rose to $0.77 from $0.47, while adjusted EBITDA margin expanded to 20.8% from 17.9%, with Infrastructure margin up 680 bps YoY and Metal Cutting up 160 bps YoY. The core economic paradox is that income statement benefits arrived faster than cash: free operating cash flow YTD fell to $18m from $63m due to a ninefold magnitude tungsten price increase, lifting primary working capital to $819m (32.4% of sales). Management maintained a competitive advantage via vertical integration and secure tungsten sourcing as competitors struggled with raw materials and longer lead times, enabling share capture—especially in Infrastructure earthworks and aerospace/defense. Guidance was raised: FY26 sales $2.33–$2.35b and adjusted EPS $3.75–$4, with Q4 net price/tariff surcharges targeted at ~35%. However, management slowed facility closures to prioritize growth, and continued to pause buybacks pending tungsten stabilization.

AI IconGrowth Catalysts

  • Infrastructure: earthworks volume growth driven by strong product performance, secure tungsten sourcing versus competitors in a constrained supply environment
  • Defense business: large orders in aerospace & defense supporting growth into fiscal 2027
  • Metal cutting: share gains with key accounts in aerospace & defense and momentum in energy tied to AI power generation wins
  • General engineering: new customer wins via targeted promotional campaigns and improved digital customer experience for small-to-medium customers
  • Vertical integration/tungsten supply control capturing business when competitors extend lead times or turn away orders

Business Development

  • Data center power generation wins (Energy end-market demand driver referenced within Metal Cutting)
  • Aerospace & defense penetration with tier suppliers (share gains attributed to deeper supplier penetration)
  • Earthworks underground mining share gain within Infrastructure (customers unable to source product elsewhere)

AI IconFinancial Highlights

  • Q3 exceeded sales and EPS outlook; EPS benefited from additional price/raw timing of $0.09, favorable volume, and lower-than-anticipated tax rate
  • Adjusted EPS: $0.77 vs $0.47 prior year quarter
  • Adjusted EBITDA margin: 20.8% vs 17.9% prior year quarter
  • Sales: +19% organically year-over-year (reported sales +22% YoY with +5% FX, partially offset by divestiture effects)
  • Margin bridge detail: Infrastructure operating margin up 680 bps YoY to 18.3% (driven by $39m favorable price vs raw timing plus $2m restructuring savings, partially offset by higher comp and $8m non-repeat manufacturing tax credit); Metal Cutting operating margin up 160 bps YoY to 11.2% (primarily higher price/tariff surcharges, higher volumes, and ~$5m restructuring savings, partially offset by higher comp, tariffs/inflation, and higher raw material)
  • EPS bridge detail: +$0.36 YoY from ~$39m favorable price/raw timing, price & tariff surcharges, higher volumes, and +$7m restructuring benefits; headwind of $0.08 from non-repeat of prior-year advanced manufacturing tax credit; +$0.02 transaction gains from preferential Bolivia exchange rates
  • Working capital/cash impact: Free operating cash flow YTD $18m vs $63m prior year period; adversely impacted by higher working capital from higher tungsten prices; primary working capital up to $819m vs $654m (32.4% of sales)

AI IconCapital Funding

  • Share repurchases: management decided not to repurchase shares in the current environment due to magnitude of tungsten-driven working capital/valuation pressure
  • Dividends: returned $15m to shareholders in the quarter
  • Buyback authorization usage: repurchased $70m or ~3m shares since inception-to-date under $200m authorization
  • Liquidity: cash + revolver availability approx. $742m at quarter end; within financial covenants
  • Capex: net capital expenditures $52m in Q3 vs $67m prior year quarter; FY26 capex now anticipated approx. $85m
  • FY26 free operating cash flow expected approx. negative 30% of adjusted net income

AI IconStrategy & Ops

  • Prioritizing growth opportunities over restructuring initiatives; shifting the timeline for facility closure actions previously planned to complete in FY27
  • Still targeting ~$110m cost takeout savings by end of FY27, which is $10m above Investor Day outline
  • Tungsten supply chain actively managed; secure source of tungsten used as competitive advantage in constrained market

AI IconMarket Outlook

  • FY26 updated outlook: Sales between $2.33b and $2.35b; volume growth 2% to 3%; net price + tariff surcharge ~16%; FX tailwind ~2%
  • Q4 FY26 price/cost: net price and tariff surcharges combined expected ~35% compared to prior year quarter
  • FY26 adjusted EPS outlook: $3.75 to $4.00; includes ~$2.45 of EPS related to timing of price/raw benefit from tungsten rise (increased $1.50 vs prior outlook)
  • EPS/tungsten framing: Q2 approx. $0.16 and Q3 $0.39 of price/raw timing benefit; implied remaining balance ā€œforced outā€ in Q4 (analyst math confirmed by management as reference points)
  • FY27 framework: management assumes tungsten prices remain elevated for some period; expects price carryover as Q4 at elevated level laps through FY27; price/raw timing benefits continue through first half FY27 with bulk occurring in Q1

AI IconRisks & Headwinds

  • Tungsten supply constraints causing working capital pressure and negative free operating cash flow (primary working capital increased to 32.4% of sales; FOCF YTD down to $18m)
  • Highly competitive tungsten/material market for sourcing; potential volatility and uncertainty in tungsten pricing dynamics
  • Tariff exposure remains; management stated they are not taking hasty action on refunds despite IEEPA being struck down; continues to monitor
  • Restructuring timeline slowed due to growth opportunities; may impact cost-out cadence versus prior plans
  • EMEA volume lag persists; volumes strengthening in Americas and Asia Pacific while EMEA continues to lag (consistent with PMI/industrial production data)

Q&A: Analyst Interest

  • Tungsten pricing/tailwind math: Management confirmed FY26 aggregate EPS includes ~$2.45 related to price/raw timing and discussed quarterly back-solving, referencing Q2 ~$0.16, Q3 ~$0.39, and that remaining portion is effectively pulled into Q4; emphasized dynamic management and goal to fully offset tungsten cost implication.
  • Metal Cutting vs Infrastructure pass-through and timing: Management explained Infrastructure typically captures pricing faster because many customers are on index-price basis and pricing moves quicker; Metal Cutting has a 3–6 month lag tied to list-price changes and different tungsten content across products, affecting observed growth.
  • Share repurchase and cash flow reversal timing: Management stated tungsten-related inventory/valuation builds drive negative free operating cash flow in FY26 and that cash normalization typically occurs one to two quarters after a tungsten change; resumption requires stabilization/clarity on where tungsten is headed, given current market dynamism.

Sentiment: POSITIVE

Note: This summary was synthesized by AI from the KMT Q3 2026 earnings transcript. Financial data is complex; please verify all metrics against official SEC filings before making investment decisions.

šŸ“‹ Official Regulatory 10-K / 10-Q SEC Filings

Direct authenticated documentation links to audited SEC database reports for KMT.

SEC EDGAR Live Feed
Loading financial data and tables...
šŸ“

SEC Filings (KMT)

Ā© 2026 Stock Market Info — Kennametal Inc. (KMT) Financial Profile