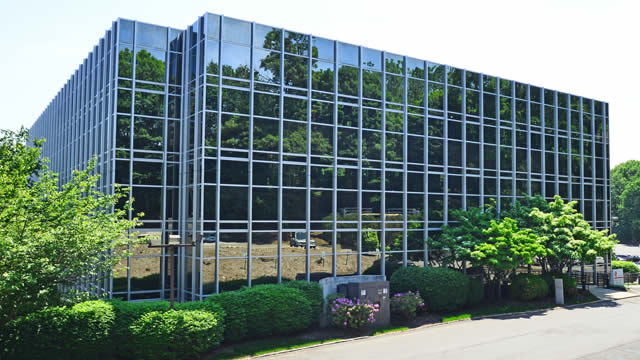
Lineage, Inc.

Lineage, Inc. (LINE) Market Cap

Lineage, Inc. has a market capitalization of $9.65B.

Price: $42.37

-0.48 (-1.12%)

Market Cap: 9.65B

NASDAQ · time unavailable

CEO: W. Gregory Lehmkuhl

Sector: Real Estate

Industry: REIT - Industrial

IPO Date: 2024-07-25

Website: https://www.onelineage.com

Lineage, Inc. (LINE) - Company Information

Market Cap: 9.65B|Sector: Real Estate

Company Profile

Lineage, Inc. operates as a real estate investment trust (REIT) primarily focused on temperature-controlled warehouse properties. Its business activities are organized into two main divisions: Global Warehousing and Global Integrated Solutions. The Global Warehousing segment manages a portfolio of industrial real estate assets that provide refrigerated and frozen storage services to its customers. The Global Integrated Solutions segment, in contrast, specializes in delivering tailored cold-chain logistics services. This company was established in 2008 and has its corporate headquarters situated in Novi, Michigan.

Analyst Sentiment

49%
Hold

From 20 Active Polls

1Y Forecast: $44.38

▲ +4.7% Potential Upside

Consensus Target Metrics

Low Bound

$35

Median

$46

High Bound

$47

Average

$44

Price & Moving Averages

Loading chart...

🎯 Wall Street Analyst Intelligence Report

1-Year structural target targets, chart projections, and sentiment maps.

Average 1Y Target
$44.38
▲ +4.74% Upside
Low Target
$35.00
-17% Risk
Median Target
$45.50
7% Mid
High Target
$47.00
11% Max
Consensus
Hold
4 / 16 Buys

Consensus Trend Projection

Trailing closures vs. 12-month metrics map.

Analyst Vote Distribution

Aggregate institutional coverage sentiment weights.

📊 Historical Valuation Multiples

Real-time Trailing Twelve Month (TTM) momentum side-by-side with discrete quarterly metrics.

Fiscal QuarterTTMQ1 2026Q4 2025Q3 2025Q2 2025Q1 2025Q4 2024Q3 2024Q2 2024
Period EndingTrailing 12MMar 31, 2026Dec 31, 2025Sep 30, 2025Jun 30, 2025Mar 31, 2025Dec 31, 2024Sep 30, 2024Jun 30, 2024
Market Cap ($M)9,6477,4377,9808,8109,96613,36813,35416,46013,086
Enterprise Value ($M)17,77415,56416,57116,63117,56220,25920,05923,04024,322
Price to Earnings Ratio (P/E)-68.35-45.50332.70-21.95-415.271665.63-47.23-8.48-48.08
Price/Earnings-to-Growth Ratio (PEG)-10.98-92.50-157.64-63.85
Price to Sales Ratio (P/S)1.805.735.976.407.3810.359.9712.339.78
Price to Book Ratio (P/B)1.190.920.971.051.151.561.551.822.68
Price to Free Cash Flow Ratio (P/FCF)63.05-135.21102.31251.71104.91-1113.97256.81498.78-422.14
Enterprise Value to Sales (EV/Sales)12.0012.4012.0813.0115.6814.9817.2618.18
Enterprise Value to EBITDA (EV/EBITDA)13.0956.8028.6278.0860.1467.98102.34-85.3378.71
Debt to Equity Ratio5.981.011.050.940.890.830.800.772.32

📘 Full Research Report

ℹ️

AI-Generated Research: This report is for informational purposes only.

📘 LINEAGE INC (LINE) — Investment Overview

🧩 Business Model Overview

LINEAGE operates temperature-controlled logistics infrastructure—primarily cold storage warehouses—serving food, consumer, and healthcare supply chains. The business converts owned or leased space and refrigeration capacity into customer “throughput,” supported by standardized facility operations across multiple temperature ranges. Value is created through (1) maintaining reliable temperature integrity, (2) offering flexible space allocation and operational scheduling, and (3) bundling warehouse services with inventory management and transportation-adjacent workflows (e.g., receiving, storage, handling, and shipment coordination).

Customer stickiness typically comes from operational dependency: once a shipper’s inventory workflow, compliance requirements, and delivery cadence are established in a facility network, switching to an alternative operator usually requires reconfiguring handling processes, cold-chain validation protocols, and logistics routing—raising both cost and execution risk.

💰 Revenue Streams & Monetisation Model

Revenue is largely driven by contracted cold storage capacity and usage-based services. Core monetisation includes:

  • Storage revenue (capacity rental): Predominantly recurring as customers lease space by volume and duration. This component benefits from relatively predictable demand tied to seasonal food supply and recurring distribution cycles.
  • Value-added logistics services: Handling, order preparation, inbound/outbound management, and coordination services that scale with warehouse throughput.
  • Ancillary services: Where offered, transportation coordination and compliance-oriented handling can add margin versus pure pallet/rack rental.

Margin drivers are utilization and operating efficiency. Higher throughput with disciplined labor and refrigeration management tends to improve absorption of fixed costs, while service mix can lift profitability through greater labor productivity and better capacity monetisation. Energy management is a structural input cost given the refrigeration-heavy model.

🧠 Competitive Advantages & Market Positioning

LINEAGE’s competitive position rests on a combination of switching costs, scale-based cost advantages, and network depth that make capacity displacement difficult.

  • Switching costs (operational and compliance gravity): Temperature-controlled warehousing is not interchangeable. Customers face execution risk from requalifying facilities, reestablishing SOPs, and altering routing and inventory handling. These frictions raise the effective cost of switching and tend to reduce churn.
  • Scale and utilization economics: Large networks can source equipment and maintenance more efficiently, attract better staffing density, and operate facilities with steadier utilization—improving per-unit cost performance.
  • Capital intensity and execution capability: Cold storage infrastructure requires substantial development capital and expertise in refrigeration systems, site selection, and regulatory-compliant operations. Competitors must clear both financial and technical hurdles to replicate capacity quickly.

Competitive benchmarking (industry peers):

  • Americold Realty Trust: A major independent operator with a large footprint in temperature-controlled logistics. Both companies compete for similar shipper categories, but LINEAGE’s strategic emphasis is on building a dense, multi-temperature network and bundling operational services across customers’ distribution needs.
  • Nichirei Logistics Group: A prominent cold-chain provider with strong presence and capability in refrigerated logistics. Nichirei competes more directly where its footprint is concentrated, while LINEAGE competes broadly through facility network coverage and scale economics in target geographies.
  • Cold-storage offerings embedded within large 3PLs (e.g., DHL Supply Chain / other global logistics providers): These players can bid aggressively for integrated logistics contracts. LINEAGE’s advantage tends to be higher specialization in storage operations and the ability to deliver capacity with consistent cold-chain standards at network scale.

🚀 Multi-Year Growth Drivers

Over a 5–10 year horizon, demand for temperature-controlled capacity is supported by structural trends that expand the total addressable market and raise the need for modern, efficient infrastructure:

  • Cold-chain penetration and service reliability: Food safety expectations and more stringent handling requirements push shippers toward professionally managed storage networks.
  • Growth in protein, specialty foods, and healthcare logistics: Higher volumes in refrigerated categories and expanding pharmaceutical distribution increase the need for consistent temperature-controlled capacity.
  • Retail distribution complexity and e-commerce fulfillment: Shorter delivery cycles and fragmented fulfillment increase warehouse touches and require flexible cold storage capacity.
  • Facility modernization capex cycle: Older storage assets with less efficient refrigeration systems and dated compliance capabilities face replacement or retrofitting, favoring operators with development execution.
  • Network expansion with disciplined returns: New facilities and incremental capacity additions can translate long-run contracted demand into volume and improve utilization dynamics.

⚠ Risk Factors to Monitor

  • Energy and refrigeration cost risk: Electricity and refrigerant-related expenses can pressure margins, particularly during periods of high input costs or regulatory changes affecting refrigerants.
  • Capital intensity and development execution: Expanding or upgrading capacity requires significant investment and disciplined construction timelines; cost overruns or underutilization can impair returns.
  • Competitive pricing and utilization swings: Oversupply in certain metros can lead to rent pressure if customers shift volumes to newly opened facilities.
  • Tenant credit and contract structure: A concentration of demand from larger customers or weak tenant credit can elevate loss exposure or renewal risk, depending on contract terms.
  • Regulatory and environmental compliance: Safety, environmental, and operational standards for temperature-controlled facilities can increase ongoing compliance costs.

📊 Valuation & Market View

The market often values LINEAGE within a logistics/real-asset framework, typically emphasizing cash-flow durability rather than pure growth narrative. Common valuation approaches include EV/EBITDA and REIT-adjacent metrics (e.g., P/FFO or NOI-based thinking), with the following focus areas:

  • Utilization and same-facility cash flow resilience: Occupancy and throughput trends influence earnings power and credit perception.
  • Contracting discipline and rent growth mechanisms: Lease terms, duration, escalators, and the mix of contracted storage versus services shape revenue stability.
  • Capex efficiency and development returns: New capacity must convert into sustainable utilization to avoid margin dilution from construction or ramp costs.
  • Operating cost control (energy, labor, maintenance): Demonstrated efficiency can differentiate returns versus peers with similar footprints.

🔍 Investment Takeaway

LINEAGE’s long-term investment case is anchored in defensible cold-chain infrastructure economics: switching costs driven by operational and compliance gravity, scale-based cost advantages from a dense network, and capital intensity that slows capacity replication. With structurally growing demand for temperature-controlled logistics and continued modernization needs across the supply chain, LINEAGE is positioned to compound cash flows if it maintains utilization discipline and controls energy and operating costs.


⚠ AI-generated — informational only. Validate using filings before investing.

📰 Market News & Coverage

15 Stories Available

Real-time institutional reporting and market updates for LINE.

prnewswire.com2026-07-29

PREFORMED LINE PRODUCTS ANNOUNCES RECORD SECOND QUARTER 2026 FINANCIAL RESULTS

CLEVELAND, July 29, 2026 /PRNewswire/ -- Preformed Line Products Company (NASDAQ: PLPC) today reported record financial results for its second quarter of 2026. Q2 2026 highlights: Record quarterly net sales of $212.7 million, an increase of 25% from Q2 2025 and 21% from Q1 2026.

globenewswire.com2026-07-29

VALUE LINE, INC. ANNOUNCES HIGHER FISCAL YEAR 2026 EARNINGS

NEW YORK, July 29, 2026 (GLOBE NEWSWIRE) -- Value Line, Inc., (NASDAQ: VALU) reported results for the fiscal year ended April 30, 2026.

globenewswire.com2026-07-23

Aurora Mobile's GPTBots.ai Enhances Customer Service Solution with Audio Agent and LINE Plugin 2.0

SINGAPORE, July 23, 2026 (GLOBE NEWSWIRE) -- Aurora Mobile Limited (NASDAQ: JG) ("Aurora Mobile" or the "Company"), a leading provider of customer engagement and marketing technology services, announced enhancements to the customer service solution on GPTBots.ai, its enterprise-grade AI agent platform. GPTBots.ai Audio Agent now supports SIP connectivity via Twilio for integration with enterprise telephony infrastructure. LINE Customer Service Plugin 2.0 updates the agent workspace and adds notification capabilities for service teams.

globenewswire.com2026-07-17

VALUE LINE, INC. DECLARES A QUARTERLY CASH DIVIDEND OF $0.35 PER COMMON SHARE AND RENEWS STOCK REPURCHASE PROGRAM

NEW YORK, July 17, 2026 (GLOBE NEWSWIRE) -- Value Line, Inc. (NASDAQ – VALU ) announced today that its Board of Directors declared on July 17, 2026 a quarterly cash dividend of $0.35 per common share, payable on August 11, 2026, to stockholders of record on July 27, 2026. The Company has 9,383,573 shares of common stock outstanding as of July 17, 2026.

marketbeat.com2026-07-14

Lineage Cell Therapeutics Maps COR1 Path With ‘Thaw and Inject' Cell Therapy Plan

Lineage Cell Therapeutics NYSEAMERICAN: LCTX used a conference call to outline its manufacturing strategy and development plans for COR1, a wholly owned preclinical cell transplant program being developed as a potential treatment for corneal endothelial disease.

businesswire.com2026-07-13

Lineage Provides Update on COR1 Cell Therapy Program for Corneal Endothelial Disease

CARLSBAD, Calif.--(BUSINESS WIRE)---- $LCTX #LineageCellTherapeutics--Lineage Cell Therapeutics, Inc. (NYSE American and TASE: LCTX), a clinical-stage biotechnology company developing novel, allogeneic, “off the shelf”, cell therapies for serious medical conditions, today provided an update on COR1, the Company's allogeneic corneal endothelial cell (CEnC) transplant program, in preclinical development for the treatment of corneal endothelial disease. With COR1, Lineage is deploying its ophthalmology and cell manufacturing expert.

seekingalpha.com2026-07-09

Lineage: Don't Mistake A Cyclical Slump For A Broken Business

Lineage remains a Buy, offering a margin of safety and re-rating potential despite near-term macro and operational headwinds. Q1 saw AFFO per share decline 9.3% to $0.78, but guidance for Adj. EBITDA ($1.25–$1.3B) and AFFO per share ($2.75–$3.00) were maintained. LINE's cost reduction plan and automation investments target $110M annualized EBITDA improvement in 3–5 years, supporting long-term upside.

globenewswire.com2026-07-08

Grand Design RV Unveils the All-New Lineage Series E, Redefining Innovation in Motorized RV Travel

MIDDLEBURY, Ind., July 08, 2026 (GLOBE NEWSWIRE) -- Grand Design RV, the fast-growing innovator of travel trailers, 5th wheels and motorized RVs, today announced the launch of the all-new Lineage series E, expanding its award-winning motorized portfolio with a new Class C motorhome designed to deliver premium comfort, practical functionality and confidence on the road. Built on the dependable Ford® E-450 chassis, the Series E brings Grand Design's owner-focused approach to one of the most established and accessible segments of the motorized RV market.

accessnewswire.com2026-07-07

Linear Provides Update on Proposed Acquisition of Critical Prospecting Corp

NOT FOR DISTRIBUTION TO UNITED STATES NEWSWIRE SERVICES OR FOR DISSEMINATION IN THE UNITED STATES VANCOUVER, BC / ACCESS Newswire / July 7, 2026 / Linear Minerals Corp. (CSE:LINE)(OTCID:LINMF) (WKN:A40Y3E) ("Linear" or the "Company") is pleased to provide an update on its previously announced letter of intent (the "LOI") to acquire all of the issued and outstanding securities of Critical Prospecting Corp. initially announced in the Company's news release dated May 21, 2026. The Company confirms that it continues to work towards completing the proposed acquisition of certain mineral properties (the "Properties") from Critical Prospecting Corp. (the "Vendor").

businesswire.com2026-07-07

Lineage to Report Second-Quarter 2026 Financial Results on August 5, 2026

NOVI, Mich.--(BUSINESS WIRE)--Lineage, Inc. (NASDAQ: LINE), announced that it will report its financial results for the second quarter of 2026 on Wednesday, August 5, 2026, before market open. A conference call to discuss these results has been scheduled for 8:00 a.m. Eastern Time on Wednesday, August 5, 2026. A live webcast of the call will be available on the Lineage Investor Relations website at ir.onelineage.com. An audio replay of the conference call will be available for one week followin.

businesswire.com2026-07-06

Lineage Cell Therapeutics to Present at B. Riley Securities 2026 Mind, Muscle & Vision Healthcare Summit

CARLSBAD, Calif.--(BUSINESS WIRE)---- $LCTX #LineageCellTherapeutics--Lineage Cell Therapeutics, Inc. (NYSE American and TASE: LCTX), a clinical-stage biotechnology company developing “off the shelf” allogeneic cell therapies for serious medical conditions, today announced that Brian M. Culley, Lineage's Chief Executive Officer, will be presenting at the B. Riley Securities 2026 Mind, Muscle & Vision Healthcare Summit, in a fireside chat hosted by Mayank Mamtani, Senior Managing Director, Group Head of Healthcare Research an.

fool.com2026-06-26

Lineage vs. Rexford Industrial Realty: Which Real Estate Stock Is a Better Buy in 2026?

Lineage operates a massive temperature-controlled logistics network across three continents. Rexford Industrial Realty maintains a high-density portfolio focused exclusively on Southern California.

seekingalpha.com2026-06-25

Lineage: Another Serious Fire Could Spell Trouble

Lineage Logistics faces significant operational and financial risks after two catastrophic fires at major cold storage facilities. Recent fires have led to lawsuits, public health concerns, and potential long-term brand damage, particularly in Los Angeles. Immediate costs include emergency relief and remediation, while longer-term impacts may include higher insurance premiums and increased operating expenses.

prnewswire.com2026-06-18

PREFORMED LINE PRODUCTS ANNOUNCES QUARTERLY DIVIDEND

CLEVELAND, June 18, 2026 /PRNewswire/ -- The Board of Directors of Preformed Line Products (Nasdaq: PLPC) on June 6, 2026, declared a regular quarterly dividend in the amount of $0.21 per share on the Company's common shares, payable July 20, 2026, to shareholders of record at the close of business on July 1, 2026. ABOUT PLP PLP protects the world's most critical connections by creating stronger and more reliable networks.

prnewswire.com2026-06-17

LAIRD SUPERFOOD® EXPANDS PRODUCT LINE AT TARGET TO INCLUDE FUNCTIONAL MUSHROOM COFFEES

Nationwide Target Distribution Gives Consumers Access to Both PERFORM and DEFEND Functional Mushroom Coffees for Improved Mental Clarity and Sustained Energy BOULDER, Colo., June 17, 2026 /PRNewswire/ -- Laird Superfood, Inc. (NYSE American: LSF), a leader in functional coffee, creamers, and superfood products made with simple, minimally processed ingredients, has expanded its offerings at Target stores nationwide to include Organic PERFORM Functional Mushroom Coffee and DEFEND Functional Mushroom Coffee.

📊 AI Financial Analysis

Powered by StockMarketInfo
Earnings Data: Q Ending 2026-03-31

"LINE reported Q1 2026 revenue of $1.30B and net income of -$46M (EPS: -$0.18), compared with net income of $6M in Q4 2025. Revenue was -3.0% QoQ ($1.30B vs $1.34B) and +0.4% YoY ($1.297B vs $1.292B). Profitability deteriorated: operating income was $36M in Q1 2026 versus $138M in Q4 2025, and net margin swung to -3.5% from +0.4% QoQ. Over the broader 4-quarter run (Q1 2025–Q1 2026), margins were volatile, moving from near-flat Q1 2025 (net income ~$0) to losses in Q2/Q3 2025, a rebound in Q4 2025 (net income +$6M), and then a reversion to losses in Q1 2026. Cash flow remained positive at the operating line: operating cash flow was +$130M in Q1 2026, but free cash flow turned negative (-$55M) due to ~$185M of capex. The company continues to pay dividends ($133M in Q1 2026), which is meaningful relative to earnings but softened in coverage given negative FCF. Shareholder returns appear weak: the stock is at $37.69 with 1Y change of -31.34%. No buyback activity was reported in the latest quarter. Price momentum thus does not support a premium valuation."

Revenue Growth

Neutral

Revenue was -3.0% QoQ (1.297B vs 1.336B) and +0.4% YoY (1.297B vs 1.292B), indicating largely flat demand.

Profitability

Neutral

Net income swung to -$46M in Q1 2026 from +$6M in Q4 2025. Net margin was -3.5% vs +0.4% QoQ, showing margin contraction and negative EPS (-$0.18).

Cash Flow Quality

Caution

Operating cash flow stayed positive at +$130M, but free cash flow was -$55M after ~$185M capex. Dividends were paid (-$133M) despite losses, implying weaker near-term coverage.

Leverage & Balance Sheet

Neutral

Balance sheet equity is relatively stable around ~$9.1B total equity (Q1 2026) vs ~$9.2B (Q4 2025). Leverage remains moderate with total debt ~$1.80B, and cash is ~$67M.

Shareholder Returns

Neutral

1Y stock change is -31.34% with ~1.8% dividend yield (per latest ratios). No buybacks were reported in Q1 2026, so total return momentum is negative.

Analyst Sentiment & Valuation

Neutral

Street consensus target ($37.88) is roughly in line with the current price ($37.69). With negative earnings and elevated uncertainty, valuation support is limited.

Disclaimer:This analysis is AI-generated for informational purposes only. Accuracy is not guaranteed and this does not constitute financial advice.

Fundamentals Overview

Loading fundamentals overview...

Lineage’s Q1 2026 showed stabilization but not clean normalization. The quarter beat expectations with adjusted EBITDA up 3.3% YoY to $314m, while AFFO per share fell 9.3% to $0.78 due to the expiration of prior-year interest rate hedges—effectively flat on an adjusted comparable basis. Operating metrics remain mixed: physical occupancy was 76.4% (-290 bps sequentially) and same-store NOI declined 0.9% YoY, though that was better than prior trends. Revenue rate improved (+2.2% YoY rent/storage/blast per pallet) and GIS NOI margin rose 190 bps to 18.3%, but throughput stayed pressured as container volumes fell 17% YoY. Management reiterated full-year guidance (same-store NOI contraction -4% to -1%, AFFO $2.75–$3) and highlighted Q2 drivers: FX benefit moderating to ~100 bps and admin expenses normalizing to ~$120m–$125m per quarter. Cost actions ($50m+ savings plan) and LinOS scaling (to at least 20 facilities) are key medium-term levers.

AI IconGrowth Catalysts

  • Value-added services uptake internationally supporting stronger mix and same-store rent/storage/blast growth (+2.2% YoY per physical pallet)
  • LinOS technology ramp at 11 conventional facilities; expected rollout to at least 20 facilities in 2026
  • Cost rationalization/productivity initiative targeting $110m OpEx savings (3- to 5-year target) and near-term administrative normalization
  • Expected net price increases of 1% to 2% in 2026
  • Potential demand upside from tariff resolution, normalizing food inflation, easing geopolitical uncertainty, expanding customer categories (candy/flowers), and lower interest rates

Business Development

  • Tyson referenced for fully automated warehouse development (automation scale proof point)
  • Bay Grove referenced as controlling ~70% of company shares under its purview (lock-up/overhang discussion)

AI IconFinancial Highlights

  • Q1 2026 total revenue flat YoY; adjusted EBITDA +3.3% YoY to $314m
  • AFFO $201m / $0.78 per share, -9.3% YoY; management attributes decline primarily to expiration of prior-year interest rate hedges (consistent with 2026 guidance); excluding impact, AFFO per share essentially flat
  • Same-store physical occupancy 76.4%, -290 bps sequentially; economic occupancy 82% with similar spread to physical occupancy
  • Same-store rent/storage/blast revenue per physical pallet +2.2% YoY for fourth consecutive YoY increase; throughput services per throughput pallet modestly more positive than expected (mix + strong international performance)
  • Same-store throughput softer: container volumes -17% YoY in Q1 (after -9% in Q4 2025), with import decline more pronounced due to Q1’25 pull-ahead pre-tariff actions
  • 0.9% same-store NOI decline YoY improved vs prior trends despite pressured throughput
  • Global Warehousing: total warehouse NOI +1.1% YoY to $364m; same-store NOI -0.9% YoY to $347m; same-store NOI benefited ~250 bps from favorable FX in Q1
  • GIS: NOI flat YoY at $57m; GIS NOI margin +190 bps YoY to 18.3% from improved margin mix after divesting a lower-margin international transportation business

AI IconCapital Funding

  • Total net debt $7.9b; total liquidity $1.6b
  • $600m debt maturities in 2026 described as manageable; flexibility via revolver/market access (U.S. and European public bond markets)
  • Adjusted net debt to transaction adjusted EBITDA (introduced last quarter) = 5.3x; reported leverage = 6.0x targeted to 5.0x–5.5x
  • Growth capital investment $130m in Q1; cumulative invested $1.2b into 22 facilities under construction/ramping; expect >$150m incremental EBITDA once stabilized

AI IconStrategy & Ops

  • Rightsizing guaranteed space to appropriate levels to stabilize occupancy trends via direct customer dialogue
  • Administrative expense timing benefit in Q1; management expects normalization to ~$120m to $125m per quarter for remainder of 2026
  • Cost initiative: remove $50m+ of administrative/indirect cost base; already executed actions; realize ~half in 2026 and full benefit in 2027; requires ~$15m upfront investment (tech + personnel transitions) recorded below EBITDA late-2026/into 2027
  • Supply management: idled 10 facilities in 2025 and planning additional idling in 2026

AI IconMarket Outlook

  • 2026 guidance reiterated: annual same-store NOI contraction -4% to -1%; AFFO $2.75 to $3 per share; total warehouse NOI -2% to +1%; GIS NOI growth 0% to 2%; adjusted EBITDA $1.25b to $1.30b
  • Q2 cadence assumptions: FX benefit reduced to ~100 bps vs ~250 bps in Q1; admin expenses ~$120m to $125m/quarter; modest seasonal occupancy decline from Q1 to Q2
  • Non-same-store: high teens millions of NOI in Q1 supporting progression toward ~$20m quarterly run rate as assets mature
  • Expected fully diluted share count: 260m in Q2 and 259m for full-year (unchanged)

AI IconRisks & Headwinds

  • Elevated new supply and trade-related challenges persist; limited portion of portfolio managing near-term supply imbalance
  • Throughput pressure from lower import/export container volumes: -17% YoY in Q1 after -9% in Q4 2025
  • Tariff actions/history: difficult Q1’25 comp due to import pull-ahead prior to tariff actions last April
  • Administrative expense timing created Q1 beat; normalizing costs may pressure subsequent quarters if savings/execution pacing differs
  • International mix improvements may be partly discrete (Canada/China trade tension easing, APAC customer events, EMEA extra handling from trade disruption), requiring consistency for sustained outlook

Q&A: Analyst Interest

  • Upturn sustainability vs retained guidance: Management said Q1 beat came mainly from two items—lighter administrative expense timing (~1/3 of beat) and international mix/customer program strength (~2/3). They emphasized quarterly variability (mix/“puts and calls”) and requested more consistency before changing full-year guidance.
  • Lockup/free-float and near-term selling overhang: Management clarified ~30% floated at IPO; ~70% remains under Bay Grove’s purview. They stated there’s “no impetus” forcing sell-down of that 70%, calling most holders long-term, including Bay Grove on the Board, and saw no looming selling pressure into 2026.
  • Peak new-supply impact timing: Management treated the “10%” excess-capacity figure as rounding and reiterated new supply deliveries slowing meaningfully in 2026–2027, declining below 2%. They said the industry is past the biggest impact (85% of network stable/growing) and expect remaining operators under pressure due to high basis.

Sentiment: MIXED

Note: This summary was synthesized by AI from the LINE Quarter and Year earnings transcript. Financial data is complex; please verify all metrics against official SEC filings before making investment decisions.

📋 Official Regulatory 10-K / 10-Q SEC Filings

Direct authenticated documentation links to audited SEC database reports for LINE.

SEC EDGAR Live Feed
Loading financial data and tables...
📁

SEC Filings (LINE)

© 2026 Stock Market Info — Lineage, Inc. (LINE) Financial Profile